Conheça o Mercado MQL5 no YouTube, assista aos vídeos tutoriais
Como comprar um robô de negociação ou indicador?
Execute seu EA na
hospedagem virtual
hospedagem virtual
Teste indicadores/robôs de negociação antes de comprá-los
Quer ganhar dinheiro no Mercado?
Como apresentar um produto para o consumidor final?
Novos Indicadores Técnicos para MetaTrader 4 - 4

SNR LEVEL INDICATOR Accurate Snr level indicator will only display Fresh Levels that are close to the Current Market Price. This indicator is very accurate in mapping Support & resistance levels. there is an alert feature when the price TOUCHES the SNR LEVEL, WHEN CLOSE CANDLE BREAK/REJECT SNR LEVEL.
INDICATOR MARKING :
- SUPPORT LEVEL = V SHAPE - RESISTANCE LEVEL = APEX LEVEL - GAP RESISTANCE & GAP SUPPORT = OPEN CLOSE CANDLE - SUPPORT BECAME RESISTANCE & RESISTANCE BECAME SUPPORT INDICATOR

"Scalping Signal No Repaint No Lag" é o único indicador no mercado que, ao ser arrastado para qualquer gráfico, carrega automaticamente todos os indicadores necessários sem a necessidade de carregar qualquer template ou outros indicadores. Ele configura automaticamente o gráfico para que fique exatamente como na imagem fornecida. Este indicador garante sinais sem repintura ou atraso, tornando-o ideal para estratégias de scalping em todos os pares de moedas e intervalos de tempo (TF). Funcionali

Depois de o mercado ter atingido um topo ou um fundo importante, entra numa correção e encontra o seu valor justo.
O indicador calcula automaticamente:
Nível do valor justo Canal de correção Distância em pips do valor justo para os limites do canal de correção Onda sinusoidal que começa a partir da primeira vela de nível de valor justo e se expande ao longo do tempo mostrando os níveis máximos esperados de expansão de ajuste antes de uma quebra. Uma quebra da onda sinusoidal é seguida por u
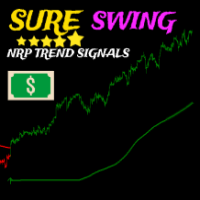
Com base em vários indicadores integrados combinados, o indicador Sure Swing é um indicador de seta baseado em tendência de quadro de tempo múltiplo que fornece sinais de negociação de swing, este indicador não é repintado. Como negociar: abra uma negociação de compra quando uma seta verde com alerta de compra aparecer, o stop loss estiver abaixo da seta e o lucro for 1 vez o risco mínimo abra uma negociação de venda quando uma seta vermelha com alerta de venda aparecer, o stop loss estiver aci

Payne Trend é um indicador de filtro de tendência que fornece uma possível direção do mercado na forma de linhas finas coloridas, este indicador ajuda o trader a tomar decisões de negociação com base na tendência real atual, o indicador tem muitos níveis que significam poder e fraqueza da tendência, este indicador não não repintar ou pintar de volta e o sinal não está atrasado.
=================================================
Parâmetros:
Período: período de tendência Modo: modo de cálcul

O indicador "Breakout Buy-Sell" foi desenvolvido para identificar e destacar potenciais oportunidades de compra e venda com base em rompimentos de preços durante diferentes sessões de mercado (Tóquio, Londres e Nova York). Este indicador ajuda os traders a visualizar claramente as zonas de compra e venda, bem como os níveis de take-profit (TP) e stop-loss (SL). Estratégia de Uso O indicador pode ser usado da seguinte maneira: Configuração Inicial : Selecione a sessão do mercado e ajuste o offset

Indicatorul MOTANO
Bună ziua!
Tocmai am terminat indicatorul MOTANO după multă muncă.
Este un indicator de săgeată.
Merge perfect pe M15, aproape orice pereche.
Săgețile indică intrările de cumpărare și vânzare, iar o țintă de profit de 5,10 sâmburi asigură un profit sigur.
Un profit și mai mare poate fi stabilit, în funcție de situație.
Dar cuvintele sunt de prisos.
Testați-l și trageți propriile concluzii. Indicatorul MOTANO nu revopsește. Rezultate foarte bune pe GBPUSD - M1.
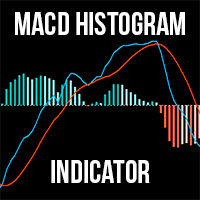
For MT5 The MACD Histogram Indicator is an enhanced version of the traditional MACD indicator, offering superior insights into market trends and momentum shifts. Unlike the default MACD in MT4, this version features a histogram , making it easier for traders to visualize and interpret market conditions. Advantages over the default MACD indicator: Enhanced Visuals: The histogram provides a bar chart representation of the difference between the MACD line and the signal line, making it simpler to i
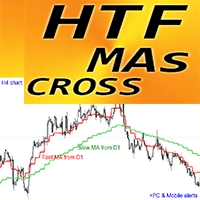
Indicador Forex "Médias Móveis HTF Cruzadas" para MT4
Atualize seus métodos de negociação com o poderoso indicador HTF Moving Averages Cross para MT4. HTF significa - Prazo Maior Este indicador é excelente para Trend Traders com entradas de Price Action. Ele permite que você anexe médias móveis rápidas e lentas de um período de tempo superior ao seu gráfico atual -> este é um método profissional. HTF MAs CROSS possui alertas integrados para celular e PC Este indicador dá oportunidade de obter
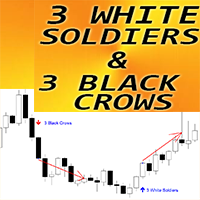
Indicador Forex "3 padrões de soldados brancos e 3 corvos negros" para MT4
O indicador "3 Soldados Brancos e 3 Corvos Negros" é muito poderoso para negociação de Price Action: Sem repintura, sem atrasos; O indicador detecta padrões de 3 Soldados Brancos e 3 Corvos Negros no gráfico: Padrão de alta de 3 soldados brancos - sinal de seta azul no gráfico (ver fotos) Padrão de baixa de 3 Black Crows - sinal de seta vermelha no gráfico (ver fotos) Alertas de PC, celular e e-mail estão incluídos O i
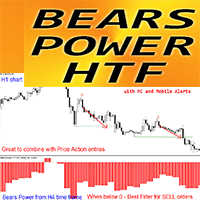
Indicador Forex Bears Power HTF para MT4
O oscilador Bears Power HTF é um filtro perfeito para entradas de "venda". HTF significa - Prazo Maior Os indicadores Bulls and Bears Power são usados na negociação para medir a força das tendências correspondentes na negociação. Bears Power mede a força da posição dos vendedores O indicador Bears Power HTF é excelente para sistemas de negociação Multi-Time Frame com entradas de Price Action ou em combinação com outros indicadores. Este indicador per
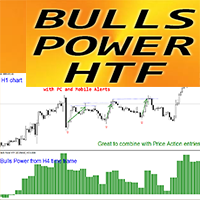
Indicador Forex Bulls Power HTF para MT4
O oscilador Bulls Power HTF é um filtro perfeito para entradas de "compra". HTF significa - Prazo Maior Os indicadores Bulls and Bears Power são usados na negociação para medir a força das tendências correspondentes na negociação. Bulls Power mede a força da posição dos compradores. O indicador Bulls Power HTF é excelente para sistemas de negociação Multi-Time Frame com entradas de Price Action ou em combinação com outros indicadores. Este indicador
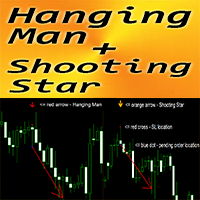
Indicador Forex "Padrão Homem Enforcado e Estrela Cadente" para MT4
O indicador "Padrão Hanging Man e Shooting Star" é um indicador muito poderoso para negociação de Price Action: Sem repintura, sem atrasos; O indicador detecta padrões de baixa do Homem Enforcado e da Estrela Cadente no gráfico: Bearish Hangman - Sinal de seta vermelha no gráfico (ver fotos) Bearish Shooting Star - Sinal de seta laranja no gráfico (ver fotos) Alertas de PC, celular e e-mail estão incluídos Indicador "Hanging
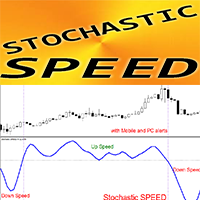
Indicador Forex "Velocidade Estocástica" para MT4 - ótima ferramenta preditiva!
O cálculo deste indicador é baseado em equações da física. A velocidade estocástica é a primeira derivada do próprio estocástico A velocidade estocástica é ótima para escalpelamento de entradas quando o estocástico está na zona de sobrevenda/sobrecompra e a velocidade está fazendo um gancho de recuperação (veja as fotos) Recomenda-se usar o indicador Stochastic Speed para estratégias de negociação dinâmica: Se a

FREE UNLIMITED PM : https://linktr.ee/ARFXAUTOTRADE?utm_source=linktree_admin_share
Trend Line is very useful for trader friends, both for mapping following trends and counter trends, here I am sharing an auto trend line indicator I made that you can use to make it easier for you to see the market.
How to use trend line:
01. Follow our trend, wait for the trend line to return and touch our trend line and form a continuation pattern on the candle stick 02. Counter Trend We wait for 1 ca
FREE
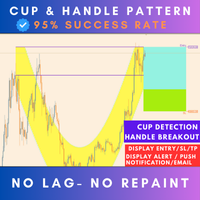
Live Trading Results MT5 Version Contact for Manual Guide Next Price $125 Free Scanner Dashboard (Contact me) Strategy - Breakout / Retest / Aggressive Hello Everyone, We are excited to introduce one of the most reliable and high win rate patterns in trading: the Cup and Handle . This is the first time we are releasing this meticulously crafted indicator, boasting an impressive 95% success rate . It is versatile and effective across all types of pairs, stocks, indices,

FREE UNLIMITED PM : https://linktr.ee/ARFXAUTOTRADE?utm_source=linktree_admin_share
Fibo Musang Break ReeTes is used as confirmation and mapping when making an entry, and generally this indicator will form when the candle makes a breakout (Mother candle or Snr). To make this indicator easier, I created an auto draw Fibo and I added a multi time frame function to the awesome oscillator indicator to make it easier to read trend verification using multi time monitoring.
The following are the
FREE
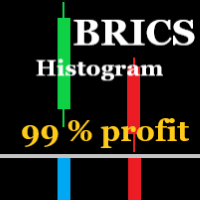
BRICS HISTOGRAMĂ Bun venit ! Cumpăra din bara albă a histogramei. Vindeți la bara galbenă a histogramei. Acest indicator este indicatorul săgeților BRICS transformat într-un indicator histogramă. Pe AUDCHF, GBPUSD, AUDJPY, NZDUSD, USDJPY funcționează foarte bine. Eu recomand – GBPUSD, M15, SL = 0 sâmburi, TP = 10 sâmburi minim. El funcționează în mod constant cu rezultate foarte bune. Alt Perechile pot da semnale mai rare sau pot avea unele pierderi sau nu funcționează. Indicatoare

"Trend Finder" is a trend trading strategy that combines market noise filtration and all necessary functions in one tool! The system automatically displays entry and exit points using arrows. Only one parameter is sufficient for configuration. It offers simple, intuitively understandable, and effective trend detection. The intelligent algorithm of the "Trend Finder" indicator identifies potential market reversal points. Often, a good trend can be visually observed on the price chart. However, a

Liquidity Pro The Liquidity Pro pin points liquidity zones in any financial instrument, including currency pairs, cryptocurrencies, commodities, equities and indices. The Liquidity Pro shows previous and current liquidity zones, down to the present minute, providing essential information about your chosen trading pair, when conducting chart analysis or initiating trades. Remember each trading pair requires a different price separation value for M5, M15 and M30 Tally, to provide accurate data. Y

Chart Clarity Dashboard The Chart Clarity Dashboard provides clear insights into price movements for various financial instruments like currency pairs, cryptocurrencies, equities, commodities, and indices. This dashboard displays detailed price information in real-time, making it easier for traders to make decisions quickly. It shows price movements down to the second, giving you essential data before you trade or analyze charts. Chart Clarity Dashboard allows you to monitor price changes acros

Backtest with good trend detection results from January 2023
EURUSD Time frame: m15, m30, H1
AUDUSD Time frame: m15, m30 NASDAQ Time frame: m15 S&P 500 Time frame: m15, m30 XAUUSD Time frame: m30 BTCUSD Time frame: H4
These are just some of the assets tested (Please note that past results are no guarantee of future results). Note that this is not a complete strategy, you can use this indicator as an entry trigger after your analysis by setting stop loss and take profit values that you d

Volume Clarity Pro The Volume Clarity Pro provides clarity in the movement of price for any financial instrument, including currency pairs, cryptocurrencies, equities, commodities and indices. The Volume Clarity Pro maps out where price is consolidating, retracing, resisting or settled in areas of support. The Volume Clarity Pro accurately displays the month's price action, offering crucial data about your selected trading pair for chart analysis and trade initiation. The Volume Clarity Pro is

The Your Honor trend indicator is based on price divergence and is designed to analyze and determine market entry points. It can also be used as a filter in trading. The indicator has only two parameters: Period and Level. The Level parameter helps eliminate unnecessary signals. For example, for EURUSD the Level can be set, for example, to 0.0001. Your Honor can be used to both identify entry points and filter signals. The indicator displays information in a clear manner. It is important to reme
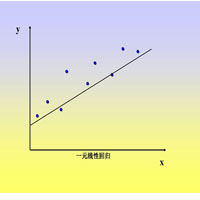
This index is used to calculate the linear regression slope of the K line in a period of time. The algorithm adopts the least square method.
1. Suitable for each cycle chart.
2. Can be used to calculate opening price, closing price, high price, low price, middle price.
3. Specify the start time and end time in the parameters.
Note that the start time and end time cannot be weekends, select the calculated price, pay attention to capital letters.
FREE
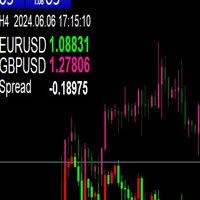
This indicator can be used to add a candle chart of another variety to the chart of the current variety.
1. The chart height will be adjusted automatically
2. If you switch the current icon period, the K of another variety will also switch to the corresponding period
3. In the upper left corner of the chart, the current cycle, the current time, and the current price and spread of the two targets will be displayed.
4. When switching cycle, due to a large number of data retrieval, it wi
FREE
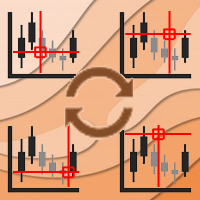
Async Charts is an indicator to synchronize charts and display a customized crosshair (cursor) on all selected charts. This is a useful utility for traders using multiple timeframes of analyzing multiple symbols for trade entry or exit.
Main Features : Real time Crosshair Synchronization on All Selected Charts
Supports Multiple Timeframes and Multiple Symbols at the same time
Auto Scroll Option
Graphical Adjustment of Color, Font, Size, ...
Locking All or Locking Specific Charts
More and

The indicator is a set of parameters for setting three moving averages (fast, medium and slow), which can be used to analyze the market.
This indicator provides the ability to analyze market trends and make trading decisions based on the intersections of various moving averages. It also supports audio alerts for timely notification of trading signals.
LengthFaster: Sets the number of candles used to calculate the faster moving average. A value of 5 means using price data from the last 5 can
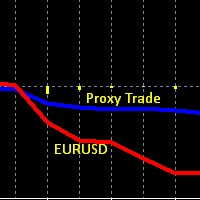
This is an obscure Hedge Fund like strategy, based one of our early indicators on EURUSD originally intended for day trading, while developing and testing the indicator we found out that the data used in this indicator (set of 4 currency pairs) follows EURUSD in a very peculiar way. On one hand these two are correlated, but the 4 currency proxy set tends to lag behind EURUSD, it lags on a day to day basis, and then catches up eventually after several days. And therefore can be used as a proxy

YK-Fibo Pivot Indicator: Trade Smarter with Fibonacci Pivot Points The YK-Fibo Pivot Indicator is a powerful technical analysis tool that combines the precision of Fibonacci retracements with the insights of Pivot Points. Whether you're a novice or seasoned trader, this indicator empowers you to spot profitable opportunities in the market with ease. Why Choose YK-Fibo Pivot? Pinpoint Support & Resistance: By calculating Fibonacci levels based on the previous day's high, low, and close prices, y

Introducing Smart Gold Pro, a versatile trading indicator suitable for all experience levels. It provides precise buy and sell signals for the gold market, adaptable to any timeframe. Powered by advanced algorithms, Smart Gold Pro accurately analyzes price movements and volume dynamics. What sets Smart Gold Pro apart is its reliability—it doesn't repaint past signals, ensuring dependable insights into potential market reversals. Its user-friendly visual interface on the chart, along with audible
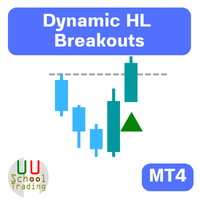
Description of Using the Dynamic HL Breakouts Indicator The Dynamic HL Breakouts indicator is a technical tool designed for trading trend-following assets. Its main purpose is to help traders identify key entry and exit points during strong trending periods of an asset. Components of the Dynamic HL Breakouts Indicator Highs and Lows This indicator calculates and displays the High and Low values for a specified period (e.g., the past 20 days) to create a price movement range for the asset. These

Trading Dashboard is a useful tool for your multiple trades. It contain information such as : - Breakeven point(price) of your multiple trades, - Loss point(price) of your trades, - Current Trading Day and Session, - Current Time and time left of candles, - Total Lot Buy & Sell, and sum of it - Spread and ATR of current time frame and symbol - Profit-Loss in percentage of your open trade

The RPO (Relative Price Oscillator) is a technical analysis indicator used in Forex trading to measure the momentum and trend strength of a currency pair. It is derived from the Relative Strength Index (RSI) but focuses on the difference between two moving averages of price, usually the closing price, over different periods. The RPO is similar to the MACD (Moving Average Convergence Divergence) but uses relative price levels instead of absolute price levels. Key Components: Short-Term Moving Ave

Description of Fibonacci Levels for Support and Resistance (SNR) with a Statistical Model Fibonacci levels are widely used in technical analysis to identify potential support and resistance levels in financial markets. These levels are derived from the Fibonacci sequence, a mathematical sequence where each number is the sum of the two preceding ones. The key Fibonacci retracement levels are 23.6%, 38.2%, 50%, 61.8%, and 100%.
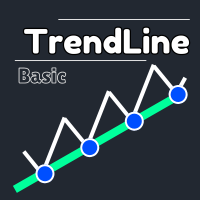
Essa ferramenta poderosa identifica automaticamente as linhas de tendência, ajudando você a simplificar sua estratégia de negociação e tomar decisões mais informadas. mt5 versão
Recursos -chave Detecção automática de linha de tendência : o indicador "Basic TrendLine" digitaliza o mercado em busca de linhas de tendência em potencial e as exibe instantaneamente no seu gráfico.Isso economiza tempo valioso e garante que você nunca perca uma tendência importante. Painel amigável : Nosso indicador v
WONNFX iN M5 - Arrow indicator for Forex and Binary Options. Reliable signal algorithm. Indicator not repaint. Indicator working hours: 21:55-23:00. GMT+2. Average winrate = 60-70%.
Recommendations: Timeframe: M5. Expiration: 2-3 candles (1 candle = 5 minutes) Symbol: EURUSD, USDJPY, EURAUD, GBPAUD, EURJPY, AUDUSD, USDCAD, NZDUSD, AUDCAD, AUDCHF, AUDJPY, AUDNZD, CADJPY, EURCAD, EURGBP, GBPUSD, GBPCAD, NZDJPY, CADJPY, XAUUSD
FREE

Indicador BRICS
Bem-vindo de volta à nossa página!
Compre na seta branca. Venda na seta amarela.
É muito simples.
Não vou entrar em detalhes.
Tenho certeza de que você tem experiência e conhecimento suficientes.
Acho que as imagens anexadas mostram muito claramente o poder deste indicador.
Em AUDCHF, GBPUSD, AUDJPY, NZDUSD funciona muito bem.
Pode ser que em outros pares dê sinais mais raros ou haja alguma perda.
Apenas tente!
Vou colocar para funcionar também.
Sucesso!

Introducing our exciting new Price Retest indicator! Get instant alerts when the price retests, giving you a powerful edge in your trading strategy. Remember to do your own analysis before making any moves in the market. MT5 Version - https://www.mql5.com/en/market/product/118159/ Here’s a detailed explanation of how the Price Retest indicator works, its components, and how you can incorporate it into your trading strategy: The Price Retest indicator is designed to notify traders when the pric
FREE

Renko Masterx é um indicador do tipo seta mt4 projetado para negociação com gráficos renko, este indicador possui um painel de backtesting que fornece ao trader informações úteis como taxa de vitória e pontos ganhos, também fornece tp e sl na multiplicação atr x, este O O indicador fornece seu sinal em uma barra aberta ou intrabarra, e possui um marcador branco que marcará o preço exato onde o sinal foi dado. A forma de utilizar este indicador é abrindo uma compra ou venda de acordo com a seta

A seta Spider renko é um indicador de seta baseado em renko que dá sinal na barra aberta/intra-barra e usa 2 estratégias para traçar o sinal. Este indicador pode ser usado para scalping de uma barra TP ou para swing trade se usado com períodos mais altos em suas configurações. Este indicador nunca repinta ou pinta de volta. ================================================= ======= Parâmetros: Período de entrada: período do sinal principal Período de filtro: período de filtro de sinal Alertas ==

Atm binário é um indicador de sinais de opções binárias que é baseado em 2 peças, o primeiro é em uma forma de uma linha colorida que diz a direção da tendência e dita as vendas em compras apenas, o segundo é um sinal de entrada em forma de um ponto que vem em BAR OPEN e nunca repinta e não é atrasado.
COMO UTILIZAR :
esperar que um ponto de venda apareça na barra aberta se a barra anterior tinha uma cor de linha de venda do que abrir uma venda, sua expiração é essa mesma vela fechar
espe

The BMW M5 is a high-speed indicator designed for scalping, providing extremely accurate and rapid signals for price direction changes on any timeframe, including the smallest ones: M1 and M5. It works on all currency pairs, allowing traders to analyze the market using an intraday scalping trading system. Operating on the M1 and M5 timeframes, it provides traders with dozens of entry signals every day. Usage Recommendations: When the indicator changes the red line to blue, it is the most suitabl

We have combined all of our beloved indicators the likes of: Key level order block , Key level supply and demand , Key level liquidity grab and Key level wedge into one single indicator and dashboard.
Whats new Dashboard : There is an easy access dashboard for all your needs. Multi-timeframe button : There is now a multi-timeframe option for Order Blocks and Supply and demand zones, making it easy to see higher timeframe zones easily on the current timeframe by just clicking the desired timefr
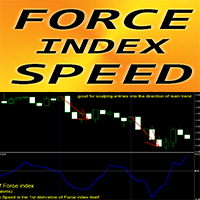
Indicador Forex "Velocidade do índice de força" para MT4
O cálculo deste indicador é baseado em equações da física. Índice de força A velocidade é a primeira derivada do próprio índice de força O índice de força é um dos principais indicadores que combina dados de preço e volume em um único valor Índice de força A velocidade é boa para escalar entradas na direção da tendência principal: use-o em combinação com qualquer indicador de tendência adequado Índice de força O indicador de velocidade
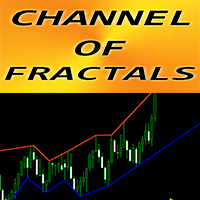
Indicador Forex "CANAL de FRACTALS" para MT4
Este indicador mostra linhas de tendência locais reais com base em máximos/mínimos de fractais Ótimo para traders que usam análise gráfica Linhas de tendência locais de resistência - Cor vermelha Apoie linhas de tendência locais - cor azul Possui poucos parâmetros responsáveis pelo número de fractais, cores e largura das linhas de tendência
// Mais excelentes Expert Advisors e Indicadores estão disponíveis aqui: https://www.mql5.com/en/users/de

Indicador Forex "Padrão Hanging Man" para MT4
O indicador "Padrão Hanging Man" é um indicador muito poderoso para negociação de Price Action: Sem repintura, sem atrasos; Indicador detecta padrões de baixa do Homem Enforcado no gráfico: Sinal de seta vermelha no gráfico (veja fotos) Alertas de PC, celular e e-mail estão incluídos O indicador "Padrão Hanging Man" é excelente para combinar com Níveis de Suporte/Resistência: https://www.mql5.com/en/market/product/100903
// Mais excelentes Exper
Engulfing Candle Signal Alert: Elevate Your Trading Strategy Unlock the full potential of your trading with the Engulfing Candle Signal Alert, the ultimate tool for identifying market reversals and enhancing your trading precision. Designed specifically for traders who value accuracy and timely alerts, this powerful indicator detects engulfing candle patterns, a key signal in technical analysis that often indicates a potential shift in market direction. What is an Engulfing Candle? An engu
FREE

Advantages of the Tick Volume Indicator: Identifying Market Sentiment : A predominance of green bars on the histogram may indicate an uptrend or strong buying pressure, useful for determining entry points for long positions. A predominance of red bars indicates a downtrend or strong selling pressure, useful for determining entry points for short positions. Analyzing Market Activity : The indicator helps identify periods of high activity, when significant changes are occurring in the market, and
FREE UNLIMITED PM : https://linktr.ee/ARFXAUTOTRADE?utm_source=linktree_admin_share
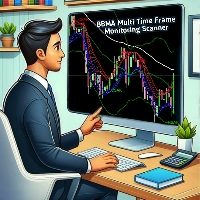
This BBMA FULL SETUP Scanner indicator is based on Multi Time Frame Monitoring and can be used for direct entry when a signal appears. Rules for Using Indicators: 1. Wait for Full Setup BBMA / EMA 50 Cross Mid BB 20 2. Wait for Reentry / Reetes CANDLE when CSAK / CSM occurs 3. Stop Loss Candle CSAK / CSM is formed 4. Take Profit = 2-5 x Stop Loss Distance If you want to use this indicator for free and unlimit
FREE
Elegant RSI indicator can generate RSI divergence with the availability of user defined filters. It can generate voice alerts for RSI oversold and RSI Overbought situations. Moreover it can also generate voice alerts for RSI Divergneces as well as when price breaks above or breaks below the support and resistances created upon divergence ouccurence. The voice alerts are generated in a way that you will know which market has reached the oversold and overbought conditions as well as the rsi Dive

FREE UNLIMITED PM : https://linktr.ee/ARFXAUTOTRADE?utm_source=linktree_admin_share
Bagaimana Cara membaca market melalui FMCBR-W - Didalam dunia trading ini pelbagai cara digunakan oleh trader dan penganalisa market membaca dan memahami trend. - Dari sudut FMCBR permulaan trend atau permulaan pullback dikenali melalui CB1. Apa pun dari sudut FMCBR-W trend didefinasikan melalui 3 combinasi yang saya akan kupas di muka surat seterusnya nanti. - Saya amat berharap agar pengunaan FMCBR-W nanti
FREE

The Awesome ATR Indicator is a technical analysis tool developed for the MetaTrader 4 (MT4) platform. This indicator is designed to assist traders in determining stop loss and take profit levels based on the average value of the Average True Range (ATR). By leveraging the market volatility data provided by ATR, this indicator offers more accurate and dynamic guidance in setting these crucial trading levels. Key Features: Dynamic Stop Loss Determination: Calculates stop loss levels based on the A
FREE
Sync Cursor MT4 Sync Cursor MT5 https://www.mql5.com/en/market/product/118259 MT4 Tool will It make the Horizontal Line + Vertical Line in the Screen That it is always present on the screen and that it moves along with the candle (with the price). I am sure that something so simple will be a Treasure in the hands of many people. Some of my personal trades are posted voluntary and free of charge in this Public channel https://t.me/FXScalpingPro Contact: https://t.me/TuanNguyenTrader
FREE
ダイバージェンス はオシレーター系のテクニカル指標が、実際の相場とは逆方向に向かって動いている状態のことを指し、その後のトレンド転換の可能性を示す戦略として有効です。
このインディケータは特に有効性の高いMACDのダイバージェンスを利用した 裁量トレード用サインツールです。
高頻度かつ高い 勝率で サインを発信しますが、各種の強力なフィルターにより、さらに精度の高いサインに絞ることが出来ます。また、通常のダイバージェンスに加えリバーサル( 隠れダイバージェンス) によるサイン発信も可能です。
全通貨ペア、全タイムフレームで利用できます。勝敗判定機能により、このインディケータの直近の相場環境に対する有効性を確認できます。
設定項目は以下の通りです。 Enable Divergence...MACDのDivergenceによるサインの発信を有効にします。ピンクの矢印が表示されます Enable Reversal...MACDのReversal(Hidden Divergence)によるサインの発信を有効にします 。ブルーの矢印が表示されます Fast EMA Pe

Using this indicator, you can see the moving average of 7 time frames in (one time frame) the same time frame you are.
You can also set orders to enter buy or sell positions automatically when the price hits Moving.
You can also set orders to risk free or close existing positions when the price hits Moving.
Also, receive a notification on your mobile phone when the price hits Moving.or position will be risk free or close .

PTW NON REPAINT TRADING SYSTEM + HISTOGRAM Non-Repainting , Non-Redrawing and Non-Lagging Trading System.
Does the following: - Gives Accurate Entry and Exit Points - Scalping, Day and Swing Trading - 95% Accuracy - Targets, where to take profits. - Shows Trends, Support and resistance levels - Works on All Brokers - Works on All Currencies, CFDs and Stocks - It does not place trades for you, it only shows you what trades to place. - It works on All Timeframes - It is for Trend or ra

POWER TO GET WEALTHY TRADING SYSTEMS.
NON REPAINT REVERSAL ARROW AND CHANNEL Intra-Day trading and Scalping Strategy: Designed for fast and accurate day trading and short-term trades.
Day and Swing Trading Strategy: Can be used as a reliable tool for day and swing traders who aim for the big moves of the price.
Multi Currencies and Markets: Works on different instruments and markets with its reliable precision.
Multi Timeframes: Can be used on multiple timeframes with good perfor

Manual guide: Click here WEEK SALE PROMO: $59 ONLY! -- Next price is $120 .
This indicator is unstoppable when combined with our other indicator called Support & Resistance . After purchase, send us a message and you will get it for FREE as a BONUS! I like to use Trend Punch on XAUUSD on the M1 timeframe & higher ones! Introducing Trend Punch , the revolutionary forex trend indicator that will transform the way you trade! Trend Punch is uniquely designed to provide pre

Fractals Dynamic Fractals Dynamic – é um indicador fractal livre modificado de Bill Williams, no qual você pode definir manualmente o número de barras à esquerda e à direita, construindo assim padrões exclusivos no gráfico. Agora, todas as estratégias de negociação baseadas ou baseadas no indicador Fractals Dynamic terão um sinal adicional.
Além disso, os fractais podem atuar como níveis de suporte e resistência. E em algumas estratégias de negociação para mostrar os níveis de liquidez. Par
FREE
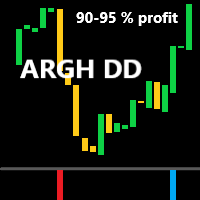
Indicador de compra e venda ARGH DD
Este indicador é um indicador de histograma.
É um indicador poderoso e preciso com poucos falsos positivos.
As negociações que eles acionam duram dias ou semanas.
Mas são transações muito estáveis.
Claro, as regras de entrada são muito simples:
️ a barra azul do histograma indica a abertura de uma posição de compra;
️ a barra vermelha do histograma indica a abertura de uma posição de venda.
Não devemos nos surpreender que, após a abertura de

O ruído do mercado é um indicador que determina as fases do mercado em um gráfico de preços e também distingue movimentos de tendência suaves e claros de movimentos planos barulhentos quando ocorre uma fase de acumulação ou distribuição.
Cada fase é boa para seu próprio tipo de negociação: tendência para sistemas que seguem tendências e plana para sistemas agressivos. Quando o ruído do mercado começa, você pode decidir sair das negociações. Da mesma forma, e vice-versa, assim que o ruído acab

O indicador LEVELSS mostra:
- Zona diária de alta e de baixa. É visível todos os dias das 00:00 às 23:59. - A zona semanal de alta e baixa. É visível de segunda-feira 0:00 a sexta-feira 23:59 todas as semanas. - Canal especialmente calculado a partir de um período de tempo específico que é exibido em todos os outros períodos de tempo. Por defeito, este é o período de 4 horas que pode ser alterado para qualquer outro período de tempo que deseje negociar. É calculado sem parar.
No canto supe

Nosso indicador Basic Support and Resistance é a solução necessária para aumentar sua análise técnica.Este indicador permite que você forneça níveis de suporte e resistência no gráfico/ MT5 grátis
Recursos
Integração dos níveis de Fibonacci: Com a opção de exibir níveis de Fibonacci, juntamente com os níveis de suporte e resistência, nosso indicador fornece uma visão ainda mais profunda do comportamento do mercado e possíveis áreas de reversão.
Otimização de desempenho: Com a opção de atua
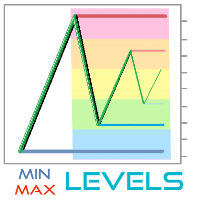
MinMax Levels MinMax Levels – é um indicador dos níveis de preço máximo, mínimo e de abertura para períodos de negociação importantes: dia, semana e mês.
Cada participante do mercado Forex utiliza níveis em seu sistema de negociação. Podem ser o sinal principal para a realização de transações ou um sinal adicional, atuando como ferramenta analítica. Neste indicador, dias, semanas e meses foram selecionados como períodos importantes, uma vez que são os principais períodos de negociação dos
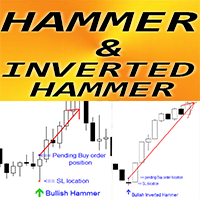
Indicador Forex "Padrão de martelo e martelo invertido" para MT4
O indicador "Padrão Martelo e Martelo Invertido" é um indicador muito poderoso para negociação de Price Action: Sem repintura, Sem atrasos; O indicador detecta padrões de alta do Martelo Invertido e do Martelo no gráfico: Martelo Invertido de Alta - Sinal de seta azul no gráfico (ver fotos) Martelo de alta - sinal de seta verde no gráfico (ver fotos) Alertas de PC, celular e e-mail estão incluídos Indicador "Martelo e padrão de
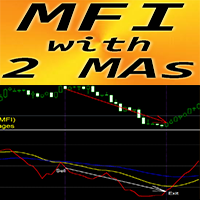
Indicador Forex "MFI e 2 médias móveis" para MT4
O Money Flow Index (MFI) é um oscilador técnico que utiliza dados de preços e volumes para identificar zonas de sobrevenda e sobrecompra. O indicador "MFI e 2 médias móveis" permite que você veja as médias móveis rápidas e lentas do oscilador MFI O indicador dá oportunidades para ver a mudança de tendência muito cedo É muito fácil configurar este indicador através de parâmetros, ele pode ser usado em qualquer período de tempo Você pode ver as c
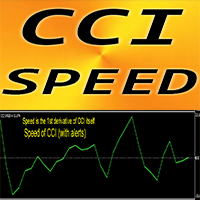
Indicador Forex "Velocidade CCI" para MT4
O cálculo deste indicador é baseado em equações da física. CCI Speed é a primeira derivada do próprio CCI O Commodity Channel Index (CCI) mede a diferença entre o preço atual e o preço médio histórico O CCI Speed é bom para escalar entradas na direção da tendência principal: use-o em combinação com qualquer indicador de tendência adequado O indicador de velocidade CCI mostra a rapidez com que o próprio CCI muda de direção - é muito sensível Se o valor
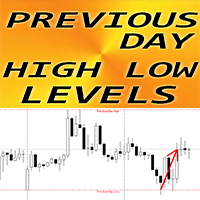
Indicador Forex "Níveis altos e baixos do dia anterior" para MT4
O indicador "Níveis altos e baixos do dia anterior" é um indicador auxiliar muito útil Ontem, os níveis máximo e mínimo são tão importantes porque o preço muitas vezes se recupera deles Esses níveis podem ser considerados suporte e resistência confiáveis - o preço os respeita muito É um indicador útil para traders intradiários que usam métodos de negociação de reversão e scalping. Muito bom para combinar com Price Action também

Indicador Forex "ATR Trailing Stop" para MT4
Atualize seus métodos de negociação com o excelente indicador auxiliar ATR Trailing Stop para MT4. Este indicador é perfeito para fins de Trailing Stop O ATR Trailing Stop se adapta automaticamente à volatilidade do mercado Sem atrasos e configuração fácil Este indicador é excelente para combinar com entradas de ação de preço na direção da tendência principal
// Mais excelentes Expert Advisors e Indicadores estão disponíveis aqui: https://www.mql
O Mercado MetaTrader é o melhor lugar para vender robôs de negociação e indicadores técnicos.
Você apenas precisa desenvolver um aplicativo para a plataforma MetaTrader com um design atraente e uma boa descrição. Nós vamos explicar como publicar o seu produto no Mercado e oferecer a milhões de usuários MetaTrader.
Você está perdendo oportunidades de negociação:
- Aplicativos de negociação gratuitos
- 8 000+ sinais para cópia
- Notícias econômicas para análise dos mercados financeiros
Registro
Login
Se você não tem uma conta, por favor registre-se
Para login e uso do site MQL5.com, você deve ativar o uso de cookies.
Ative esta opção no seu navegador, caso contrário você não poderá fazer login.