Conheça o Mercado MQL5 no YouTube, assista aos vídeos tutoriais
Como comprar um robô de negociação ou indicador?
Execute seu EA na
hospedagem virtual
hospedagem virtual
Teste indicadores/robôs de negociação antes de comprá-los
Quer ganhar dinheiro no Mercado?
Como apresentar um produto para o consumidor final?
Novos Indicadores Técnicos para MetaTrader 4 - 11

AI Supertrend timely alerts
MT4 Super Trend timely reminder indicator introduction I. Overview of indicators The MT4 Super Trend Alert Indicator is a technical analysis tool specifically designed for the MetaTrader 4 platform to help traders accurately capture changes in market trends and send timely signals to alert traders to potential trading opportunities. It is based on a unique AI-based algorithm that takes into account factors such as price volatility, trend strength, and market volatil
Descrição do Indicador de Suporte e Resistência Baseado em Volume Profile para MetaTrader 4 Introdução O mercado financeiro é uma arena onde traders e investidores buscam constantemente maneiras de encontrar vantagens competitivas. Um dos conceitos mais amplamente utilizados e respeitados em qualquer mercado é o de suporte e resistência . Esses níveis representam zonas-chave de preço onde a oferta e a demanda se equilibram, e onde grandes decisões são tomadas pelos participantes que movimentam o

MT4 platform AI T3 MA Super Fill indicator use introduction I. Overview of indicators
The AI T3 MA Super Fill indicator is a powerful analytical tool that combines advanced algorithms and T3 moving average technology to provide traders on the MT4 platform with accurate market trend judgments and trading signals. It uses intelligent algorithms to deeply process the price data, and displays the changes of the T3 moving average in a unique way to help traders more effectively grasp the market dyn
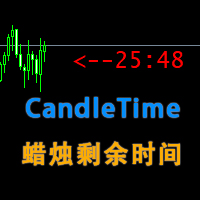
MT4CandleTime index introduction
MT4CandleTime is an indicator for the MT4 platform, which can display the remaining time of the current K line in the form of an intuitive digital countdown, which is convenient for traders to grasp the trading rhythm.
Precise time control: The MT4CandleTime indicator provides traders with extremely accurate K-line remaining time data, enabling them to fine manage the time rhythm in the trading process, avoiding the hasty or delayed trading decisions caused by
Introduction to the use of MT4 platform AI Color Gradient Volume indicators I. Overview of indicators
AI Color Gradient Volume is an innovative volume analysis indicator based on artificial intelligence technology for the MT4 platform. By converting the volume data into an intuitive color gradient graph, it helps traders to have a more acute insight into the inflow and outflow of funds in the market and the strength of the buying and selling forces, so as to provide strong support for trading
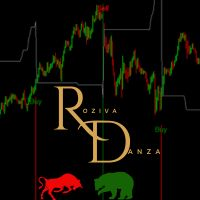
This custom trading indicator utilizes the Average True Range (ATR) to identify buy and sell opportunities based on price movement. It can optionally employ Heikin Ashi candles to reduce noise and produce smoother signals. The indicator is optimized for use on a 1-hour timeframe and is designed for long-term trading strategies. Works best with symbols: AUDUSD, EURUSD, USDJPY, GBPUSD, US500, US30, XAUUSD, BNBUSD Configure Settings : Configure Settings : Set KeyValue to 9.0 . Set ATRPeriod to 11 .
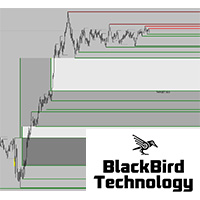
New market liquidity indicator, more accurate with two levels, will really unhide the "hidden agenda" of the price action in any timeframe. Forget all other indicator and use what professional traders are using ! For more information about market liquidity, a manual on how to use this indicator please send me a message.
A lot of information can be found on the net. (search liquidity trading/ inner circle trader)
https://www.youtube.com/watch?v=yUpDZCbNBRI
https://www.youtube.com/watch?v=2LIad2

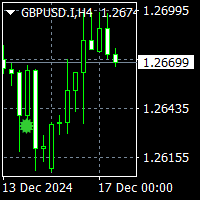
Super Scalp Indicator MT4 is a unique trend reversal 100% non-repainting multi-algo indicator that can be used on all symbols/instruments: forex, commodities, cryptocurrencies, indices, stocks . Super Scalp Indicator MT4 will determine the current trend at its early stages, gathering information and data from up to 10 standard algos When indicator give a valid buy or sell signal, a corresponding arrow will be printed on the chart, open trade at start of the next candle/bar
To get access to MT5 version please click here . This is the exact conversion from TradingView: "Exit-Willy Alerts" by " barrettdenning ". This is a light-load processing and non-repaint indicator. All input options are available. Buffers are available for processing in EAs. You can message in private chat for further changes you need. Thanks for downloading

Best Divergence Indicator for advanced traders without distraction of lines or arrows. It is not a magic blackbox for novice traders rather a great tool for experienced traders to decide their entry and exit. Can be used for most of the Forex pairs, Gold, Oil, Crypto. Flexibility to play with input to customize ur unique research too. Therefore, I will suggest turning off arrows and divergence line to reduce clutter and instead use the following advice: For sell on divergence indicator start tu
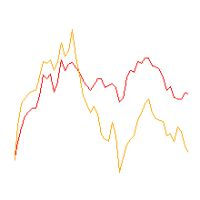
Line1: simple calculation of change in closing price for the chosen input period - named Velocity. Line2: simple calculation of change in velocity for the chosen input period - named Acceleration. Feel free to play with the input periods to find a profitable combination. For faster results it is best to do it in MT Optimizer. Can assist in either manual or automatic trading.

After your purchase, feel free to contact me for more details on how to receive a bonus indicator called VFI, which pairs perfectly with Easy Breakout for enhanced confluence!
Easy Breakout is a powerful price action trading system built on one of the most popular and widely trusted strategies among traders: the Breakout strategy ! This indicator delivers crystal-clear Buy and Sell signals based on breakouts from key support and resistance zones. Unlike typical breakout indicators, it levera

Special offer : ALL TOOLS , just $35 each! New tools will be $30 for the first week or the first 3 purchases ! Trading Tools Channel on MQL5 : Join my MQL5 channel to update the latest news from me O indicador Supertrend Fakeout é uma versão aprimorada do clássico indicador Supertrend , projetado para fornecer sinais de tendência mais confiáveis. Ao incorporar recursos avançados como Fakeout Index Limit e Fakeout ATR Mult , este indicador ajuda a filtrar reversões de tendência fals
FREE
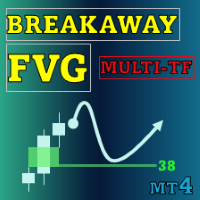
Special offer : ALL TOOLS , just $35 each! New tools will be $30 for the first week or the first 3 purchases ! Trading Tools Channel on MQL5 : Join my MQL5 channel to update the latest news from me A ferramenta Breakaway Fair Value Gaps (FVG) é uma solução inovadora projetada para ajudar traders a identificar áreas onde o preço se afastou do equilíbrio, fornecendo insights detalhados sobre as probabilidades de mitigação. Esta ferramenta não apenas destaca sinais críticos, mas també
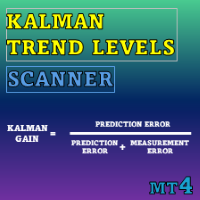
Special offer : ALL TOOLS , just $35 each! New tools will be $30 for the first week or the first 3 purchases ! Trading Tools Channel on MQL5 : Join my MQL5 channel to update the latest news from me Kalman Trend Levels é um indicador avançado de acompanhamento de tendências que utiliza a tecnologia de ponta do filtro de Kalman para fornecer aos traders sinais analíticos poderosos. Projetado para precisão e adaptabilidade, esta ferramenta não apenas identifica zonas críticas de supor

Upper and Lower Reversal - Sistema para previsão antecipada de momentos de reversão. Permite encontrar pontos de viragem de preços nos limites dos canais de movimento de preços superiores e inferiores.
O indicador nunca irá recolorir ou alterar a posição das setas de sinalização. As setas vermelhas são um sinal de compra, as setas azuis são um sinal de venda.
Ajusta-se a quaisquer prazos e instrumentos de negociação O indicador não redesenha, só funciona quando a vela fecha. Existem vários tip
Indicador Binary exfish para MT4 O Binary exfish é um indicador projetado para negociação de opções binárias nos períodos gráficos M1 e M5 . Funciona com qualquer par de moedas, analisando tendências e fornecendo sinais de entrada no gráfico: Seta azul — sinal de compra. Seta vermelha — sinal de venda. Características: Expiração padrão : 1 vela. Expiração ajustável: de 1 a 3 velas. Os sinais aparecem antes do fechamento da vela atual, garantindo decisões rápidas. Alertas incluem notificações son
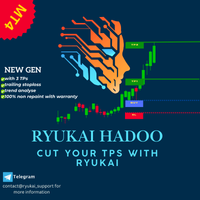
THER IS ERREUR WHILE UPLOADING THE FILE PLEAS CONTACT ME FOR FREE TRIAL RYUKAI HADOO is a professional and easy to use Forex trading system which is based on the best principles of trading using the best estrategys. The indicator provides accurate BUY and SELL signals including Stop Loss and Take Profit levels. You can trade even on the go using PUSH notifications. PLEASE CONTACT ME AFTER PURCHASE TO GET MY TRADING TIPS! If you're familiar with trading, you’ve likely come across popular strate
The Circle Intelligent Trend Indicator is a cutting-edge tool designed for MetaTrader 4 users who demand efficiency. This indicator brings the seamless TradingView experience directly to MT4, eliminating the need for templates and simplifying your trading setup.
Its standout feature is the Circle buy and sell signals, which are optimized for multi-timeframe analysis, allowing traders to make informed decisions with confidence. Whether you’re scalping, day trading or swing trading, the Circle I

The ABC Indicator analyzes the market through waves, impulses, and trends, helping identify key reversal and trend-change points. It automatically detects waves A, B, and C, along with stop-loss and take-profit levels. A reliable tool to enhance the accuracy and efficiency of your trading. This product is also available for MetaTrader 5 => https://www.mql5.com/en/market/product/128178 Key Features of the Indicator:
1. Wave and Trend Identification: - Automatic detection of waves based on mov

The "BioStar" indicator is an innovative tool for trend analysis on the Forex market. It has unique capabilities and a wide range of settings that will help traders make informed decisions when trading.
This indicator is based on the analysis of the market trend and helps to identify the direction of price movement. It uses various mathematical algorithms and statistical methods to determine the strength and stability of the trend in the market.
One of the key features of the "BioStar" indica

Moving average alert plus is an advance moving average alert that will easily monitor the price action based on set moving averages to multiple open charts. Objective: To monitor multiple open charts and notify traders conveniently in a single display panel when using the moving averages to enter/exit a trade. Features: Monitor price action in two timeframes at the same time Supports simple, exponential, smoothed, linear weighted moving averages Trigger an alert based on candle size (full/
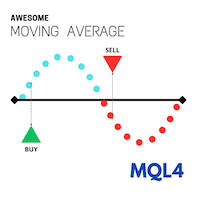
Overview
Discover a powerful yet simple indicator to identify market trends effectively! Awesome Moving Average (AWMA) is designed to detect bullish or bearish trends by analyzing price breakouts beyond the moving average line. Basically, the way this indicator works is similar to the Moving Average indicator available on the MetaTrader platform. As we know, the Moving Average indicator tends to be difficult to use when the market is in a sideways condition because it often gives false breakou
FREE

Hello, I need reviews from you guys. Thank you Fractal Swing Detector Pro Indicator is designed to help traders identify key swing points in the market . By combining fractal an d pivot analysis, this indicator provides deeper insights into price movements an d potential reversals. Key Features: Fractal Analysis: Identify high and low fractals with the option to use either 3 or 5 bar fractals . Fractals help detect minor reversal points within trends. Pivot Points: Advance d pivot
FREE

The indicator is a histogram that is great for showing when to enter the market
When the hump moves above the median go long and when it moves below the median go short
The colors can be adjusted as preferred
Suitable for any timeframe
Test in demo before purchase
Enjoy -------------------------------------------------------------------------------

The Breakaway Fair Value Gap (FVG) is a typical FVG located at a point where the price is breaking new Highs or Lows.
USAGE Figure 1 In the figure 1, the price range is visualized by Donchian Channels.
In theory, the Breakaway FVGs should generally be a good indication of market participation, showing favor in the FVG's breaking direction. This is a combination of buyers or sellers pushing markets quickly while already at the highest high or lowest low in recent history. Figure 2 Whi
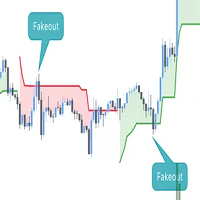
This script is an enhanced version of the classic Supertrend indicator. It incorporates an additional feature that ensures trend reversals are more reliable by introducing a Fakeout Index Limit and a Fakeout ATR Mult. This helps avoid false trend changes that could occur due to short-term price fluctuations or market noise. In smart money concept, when institute , "big-fish" want to buy, they usually sell first to take sellside liquidity and vice versal. This is why the indicator become importan

This product enables you to trade in opportunities that are detected by the indicator. Using advanced Calculations and formulae this product enables you to profit from trend opportunities. Trend master has Channels that show areas the trend is strong and you are likely to profit. Once this zone Is breached the price is on in uncertain territory and there is no guarantee the trend will continue This means there might be reversal and it is advisable to exit a trade here.

Do you want to beat the market? This indicator uses advanced mathematical formulae That include regression analysis to predict market trends. So what happens is That when the price is above the indicator line as depicted in the screenshot The trend is rising and when the price is below the indicator line the Trend is falling. This opportunities appear multiple times each day enabling You to profit. This indicator makes the trend your friend.
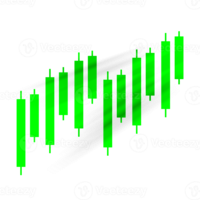
Bollinger trading is an indicator for mt4 that uses Bollinger bands and other trend following strategies To detect the direction of the market. Just as attached in the screenshot the light blue line shows areas The market is rising. This means opening positions here is in the direction of the trend. The dark blue lines cane be used for sell trades when the market moves in the opposing direction. Using this tactics you can have a clear sense of where the market is headed.

This product works by detecting trend opportunities. So as shown in the screenshot when The indicator shows an upward arrow it shows the market is on an uptrend and when the indicator Shows a downward arrow it shows the market is on a downward direction. What makes this indicator Special is that it has additional signals just below the arrow signals. It is up to the trader to be Creative and combine these signals with the arrow signal to get accurate forecasts.

Manh RSICrossingAlert with Alert Indicator is a versatile technical analysis tool that aids traders in identifying market trends and potential entry and exit points. It features a dynamic Manh RSICrossingAlert , adapting to market conditions for a clear visual representation of trend direction. Traders can customize parameters to align with their preferences and risk tolerance. The indicator assists in trend identification, signals potential reversals, serves as a trailing stop mechanism, and p

Special offer : ALL TOOLS , just $35 each! New tools will be $30 for the first week or the first 3 purchases ! Trading Tools Channel on MQL5 : Join my MQL5 channel to update the latest news from me Volumatic VIDYA (Variable Index Dynamic Average) é um indicador avançado projetado para rastrear tendências e analisar a pressão de compra e venda em cada fase de uma tendência. Utilizando o Promédio Dinâmico de Índice Variável (Variable Index Dynamic Average) como técnica central de sua

Forex Gunslinger é um indicador de sinais de reversão de COMPRA/VENDA projetado em torno da ideia de combinar suporte/resistência, cruzamentos e osciladores no modo MTF. Quando tudo está alinhado, o indicador gera um sinal de COMPRA ou VENDA. Embora o indicador seja baseado na ideia do MTF, o algoritmo é muito estável e gera sinais de reversão confiáveis. Este é um indicador do tipo MTF onde pode usar um período de tempo maior ou menor para calcular os sinais para o seu gráfico atual. Mas também

GOLDEN ARROW SCALPER! Principais Recursos: Sinais de Entrada Precisos : Identifique os momentos ideais para entrar no mercado com base em cálculos matemáticos, otimizando suas decisões de negociação. Alertas Instantâneos : Receba notificações sonoras em tempo real sempre que ocorrerem os sinais de negociação. Configuração Personalizável : Ajuste os parâmetros das EMAs para alinhar o indicador à sua estratégia e estilo de negociação. Visualização Intuitiva : Aproveite o uso de cores contrastante

Special offer : ALL TOOLS , just $35 each! New tools will be $30 for the first week or the first 3 purchases ! Trading Tools Channel on MQL5 : Join my MQL5 channel to update the latest news from me SMC é uma abordagem de trading que ajuda os traders a identificar zonas de liquidez, posições institucionais e pontos de reversão importantes no mercado. Ao aproveitar os princípios do SMC, os traders podem navegar pelo mercado de forma mais eficaz, encontrando entradas e saídas ideais.
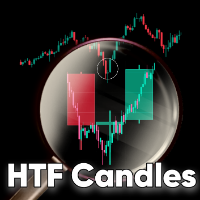
HTF Candles MT4 is a mt4 indicator which plots the outline of the higher time-frame candles on the lower candle, including any MT5 higher time-frame chosen. The indicator gives you the option to choose whether or not to view live current HTF candle, with no lag or repainting. Features MT5 Period Candles: This indicator plots any mt5 time-frame candle e.g m3, m5, m12, m15, m20... and so on, on the lower time-frame. Heiken Ashi Options: You have the option to view the HTF Heiken ashi instead of
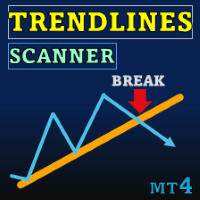
Special offer : ALL TOOLS , just $35 each! New tools will be $30 for the first week or the first 3 purchases ! Trading Tools Channel on MQL5 : Join my MQL5 channel to update the latest news from me Trendlines with Breaks Scanner é uma ferramenta de trading de última geração projetada para ajudar os traders a identificar tendências críticas e detectar rompimentos em tempo real. Com linhas de tendência geradas automaticamente com base em pontos de pivô, este indicador permite que os

High, Low, Open, and Close of Candles: Utilizing the Bombafkan Indicator Tool With the Bombafkan Indicator, you can easily view the high, low, open, and close of candles and analyze this price information across different timeframes. This feature helps you perform more accurate analyses and optimize your trading strategies with a comprehensive view of price movements. Additionally, the Bombafkan Strategy includes a setup called the "Candle-Side Signal," which allows you to easily take bu

Principais Características: O Golden Scalper XAU/USD foi criado para se adaptar às nuances do mercado de ouro, proporcionando sinais de alta qualidade Análise Avançada de Padrões: Usando técnicas de análise de padrões de preços, o indicador identifica as melhores oportunidades de entrada, evitando os falsos sinais e aumentando as chances de sucesso a cada operação. Alta Taxa de Assertividade: Baseado em algoritmos inteligentes, o indicador tem uma taxa de assertividade superior, proporcionando a
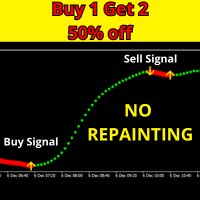
Principais Características: Algoritmo Avançado e Testado: O Scalper Trend Signals No Repaint é equipado com um dos algoritmos mais otimizados do mercado, garantindo uma análise de tendências precisa e confiável. Com mais de 15.000 testes realizados globalmente, ele é altamente eficaz para traders de todos os níveis. Filtros Únicos contra Sinais Falsos: O novo indicador é equipado com filtros algorítmicos exclusivos que minimizam sinais falsos. Isso o torna uma ferramenta extremamente útil, espec
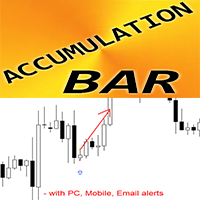
Padrão de barras de acumulação do indicador Crypto_Forex para MT4.
- O indicador "Accumulation Bar" é um indicador muito poderoso focado em ruturas para a negociação de Price Action. - O indicador deteta a acumulação de preço em área estreita durante 1 barra e mostra: direção de rutura, ordem pendente e localizações de SL. - Barra de acumulação de alta - Sinal de seta azul no gráfico (ver imagens). - Barra de acumulação de baixa - Sinal de seta vermelha no gráfico (ver imagens). - Sem repintur
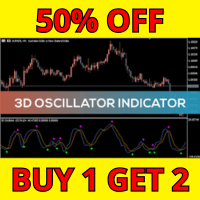
Os 7 Benefícios do 3D Oscillator: Tripla Perspectiva para o Mercado: O nome "3D Oscillator" não é por acaso. Ele integra três indicadores consagrados (RSI, Estocástico e CCI) em um único painel. Essa combinação oferece uma visão tridimensional do mercado, ajudando você a enxergar tendências ocultas e evitar armadilhas. Configuração Personalizável: Com parâmetros ajustáveis, como D1RSIPer , D2StochPer , e D3tunnelPer , o indicador se adapta a qualquer estilo de trading, seja você um scalper agres
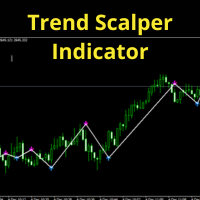
Principais Funcionalidades: Identificação Automática de Padrões: A IA integrada analisa o comportamento do mercado em tempo real para identificar padrões recorrentes de alta probabilidade. Reconhecimento de formações clássicas como triângulos, bandeiras e ombro-cabeça-ombro, além de padrões sutis capturados pela IA. Sinais de Compra e Venda: Sinais de entrada são exibidos diretamente no gráfico por meio de setas visuais (compra em verde e venda em vermelho), acompanhados de alertas sonoros e not

Indicador de interesse de mercado: sua vantagem na análise de sentimento de negociação Principais benefícios: Quantifica o envolvimento dos participantes do mercado em tempo real Combina ação de preço e dinâmica de volume Revela o sentimento oculto do mercado além dos indicadores tradicionais Adaptável em vários prazos e ativos Sistema de alerta precoce para potenciais mudanças de tendência Vantagens do Trader: Identificar períodos de entusiasmo crescente/decrescente do mercado Detectar potencia

The Scalper Boss indicator is a cutting-edge analytical tool designed to assess market conditions and identify optimal entry and exit points using a multi-layered logic framework. It adapts to changing market environments, providing traders with clear visual signals and trend lines. Its primary value lies in its ability to enhance market analysis by filtering noise and capturing meaningful movements, making it especially beneficial for scalping and intraday trading. While Scalper Boss does not g

Please contact me after your full purchase for great bonuses.
Adaptive Reversal Star Expert Advisor and an additional indicator as a gift Info Panel are waiting for you. Adaptive Reversal Star is a new generation indicator with an advanced Adaptive algorithm , which additionally tracks potential reversal points and compares the values of the current market volatility when forming the main signals

This Simple Smart Money Concepts indicator displays real-time market structure (internal & swing BOS / CHoCH), order blocks, premium & discount zones, equal highs & lows, and much more...allowing traders to automatically mark up their charts with widely used price action methodologies.
"Smart Money Concepts" (SMC) is used term amongst price action traders looking to more accurately navigate liquidity & find more optimal points of interest in the market. Trying to determine where institutional
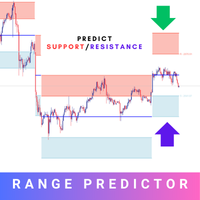
Introducing the Range Predictor : Your Ultimate Guide to Future Trading Ranges! Imagine having the power to see into the future of market moves— Range Predictor brings this dream to life. Designed to deliver real-time, predictive support and resistance levels , this tool goes beyond standard indicators, offering trend direction insights and precise range forecasts . Whether you're a day trader or a swing trader, the Range Predictor is your all-in-one toolkit for mastering the markets. MT5 Ver

Bitcoin 999 - is a trend indicator that automatically analyzes the market and provides information about the trend and each of its changes, as well as giving signals for entering trades without redrawing! The indicator uses each candle, analyzing them separately. referring to different impulses - up or down impulse. Exact entry points into transactions for currencies, crypto, metals, stocks, indices!
Main functions: Accurate entry signals WITHOUT REPAINTING! Once a signal appears, it remains
FREE

The Trend Ultimate Indicator is designed for visualizing and analyzing market trends, allowing traders to quickly assess current market tendencies. It is particularly useful for: Determining the duration of the current trend (bullish or bearish). Providing a clear visualization of price behavior relative to key moving averages and the MACD indicator. Supporting decision-making based on histogram dynamics (trend direction and intensity). Trend Ultimate does not guarantee profit but assists trader
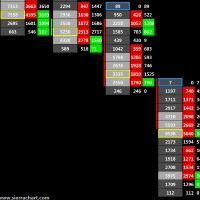
Indicador de Volume Cluster para MetaTrader 4: Análise Avançada de Suporte, Resistência e Dinâmica de Mercado O Indicador de Volume Cluster para MetaTrader 4 é uma ferramenta poderosa desenvolvida para traders que desejam obter uma compreensão profunda sobre a dinâmica do mercado. Ele fornece insights detalhados sobre o comportamento do volume dentro de cada candle, destacando níveis onde o volume está "super precificado" e regiões de fraqueza, permitindo a identificação precisa de zonas de supo

Este indicador personalizado para MetaTrader 4 é uma poderosa ferramenta desenvolvida para ajudar traders de todos os níveis de experiência a identificar tendências claras no mercado financeiro. Ele foi projetado com a finalidade de fornecer um suporte visual preciso, eliminando a confusão e a subjetividade muitas vezes associadas à análise gráfica. Além disso, garante que você possa permanecer em uma posição lucrativa durante toda a extensão de uma tendência, evitando a saída prematura antes q
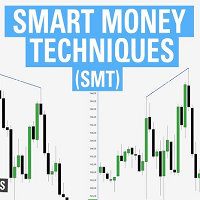
ICT SMT divergence represent a situation in the market where two correlated assets, being seen within the same timeframe, exhibit opposing structure. This can be seen in two positively correlated assets, as one asset forming a higher low, while the other forming a lower low instead of higher low. Version 1.03: Add Higher Timeframe support An ICT SMT divergence serves as the primary signal of reversal for correlated assets. If two positively correlated assets are moving higher and at a point one
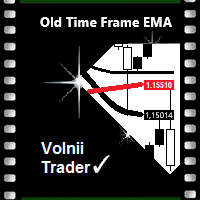
Old Time Frame EMA Индикатор двух динамических уровней сопротивления и поддержки Moving Average.
Данный индикатор рисует на открытом графике младшего тайм фрейма, ЕМА со старшего тайм фрейма. Создан для наглядности сигналов, для входа в рынок, для тех трейдеров, у кого Средние Скользящие Цены (ЕМА или МА),
являются основным сигналом для открытия или закрытия сделок. А также ориентиром, направлением тренда в движении
текущих цен, внутри дня и в среднесрочной торговле.
Возможные типы сред

The Market Heart indicator scans market entries after high volatility is noticed. Most big moves occur a short time after market volatility. Most big moves occur a short time after market volatility. The idea is to look for entries after the rectangles form and not necessarily as trade entry signals. . For example, you could use the Retracement Feeder indicator that generates arrow signals.
Market Heart MT5 Version
How to use: 1. Primary use The White Box is the first to be formed and
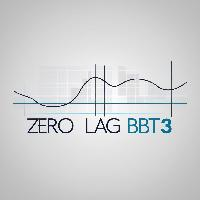
Is Zero Lag profitable? Not always, different system is for different pairs. You can play around with this indicator from Mladen, I have modified it with Bollinger Bands over T3.
You can change the period and how it calculate. MT5 version is available too.... Please leave a review , it helps us and we will share more indicators. .... Thank you and happy trading
FREE
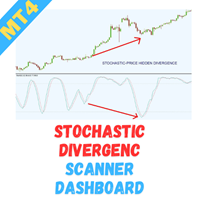
Welcome to the Stochastic Divergence Multicurrency Scanner Dashboard , an advanced tool designed to help traders efficiently detect Stochastic divergence patterns across multiple currency pairs. This scanner enables swift identification of potential reversal opportunities, providing a strategic advantage in your trading endeavors. Key Features: Effortless Multicurrency Scanning Monitor multiple currency pairs in real-time and receive instant alerts when significant Stochastic divergence patterns
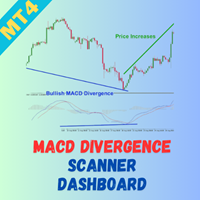
Welcome to the MACD Divergence Multicurrency Scanner Dashboard , a powerful tool designed to help traders quickly detect MACD divergence patterns across multiple currency pairs. This scanner allows for efficient identification of potential reversal signals, giving you a competitive edge in your trading strategy. Key Features: Effortless Multicurrency Scanning Monitor multiple currency pairs in real-time and receive instant alerts when significant MACD divergence patterns are identified. This cap

Everyone has heard that 95% of traders lose money, well join the 5% profitable one with 'The 5 Percent.
The 5 Percent Indicator: Join the Elite 5% of Traders. Manage risk and stay in the game by following the trends. Tired of being part of the 95% who lose money? The 5 Percent Indicator is your key to unlocking consistent profitability. This powerful tool provides clear, actionable signals, helping you make informed trading decisions and maximize your returns. Don't miss out on your chance to j

If you ever wanted to know your local time (or NY time) at any bar on the chart without needing to waste time with mental calculations, look no further.
This indicator creates a crosshair which you can drag anywhere on the chart and will show you the local time in a label on top of the time axis.
Press the "c" key to show/hide the crosshair. Left click it to pick it up and drag anywhere, left click again let it go.
You can't hide the crosshair without letting it go first.
Time setting inputs
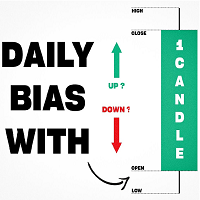
Inspired by TTrades video on daily bias, this indicator aims to develop a higher timeframe bias and collect data on its success rate. While a handful of concepts were introduced in said video, this indicator focuses on one specific method that utilizes previous highs and lows. The following description will outline how the indicator works using the daily timeframe as an example, but the weekly timeframe is also an included option that functions in the exact same manner.
On the daily timefr

EMA Cloud System is a Trading System Invented by Ripster where areas are shaded between two desired EMAs. The concept that the EMA cloud area serves as support or resistance for Intraday & Swing Trading. Can be utilized effectively on 10 Min for day trading and 1Hr/Daily for Swings. Ripster utilizes various combinations of 5-12 EMA clouds 34-50 EMA clouds among others. 8-9, 20-21 EMA clouds can be used as well. Adjust what works for you. Ideally 5-12 or 5-13 EMA cloud acts as sold fluid Trendlin
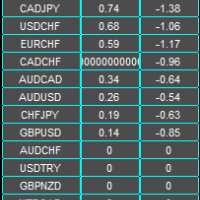
Abbeyfx Swap Dashboard displays your broker swap/interest rate. The implied swap/interest rate differential is for all currency pairs you have in your market watch.
Interest rate differential: The key factor traders consider is the difference in interest rates between two currencies involved in a pair, known as the "interest rate differential
Impact on currency value: A higher interest rate typically makes a currency more attractive, causing its value to rise relative to other currencies with
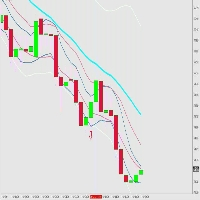
Signal Entry BBMA Low Risk High Reward Entry Friendly Use Using Fibo for TP 1, TP 2 , TP 3 , TP 4, TP 5, TP 6 , TP 7 , TP 8 , TP 9 , TP 10 Entry Low MA or Entry High MA Pair GOLD is The Best Pair EURUSD, GBPUSD, USDJPY Is Good Pair BTCUSD id Good Risk Manajemen only 1% entry and you get Profit 2-10% Recommended Broker https://one.exnesstrack.org/a/yyatk129ng If you want FullMargin Is Good but I recommended using Manajemen your Money

FX Dynamic: Acompanhe a Volatilidade e as Tendências com Análise ATR Personalizável Visão Geral
FX Dynamic é uma ferramenta poderosa que utiliza cálculos de Average True Range (ATR) para fornecer aos traders insights incomparáveis sobre a volatilidade diária e intradiária. Ao configurar limites de volatilidade claros —por exemplo, 80%, 100% e 130%—, você pode identificar rapidamente oportunidades de lucro ou receber alertas quando o mercado ultrapassar faixas normais. FX Dynamic se adapta ao f

Visão geral do produto gratuito, mas avançado Turbo Trend é um indicador poderoso projetado para ajudar os traders a identificar e agir com base nas tendências do mercado. Ele utiliza uma combinação de médias móveis avançadas e análise de volume para fornecer sinais claros da direção da tendência. O Turbo Trend simplifica a tomada de decisões ao categorizar as condições do mercado em três estados distintos: Tendência de Alta , Tendência de Baixa e Tendência Neutra, usando linhas codificadas por
FREE
Special offer : ALL TOOLS , just $35 each! New tools will be $30 for the first week or the first 3 purchases ! Trading Tools Channel on MQL5 : Join my MQL5 channel to update the latest news from me Visão Geral
OA SnR Power é uma ferramenta poderosa projetada para ajudar traders a identificar e avaliar a força dos níveis de suporte e resistência. Incorporando fatores-chave como volume de negociação, frequência de rebote e número de testes, este indicador fornece uma visão abrangent
FREE
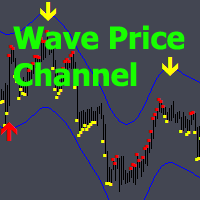
Wave Price Channel - Sistema analítico de trading desenvolvido para a procura de impulso e correção.
O indicador permite trabalhar no sentido do canal de preços, que é construído com base na volatilidade.
Quando é desenhada uma seta para cima ou para baixo no canal, torna-se possível ir nesta direção; o sinal nesta direção é confirmado por um indicador de ponto que é sensível às alterações de preço.
Enquanto os pontos da mesma cor continuarem, o sinal continua. Se houver uma seta, mas não houve
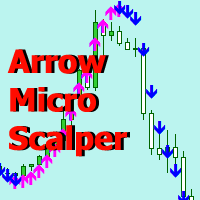
Arrow Micro Scalper é um indicador desenvolvido para scalping e trading de curto prazo, integrado com qualquer gráfico e instrumento financeiro (moedas, criptografia, ações, metais).
No seu trabalho ela utiliza a análise de ondas e um filtro de direção de tendência. Recomendado para utilização em intervalos de tempo de M1 a H4.
Como trabalhar com o indicador.
O indicador contém 2 parâmetros externos para alteração de configurações, os restantes já estão configurados por defeito. As setas grand
O Mercado MetaTrader oferece um local conveniente e seguro para comprar aplicativos para a plataforma MetaTrader. Faça download de versões de demonstração gratuitas de Expert Advisors e indicadores a partir do seu terminal para testes no Testador de Estratégia.
Teste os aplicativos em diferentes modos para monitoramento do desempenho e assim fazer um pagamento para o produto que você deseja, usando o sistema de pagamento MQL5.community.
Você está perdendo oportunidades de negociação:
- Aplicativos de negociação gratuitos
- 8 000+ sinais para cópia
- Notícias econômicas para análise dos mercados financeiros
Registro
Login
Se você não tem uma conta, por favor registre-se
Para login e uso do site MQL5.com, você deve ativar o uso de cookies.
Ative esta opção no seu navegador, caso contrário você não poderá fazer login.