YouTubeにあるマーケットチュートリアルビデオをご覧ください
ロボットや指標を購入する
仮想ホスティングで
EAを実行
EAを実行
ロボットや指標を購入前にテストする
マーケットで収入を得る
販売のためにプロダクトをプレゼンテーションする方法
MetaTrader 4のための新しいテクニカル指標

SMCセッションインジケーターは 、ICTコンセプト、流動性ハント、 セッションベースの戦略 に頼る スマートマネートレーダー 向けに作られた高精度ツールです。機関投資家レベルのトレーダーが使用する最も実績のある人気のコンセプトを使用して、重要なセッションベースの取引ゾーンをシームレスにマッピングします。このオールインワンセッションインジケーターは、 ICTアジアレンジ、ロンドンブレイクアウト、ニューヨークレンジ、ICTロンドンオープンキルゾーン、ICTニューヨークオープンキルゾーン、オープニングレンジブレイクアウト(ORB) ( ロンドン、ニューヨーク、東京を カバー)、強力な ミッドナイトオープニングレンジ など、最も効果的で確率の高いレンジ戦略をチャートにオーバーレイします。また、 シドニー、東京、ロンドン、 ニューヨーク などの 主要な外国為替取引セッション も強調表示します。各レンジは 、タイムボックス手法を使用して最高の精度で描画され、 主要な FVG(フェアバリューギャップ)、レンジスイープ、セッションの高値/安値、 および潜在的な マーケットメーカーの操作ゾーン
メタトレーダー4用 エリオット波動理論インジケーター エリオット波動理論インジケーターは、FX市場のプロフェッショナルな概念に基づいて設計されています。このインジケーターは、市場構造を波として描き、1〜5の上昇波・下降波としてピークをカウントします。これにより、ユーザーはエリオット波を視覚的に把握し、新しいナンバーが出た際にアラートを受け取ることができます。本インジケーターには2種類の波(メイン波とサブ波)があり、大きな波と小さな波を異なる色で表示することが可能です。ユーザーはそれぞれを有効または無効にすることもできます。 追加リソース 市場分析力をさらに高めたいトレーダーには、こちらの高度なツールもおすすめします: マーケットストラクチャーブレイクアウト(MSB)。 このインジケーターは、エリオット波動インジケーターを補完し、市場構造のブレイクポイントを特定します。 https://www.mql5.com/en/market/product/109958 主な特徴 ダブル波動検出 : メイン波とサブ波を同時に識別し、市場の動きを総合的に可視化します。 自動
FREE

Hello fellow trader, I have built this indicator by combining trend and entry mechanisms i have used for years. This is one of my high probability strategies. All calculations are done based on pure price action-based market structure.
Multiple confluences are used to validate and filter entries. All calculations are done behind the scenes, and you are given only buy sell signals. Accuracy becomes higher and higher as you trade higher timeframes, also based on my experience with the technique,

ロンドンセッションブレイクアウト戦略インジケーター は 、ICT(Inner Circle Trader) と Smart Money Concepts(SMC) を実践するトレーダー向けに設計されており、ロンドンセッション中のセッションベースの 流動性ハンティング、キルゾーン、 マーケットメーカーの行動 に焦点を当てています。このツールは、 GMT 午前0時 から午前7時までの価格高値と安値(一般的に ロンドンキルゾーン または マーケットメーカーレンジ と呼ばれます)を捕捉します。トレーダーは、機関投資家の活動とボラティリティの急上昇が最も多い潜在的なブレイクアウトゾーンを特定するのに役立ちます。
このインジケーター は、セッションタイムボックス、価格レンジ、フェアバリューギャップ(FVG)、 ブレイクアウトレベル を、鮮明なグラフィックで視覚的に強調表示します。ロンドンセッションにおける主要な動きである 、流動性スイープ、レンジコンソリデーション、 そして 急激な価格上昇 の分析をサポートします。流動性ゾーンと市場構造の変化を反映することで、トレーダーは価格が上昇または反
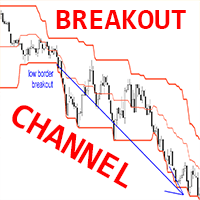
Crypto_Forex MT4用インジケーター「ブレイクアウトチャネル」、リペイント機能なし。
- このインジケーターは、高値/安値のブレイクアウトに基づく完全なトレーディングシステムとして使用できます。 - パラメーターは「ヒストリーデプス」1つだけで、インジケーターが考慮するローソク足の数を表します。 - パラメーター「ヒストリーデプス」の推奨値:時間枠 D1 - 20(1か月)、H4 - 30(1週間)、H1 - 24(1日)。 - ブレイクアウトチャネルは3つのラインで構成されています。ハイボーダー - 過去N本(ヒストリーデプスパラメータ)のローソク足の最高価格、ローボーダー - 過去N本(ヒストリーデプスパラメータ)のローソク足の最低価格、ミドルライン。 - このインジケーターは、他のインジケーターやプライスアクションパターンと組み合わせて使用できます。 - ブレイクアウトチャネルインジケーターの使用例は、画像をご覧ください。
// 優れたトレーディングロボットとインジケーターは、こちらから入手できます: https://www.mql5.com/en/user
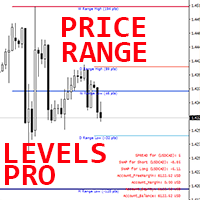
MT4用FXインジケーター「Price Range Levels Pro」
- インジケーター「Price Range Levels Pro」は、非常に便利なプロ仕様の補助取引ツールです。 - 価格(価格帯レベル)によって到達可能な日次、週次、月次における最も可能性の高い水準を表示します。 - 日次レンジはデイトレーダーに便利です。 - 週次と月次レンジはスイングトレーダーや長期トレーダーに便利です。 - このインジケーターは、テイクプロフィットの目標設定やストップロスの設定に最適です。 - スプレッド・スワップ情報表示機能を搭載しており、接続されたFXペアの現在のスプレッドとスワップを表示します。 - 画面には、口座残高、エクイティ、マージンも表示されます。 - スプレッド・スワップ情報表示機能は、チャートの任意の場所に配置できます。 0 - 左上隅、1 - 右上隅、2 - 左下隅、3 - 右下隅。
// 優れたトレーディングロボットとインジケーターは、こちらから入手できます: https://www.mql5.com/en/users/def1380/seller これは、こ

Crypto_Forex MT4用インジケーター「 RSI SPEED 」は、優れた予測ツールで、リペイント機能はありません。
- このインジケーターの計算は物理学の方程式に基づいています。RSI SPEEDはRSI自体の1次導関数です。 - RSI SPEEDは、主要トレンドの方向にスキャルピングエントリーするのに適しています。 - 適切なトレンドインジケーター(例えばHTF MA(画像参照)など)と組み合わせて使用してください。 - RSI SPEEDインジケーターは、RSI自体がどれだけ速く方向転換するかを示します。非常に敏感です。 - モメンタムトレード戦略にはRSI SPEEDインジケーターの使用をお勧めします。RSI SPEEDインジケーターの値が0未満の場合は価格モメンタムが下降し、RSI SPEEDインジケーターの値が0を超える場合は価格モメンタムが上昇します。 - インジケーターにはモバイルとPCのアラートが組み込まれています。
// 優れたトレーディングロボットとインジケーターは、こちらから入手できます: https://www.mql5.com/en
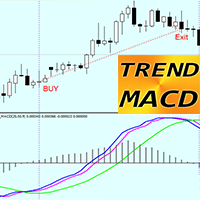
MT4用 TREND MACD インジケーターは、優れた効率的な取引ツールです!
- このインジケーターは、大きな値動きを捉えることに重点を置くトレンドトレーダーに最適です。 - TREND MACDは3本の線で構成されています。緑の線は主要なトレンド方向を示し、青とマゼンタの線はエントリーとエグジットを示します。 - このインジケーターは利益を最大化するのに役立ちます。利益が出た取引から早期にエグジットしないよう保護します。 - モバイルとPCの両方でアラート通知が可能です。
買い取引におけるインジケーターの使用方法(画像参照): 1) 青とマゼンタの線が両方とも緑の線より上にあることを確認します。 2) 青の線がマゼンタの線より上にある場合は、買い注文を出します。 3) 青の線がマゼンタの線より下にある場合は、取引をエグジットします。 4) 売り取引の場合は逆の手順となります。
// 優れたトレーディングロボットとインジケーターは、こちらから入手できます: https://www.mql5.com/en/users/def1380/seller これは、このMQL5ウェブサ
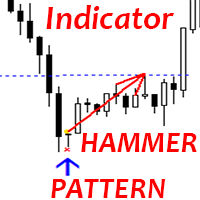
Crypto_Forex MT4用インジケーター「ハンマーパターン」
- インジケーター「ハンマーパターン」は、プライスアクション取引に非常に強力なインジケーターです。リペイントや遅延はありません。 - インジケーターはチャート上で強気のハンマーパターンを検出します。チャート上に青い矢印シグナルが表示されます(画像参照)。 - PC、モバイル、メールでアラート通知が可能です。 - インジケーター「ハンマーパターン」は、サポート/レジスタンスレベルと組み合わせるのに最適です。
// 優れたトレードロボットとインジケーターは、こちらから入手できます: https://www.mql5.com/en/users/def1380/seller これは、このMQL5ウェブサイトでのみ提供されるオリジナル製品です。
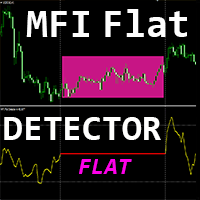
Crypto_Forexインジケーター「 MFI FLAT Detector 」は、取引における効率的な補助ツールです!リペイント不要。 このMT4対応の優れたインジケーターで、あなたの取引手法をアップグレードしましょう。
- このインジケーターは、チャート上の価格がフラットな領域を表示します。「フラット感度」パラメータが搭載されており、フラットな領域を検出します。 - 「MFI FLAT Detector」はダイバージェンス検出に非常に有効で、プライスアクションと組み合わせるのも効果的です。 - トレンドフォローシステムでフラットゾーンを検出し、そこでの取引を回避するために使用できます。 - リバーサルスキャルピングで使用でき、フラットな境界線からの反転を狙って取引できます。 - 標準的なMFIオシレーターの代わりに「MFI FLAT Detector」を使用する機会は数多くあります。 - マネーフローインデックス(MFI)自体は、価格と出来高データを使用して売られ過ぎと買われ過ぎの領域を特定するテクニカルオシレーターです。 - MFIが80を超える場合は買われ過ぎから売りエント

ニューヨークレンジインジケーターは 、ICT(インナーサークルトレーダー) コンセプト、スマートマネー取引、 機関投資家向けのプライスアクション手法 を適用するトレーダー向けに開発されたセッションベースの分析ツールです。ニューヨークセッション向けに特別に設計されたこのインジケーターは、 ロンドン終値 と ニューヨーク始値 に重なる重要な時間帯である、 GMT 12:00 から14:00の価格帯を捕捉します。 セッションの高値と安値 を特定し、 フェアバリューギャップ(FVG) を検出し、潜在的な 流動性スイープゾーンを 強調表示することで、トレーダーが マーケットメーカーの行動、セッションレンジのブレイク 、 リトレースメントの機会 を正確に分析するのに役立ちます。
この戦略は 、ニューヨーク・キルゾーン と ロンドン・ニューヨーク・セッションの 重なり合い 中に発生する 市場構造の変化 と 蓄積・分配パターン を理解することに重点を置いています。このインジケーターは 、構造のブレイク(BOS)、市場構造の変化(MSS)、変位キャンドル、不均衡ゾーン、 流動性ボイド といった
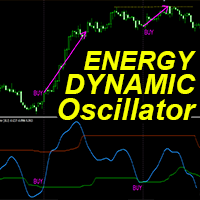
「ダイナミック・エナジー・オシレーター」は、MT4向けの高度なカスタムCrypto_Forexインジケーターです。効率的な取引ツールです!
- 新世代のオシレーターです。使い方は画像をご覧ください。 - ダイナミック・エナジー・オシレーターは、適応型の売られ過ぎ/買われ過ぎゾーンを備えています。 - トレンド相場で非常に有用なテクニカルモメンタムインジケーターです。 - オシレーターは、売られ過ぎ/買われ過ぎエリアから正確なエントリーポイントを見つけるための補助ツールです。 - 売られ過ぎ値:グリーンラインより下、買われ過ぎ値:オレンジラインより上。 - 標準的なオシレーターよりもはるかに正確です。対応時間足:M30、H1、H4、D1、W1。 - PCとモバイルのアラート機能付き。
// 優れたトレードロボットとインジケーターは、こちらから入手できます: https://www.mql5.com/en/users/def1380/seller これは、このMQL5ウェブサイトでのみ提供されるオリジナル製品です。
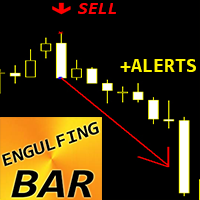
Crypto_Forex MT4用インジケーター ENGULFINGバーパターン
- インジケーター「ENGULFINGバー」は、プライスアクション取引に非常に強力なインジケーターです。リペイントや遅延はありません。 - インジケーターはチャート上のエングルフィングバーパターンを検出します。 - 強気エングルフィングバー - チャート上の青い矢印シグナル(画像参照)。 - 弱気エングルフィングバー - チャート上の赤い矢印シグナル(画像参照)。 - PC、モバイル、メールアラート対応。 - インジケーター「ENGULFINGバーパターン」は、サポート/レジスタンスレベルと組み合わせるのに最適です。
// 優れたトレードロボットとインジケーターは、こちらから入手できます: https://www.mql5.com/en/users/def1380/seller これは、このMQL5ウェブサイトでのみ提供されるオリジナル製品です。

ICTロンドンオープンキルゾーンインジケーターは 、 ICT、SMC (スマートマネーコンセプト)、 流動性に基づく市場構造戦略 といった制度的コンセプトを実践する外国為替トレーダー向けに設計された、 スマートマネー ベースの取引ツールです。このインジケーターは、アジアセッションとロンドン市場のオープンの間の流動性フローの重複により、ボラティリティと価格変動が顕著になることで知られる、 GMT 午前6時 から午前8時までのロンドンオープンキルゾーンをハイライトします。
この時間帯は、マーケットメーカーが流動性ハンティングを行う高確率のセットアップの トリガーゾーン として機能することがよくあります。このインジケーターは キルゾーンレンジを自動的にマークし 、前セッションの高値と安値の スイープ 、特に アジアセッションレンジを 特定します。これらの流動性スイープは、多くのICTエントリーモデルの重要な要素です。このツールは、スイープ後に価格が プレミアムゾーン または ディスカウントゾーン に達したかどうかを分析するのに役立ち、 MSS(市場構造シフト)、 構造の崩
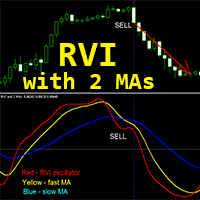
Crypto_Forex インジケーター「RVIと2本の移動平均線」MT4用、リペイント機能なし。
- Relative_Vigor_Index (RVI) 自体は、トレンド相場で非常に有用なテクニカルモメンタムインジケーターです。 - 「RVIと2本の移動平均線」インジケーターを使用すると、RVIオシレーターの高速移動平均線と低速移動平均線を確認できます。 - このインジケーターは、特にD1、H4、H1、M30といった長い時間軸でのモメンタムトレードに最適です。 - このインジケーターはパラメータ設定が非常に簡単で、どの時間軸でも使用できます。 - 買いと売りのエントリー条件は画像で確認できます。 - 買いエントリー条件: (1) 黄色の高速移動平均線が青色の低速移動平均線を上回っている、(2) 赤色のRVIラインが黄色の高速移動平均線を上回っている、(3) 赤色のRVIラインが黄色の高速移動平均線から上方に反発している。 - 売りエントリー条件: (1) 黄色の高速MAが青色の低速MAを下回っている、(2) 赤色のRVIラインが黄色の高速MAを下回っている、(3) 赤色のR
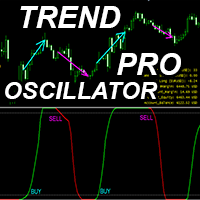
Trend Oscillator Pro は、高度なカスタムCrypto_Forexインジケーターで、効率的な取引ツールです!
- 高度な新しい計算方法を採用 - パラメーター「計算価格」には20種類のオプションがあります。 - これまでで最もスムーズなオシレーターです。 - 上昇トレンドは緑色、下降トレンドは赤色で表示されます。 - 売られ過ぎ値:5未満、買われ過ぎ値:95以上。 - このインジケーターを使用すれば、標準的な戦略であっても、アップグレードする機会が豊富にあります。 - PCとモバイルの両方でアラート機能を備えています。 - インジケーターにはスプレッド・スワップ情報ディスプレイが搭載されており、インジケーターが接続されているFXペアの現在のスプレッドとスワップが表示されます。 - 画面には、口座残高、エクイティ、マージンも表示されます。 - スプレッド・スワップ情報ディスプレイは、チャートの任意の場所に配置できます。 0 - 左上隅、1 - 右上隅、2 - 左下隅、3 - 右下隅。
// 優れたトレーディングロボットとインジケーターは、こちらから入手できます:
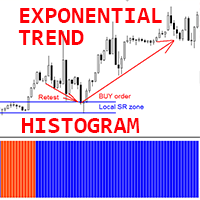
Crypto_Forex MT4用インジケーター「指数トレンドヒストグラム」、リペイント機能なし。
- 指数トレンドヒストグラムインジケーターは、トレンド検知に非常に効果的です。 - 最適な使用方法は、サポート/レジスタンスレベルとリテストテクニックを組み合わせることです(画像参照)。 - インジケーターが新しいトレンドを検知したら、ローカルSRレベルを探し、そのゾーンの再テストに備えて対応する指値注文を設定します。 - 新しいトレンドが強気の場合は、買い指値指値注文を設定します。新しいトレンドが弱気の場合は、売り指値指値注文を設定します。 - インジケーターの色は2色です。弱気な下降トレンドは赤、強気な上昇トレンドは青です(色は設定で変更できます)。 - モバイルとPCの両方でアラート機能があります。
// 優れたトレードロボットとインジケーターは、こちらから入手できます: https://www.mql5.com/en/users/def1380/seller これは、このMQL5ウェブサイトでのみ提供されるオリジナル製品です。

MetaTrader 4用の Cycle Trend Indicator は、上昇トレンドまたは下降トレンドに関係なく、市場のサイクルとトレンド内の重要な転換点を高精度で分析、認識、特定するために特別に設計された高度なテクニカルツールです。チャートから明らかにわかるように、このインジケーターは、価格の全体的な動きを滑らかで調和のとれた方法で追従する滑らかな曲線と、新しい上昇または下降サイクルの開始の可能性を示す赤と緑の矢印(明確で即座に認識できる視覚的信号)を組み合わせており、非常に価値のある取引サポートを提供します。 メインのチャートとは別のウィンドウに依存する従来のテクニカルオシレーターとは異なり、 Cycle Trend Indicator は価格チャート上で直接動作し、価格変動をより即時的で自然かつ統合的に把握できます。これにより、タイムリーで直感的かつ視覚的に解釈しやすい信号を求めるトレーダーに特に適しています。インジケーターのカラー曲線は、支配的なトレンドの方向に基づいて動的に変化します:上昇時は明るい緑、下降時は深い赤です。一方、矢印は反転確率が最も高い瞬間に生成され、市
MetaTrader 4用の Trend Reversal Indicator は、静的パターンや時代遅れなルールに依存せず、市場の反転ポイントを極めて正確に特定するように設計された次世代のプロフェッショナル指標です。高度なアルゴリズム構造を基盤としており、ボラティリティや流動性の変化に動的に適応し、金融市場の実際の動きと完全に連動した信頼性の高いシグナルを提供します。 従来の予測ツールとは異なり、 Trend Reversal Indicator は静的で効果の薄いロジックを使用せず、リアルタイムで市場状況に適応します。時代遅れのモデルに基づいた恣意的な予測を行わず、技術的深みを持って現在の市場行動をインテリジェントに解釈します。この動的適応性により、レンジ相場でも強いトレンド相場でも極めて信頼性が高く、偽シグナルを大幅に削減し、あらゆる戦略の運用品質を向上させます。 主な特徴: 適応ロジックによる市場転換点の検出 リアルタイムで更新されるインテリジェントアルゴリズム 瞬間的なボラティリティや市場構造を考慮 未来を予測せず、現在の市場行動を深く分析 利点: 明確でフィルタリングされた

トレンドファインダーオシレーター は、 MetaTrader 4 プラットフォーム向けに特別に開発された高度なテクニカル指標です。進行中のトレンドの開始だけでなく、その強さと成熟度も識別できる信頼性の高い精密なツールをトレーダーに提供します。この指標は、市場の2つの基本的な要素である ボラティリティ と モメンタム を組み合わせた詳細な分析に基づいています。固定的なしきい値と反復的なパターンで過買い・過売り状態を示すだけの従来のオシレーターとは異なり、このツールはさらに進化しており、市場のより深い内部ダイナミクスをリアルタイムで解釈し、文脈に即した関連性の高い実用的なシグナルを提供します。 中心の均衡線を周って振動しますが、 トレンドファインダーオシレーター は単純な数値しきい値よりもはるかに洗練された内部ロジックで構築されています。この指標は、 ボラティリティ拡張 と モメンタム圧縮 の高度なアルゴリズムを統合しており、市場が明確な方向性で大幅に加速しようとする重要な瞬間を特に強調するように設計されています。このダイナミックなアプローチにより、トレーダーはトレンドの初期段階を事前に把

IMPULSE HUNTER Impulse Hunter は、 アジア 、 ロンドン 、 ニューヨーク という世界の主要市場セッション中に発生する重要なブレイクアウトを捉えるために設計された、プロフェッショナル向けのダイナミックなトレーディングインジケーターです。 セッションベースのブレイクゾーン 、 段階的な利確ターゲット 、 通貨ペアごとに最適化されたストップロス が視覚的に表示され、明確な取引判断をサポートします。 最新情報を受け取るには、ぜひ当チャンネルにご参加ください: 新機能、改善点、限定リリースをお届けします: https://www.mql5.com/en/channels/forexnewadvisor
迅速な対応をご希望の方は、Tel にてご連絡ください。ユーザー: forexnewadvisor
主な機能 各セッションの開始時: インジケーターが高値と安値を基に、基準となるボックスをチャート上に描画します。 ブレイクアウト検出: 価格がボックスを上抜けまたは下抜けした場合、新たなトレンドの始まりとして検出されます。 エントリーおよび

このインジケーターは、 アグレッシブなスキャルピング や バイナリーオプションでの素早いエントリー のために設計されています 。 毎ローソク足 ごとにシグナルを生成し、常に何が起きているかを正確に把握できます。
ライブ取引をご覧ください: https://youtu.be/QR5F_9uIb6k チャンネルに参加しよう: https://www.mql5.com/en/channels/forexnewadvisor
リペイントなし :現在のローソク足のシグナルは リアルタイム で生成され、まだ形成中の間は、前のローソク足の終値を上下に超えるかどうかで色が変わる可能性があります。
しかし、ローソク足が 確定 すると、シグナルの色は 完全に固定されます 。変更されず、消えず、動きません。 見たままがそのまま残ります。
なぜこのように設計されているのか? 多くのスキャルパーは、 ブレイクアウトや急激な価格変動 が発生した瞬間にすぐにシグナルを受け取りたいと考えているため、迅速に反応できるよう設計されています。
一方で、 ローソク足が確定してからのエントリー
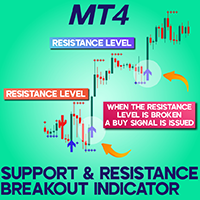
Support Resistance Breakout Indicator (SRBAI) download for MetaTrader 4
The Support Resistance Breakout Indicator (SRBAI) available for MetaTrader 4 (MT4) is designed to highlight significant pivot zones by mapping support and resistance levels on the price chart. Blue dashed lines represent support zones, while red dashed lines indicate resistance levels. Once the price breaks through a support area, the indicator generates a sell alert with a red downward-pointing arrow. Conversely, a resista
FREE
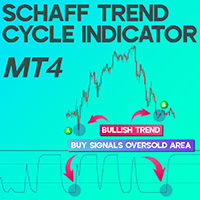
Schaff Trend Cycle Indicator for MetaTrader4 The Schaff Trend Cycle Indicator for MetaTrader4 merges the core functionalities of two widely used indicators—MACD (Moving Average Convergence Divergence) and the Stochastic Oscillator. This tool is engineered to identify trend reversals and momentum extremes with enhanced sensitivity. Readings below 25 often signal an oversold market, while values above 75 highlight overbought conditions. This makes the STC highly reliable for early trend recognitio
FREE

Average Daily Range (ADR) Indicator for MetaTrader 4 The Average Daily Range (ADR) Indicator for MetaTrader 4 is a vital technical analysis tool used to assess the typical price movement range an asset experience during a trading day.
By analyzing the average distance between daily highs and lows over a specified number of days, this indicator defines the ADR High (upper boundary) and ADR Low (lower boundary), helping traders identify possible support and resistance zones. «Indicator Installatio
FREE
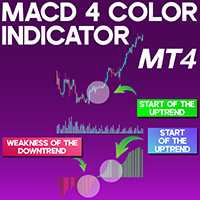
MACD 4 Color Indicator for MetaTrader 4
The MACD 4 Color Indicator for MetaTrader 4 (MACD 4C) is a refined upgrade of the traditional MACD, designed to not only indicate trend direction but also visualize the strength of the trend using four distinct color codes. These color variations are derived from the gradient of the moving average lines. It is particularly effective for identifying when a trend begins or starts to fade. The tool also incorporates divergence and convergence principles, mak
FREE
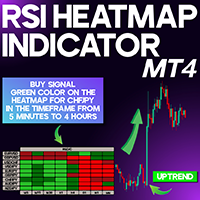
RSI Heatmap Indicator for MetaTrader4 The RSI Heatmap Indicator is a powerful technical tool in MetaTrader 4 that allows traders to assess the relative strength conditions of different currency pairs via a color-coded heatmap. By merging the Relative Strength Index (RSI) with a visual heatmap approach, this indicator simplifies market analysis by displaying strength and directional bias of multiple instruments at a glance. This indicator produces a heatmap based on calculated RSI levels across v
FREE
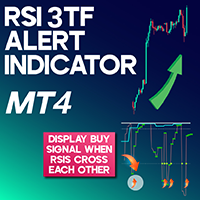
RSI 3TF Alert Indicator for MetaTrader 4 The RSI 3TF Alert Indicator for MetaTrader 4 (MT4) is designed around the RSI indicator utilizing a 2-period configuration. The RSI 3TFA integrates 3 distinct RSI indicators into a single chart view, making market analysis more streamlined for traders. When all 3 RSI indicators move above the 50 threshold, the RSI 3TFA generates a buy signal, and conversely, when they cross below the 50 level, it issues a sell signal. The yellow dots (blue in default conf
FREE
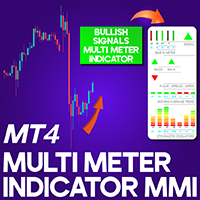
Multi Meter Indicator (MMI) for MetaTrader 4
The Multi Meter Indicator (MMI) on the MetaTrader 4 (MT4) platform is an advanced visual tool that integrates nine technical indicators into one compact panel, including a 14-period Moving Average displayed in the upper right corner. With MMI, traders can evaluate market momentum and buyer-seller dynamics with a consolidated data view on their charts. «Indicator Installation & User Guide»
MT4 Indicator Installation | Multi Meter Indicator MMI MT5
FREE
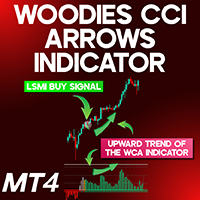
Woodies CCI Arrows Indicator for MetaTrader 4
The Woodies CCI Arrows Indicator for MetaTrader 4 (WCA) is a momentum-based tool that relies on a 14-period Commodity Channel Index (CCI) within the MT4 platform. This custom indicator blends multiple components, including the standard CCI and the Least Squares Moving Average (LSMA). When the CCI maintains an upward slope for six consecutive candles, the indicator highlights this in green. Conversely, a sustained downtrend for six bars is marked in
FREE

Indicator defines the buy and sell arrows with high performance and consistent results . Automatic analysis of market opportunities ; Identifies a direction of a trend; Suitable for trend trading or following the trend;
This is FREE demo version of the indicator and works only on "EURUSD M5".
Forex Trend Commander full version: All details about the indicator here : Works in all symbols + free Multi Currency Scanner + free SPECIAL BONUS .
FREE
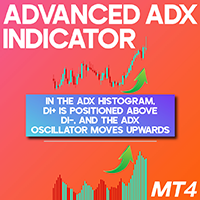
Advanced ADX Indicator for MetaTrader 4 The Advanced ADX Indicator for MetaTrader 4 (MT4) is designed to gauge the intensity of prevailing price movements in the market. This tool visualizes the strength of the trend using a histogram that spans from 0 to 100, using green bars to indicate bullish strength and red bars for bearish momentum. A taller histogram bar reflects a more dominant trend. The oscillator typically uses a 13-period setting as its default configuration. «Indicator Installation
FREE
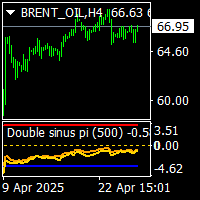
on back test use date.and not set too much back date. double sinus waves pi indicator is no repaint moving average and levels indicator. it works all timeframes and all pairs. it is combined with sinus wave and smoothed sinus wave indicator. and indexed to pi number over bought and oversell levels. it is easy to to use and suitable for experienced traders and beginners. cnt value has been set to 1000 bars.it can be increased acording to charts bar numbers. minimum cnt value mast be higher than
Volume Thermal Vision - Advanced Volume Analysis for MetaTrader 4 Unlock the power of volume analysis with Volume Thermal Vision, a sophisticated indicator designed to enhance your trading decisions. Developed by Jean Roso, this tool provides a dynamic visualization of volume intensity through a customizable heatmap, empowering traders to identify market trends and potential reversals with precision. Key Features: Multi-Protocol Visualization: Choose from five distinct protocols—Tactical, Steal
Trend detection is one of the basic challenges of every trader. Finding a way to tell when to enter a trade is very important, timing is a game changer, not too early and not too late. Sometimes, due to not knowing the market conditions, the trader closes his positions with a small profit or allows the losses to grow, these are the mistakes that novice traders make. Indicator Trend Whipper is a complete trading strategy and can improve the trader's trading process. The trend detection algorithm

Divergence Divergence refers to when the price of a currency pair moves in one direction while the trend indicator is moving in the opposite direction. With divergence, there can be positive and negative signals. Divergences in Forex trading are quite common signals of technical analysis. These are basic early Forex signals indicating the trend reversal and filter false signals. Application of this indicator It is usually not easy to detect divergences by the trader and it may be time-consuming
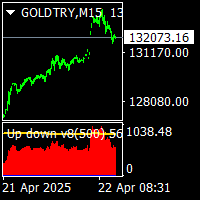
Up down v8 indicator is no repaint counter trend indicator . it try to find market up down points. it works all timeframes and all pairs. suitable for beginner and experienced trader. there is wave and c values to set defaults. minimum processed value cnt can be equal to wave value. traders can change them suitable up down points on different time frames. indicator use moving averages histograms and volatilty trigger. when red histogram is over volatility level that is tops. . when blue histogr
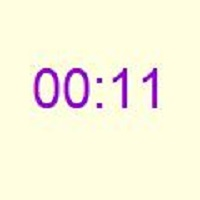
Indicator "Time to Bar End" (TimeToBarEnd)
This technical indicator is designed to accurately track the time remaining until the current candle closes on the chart. It displays a countdown in minutes:seconds format, which is particularly useful for intraday traders and scalpers who need to know the exact closing time of the current candle. The indicator updates in real-time and offers flexible customization of its appearance. The settings include: choice of position from four chart corners, adj
FREE

Индикатор нейтральной свечи — это инструмент технического анализа, который автоматически определяет зоны нейтральных свечей (neutral candlestick), появляющихся на ценовом графике. Эти зоны, как правило, указывают на неопределённость среди участников рынка и помогают заранее определить возможное направление дальнейшего движения цены. Основные функции: Определяет зоны, где появляются нейтральные свечи. Показывает вероятность движения цены вверх или вниз от этих зон. Помогает трейдеру более точн
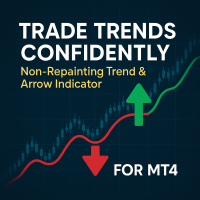
Trade Trends Confidently with the Non-Repainting Trend & Arrow Indicator for MT4! Stop missing profitable moves! This powerful indicator helps you: Clearly See the Trend: Easy-to-follow Green/Red lines instantly show you the current market direction (Uptrend/Downtrend). Get Reliable Entry Signals: Accurate Buy/Sell arrows appear precisely when the trend potentially changes. Crucially, these signals are NON-REPAINTING – they appear on bar close and never change afterwards, giving you dependable s
WeisWaveScouter is a powerful and accurate indicator designed to help traders detect key market movements based on price and volume waves. Built for the MetaTrader 4 platform, WeisWaveScouter provides detailed analysis of bullish and bearish waves, as well as highlighting volume spikes, giving you a clear view of market conditions.
Key Features: Bullish and Bearish Waves: Easily identify bullish and bearish movements with waves clearly differentiated by customizable colors.
Volume Spikes: Det

Candle Pattern Finder
Candle Pattern Finder is a powerful MT4 indicator designed to help traders easily detect key candlestick patterns in real-time. Whether you're trading trends, reversals, or consolidations, this tool highlights important price action signals directly on the chart — helping you make faster and more confident trading decisions. Detects popular candlestick patterns: Bullish/Bearish Engulfing Hammer & Inverted Hammer Shooting Star & Hanging Man Three White Soldiers Three Black
FREE

Convenient Dashboard for Moving Average Crossover Trading Strategy . On the panel, numbers display how many candles ago a signal occurred. The number 0 means the signal is on the current candle (it may disappear if the crossover does not hold). The number 1 means the signal was on the previous candle (arrows remain, as moving averages have confirmed the crossover). Moving averages can optionally be added, but the indicator works without them. Advantages of the indicator : Automa

Price Change Indicator Introduction The Price Change Indicator is a powerful tool designed to help traders identify significant price movements over a specified period. By calculating and visualizing percentage changes between current and historical prices, it allows traders to quickly spot potential trading opportunities when markets show unusual volatility or momentum. Features Real-time monitoring of price changes Visual histogram display when changes exceed threshold Text display showing cur
FREE
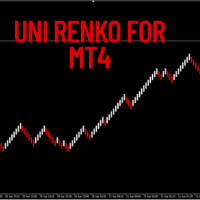
This versatile tool lets you create various Renko-style charts, including Median Renko, Mean Renko, and Traditional Renko with wicks . It offers a wide range of chart options to suit the needs of day traders, scalpers, and long-term investors.
Indicator Settings Starting Price. Box Size (in pips). Shift Percent. Timeframe Name. Show Wicks (On or Off). Amount of Bars.

Welcome to the free Combiner Professional Bull Vs Bear Binary Options and Forex Indicator project, with the most powerful free AI on the market for MT4, with 16 strategies, 27 filters, support for 10 external indicators and 16 external Bots, designed to operate in the Forex market and Binary Options.
Combiner Indicator Combiner EA Forex
Download https://t.me/bullvsbearcombiner
FREE
Scalping Strategy BUY SELL
Having a strategy in the market is one of the main conditions for trading. The presence of various and complicated indicators and tools sometimes makes trading difficult, and the user gets confused after trying various methods and gets stuck in a loss cycle, the result of which is usually clear. This indicator is a simple strategy based on the detection of pivots and short-term trends, which helps you to easily trade in trends. Sometimes a simple but efficient st

MACD Indicator The Moving Average Convergence and Divergence (MACD) is a trend following momentum indicator which shows the relationship between two moving averages that we chose and configure them on the indicator. The MACD is calculated by subtracting the 26-period exponential moving average and the 12 period D.A.M. These are the default parameters when you put the MACD indicator on the charts, and the period is usually 9 which means the last 9 candles. DT-Oscillator This is Robert C. Miner's
Order Block Multi Timeframe The Order Block Multi Timeframe is a powerful tool for Smart Money Concept (SMC) traders, combining high-accuracy Order Block detection with real-time Break of Structure (BOS) and Change of Character (CHoCH) analysis across multiple timeframes. Smart Money Insight, Multi-Timeframe Precision This indicator automatically identifies institutional Order Blocks —key price zones where large players have entered the market—and plots them directly on your ch

CHoCH & EQH/EQL: Market Structure and Liquidity Zones Indicator Overview: This versatile indicator is designed to help traders identify potential shifts in market structure and pinpoint key liquidity zones directly on their MetaTrader 5 charts. It automatically detects and visualizes two crucial price action concepts: Change of Character (CHoCH) for potential reversals, and Equal Highs/Lows (EQH/EQL) for significant support/resistance levels. Key Features: Change of Character (CHoCH) Detection:
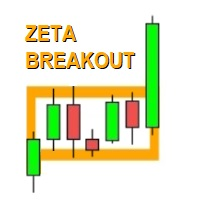
The Zeta Breakout Indicator MT4 is a powerful trading breakout strategy custom indicator. It can help traders determine the level of breakout (support and resistance levels) simple, easily and accurately. Zeta Breakout Indicator MT4 is a custom indicator that created by MQL4 programming language that based on the results of our breakout trading strategy research. It uses a proven strategy with excellent result, good win rate, good risk to reward ratio and few false break out. You can proof how

The indicator defines the buy and sell arrows with high performance and consistent results. Automatic analysis of market opportunities ; Help traders earn more from their investments;
Never repaints, recalculates or backpaints signals; This is FREE demo version of the indicator and works only on "EUR USD M5". ProTrading Arrow - All details about the indicator here : Works in all symbols and TF + free EA and Multi Currency Scanner + SPECIAL BONUS .
FREE

The Neural Adaptive MACD is a customized MACD indicator for MT4 that visually represents momentum strength using four color-coded histogram bars: strong bullish, bullish, strong bearish, and bearish.
It features neural adaptive signal smoothing and integrates optional real-time alerts, notifying traders of new momentum shifts along with the symbol and timeframe.
This tool enhances decision-making by highlighting trend strength and change dynamics.
Can be used any forex, crypto....
Any timefr

Simple. Informative. Instantly Visible on Your Chart. Alwinson Active Trades Info (MT4 Version) is a lightweight custom indicator that displays a real-time summary of your currently open trades —right on your chart. No more switching tabs just to see what pairs are active and how much lot size is in play.
Alwinson Active Trades Info is also available for the MetaTrader 5 (MT5) version .
Key Features: Displays a list of all symbols with open positions in your trading account. Shows th

GoldStrike Momentum Trend Indicator - The Ultimate Forex Trading Tool Description: Introducing the GoldStrike Momentum Trend Indicator , a powerful and intuitive tool designed for traders seeking precision in their Forex strategies. Using a combination of momentum analysis and the RSI (Relative Strength Index) , this indicator provides buy and sell signals that help you identify optimal entry and exit points, improving your trading decisions. Perfect For: Day traders who need quick, precise sign
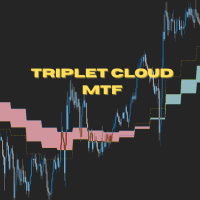
Triplet Cloud MTF is an indicator for trend-following strategy. It presents the trend in HTF from the LTF Chart that allows traders focus on looking for trade entry in the right direction and increase striking rate. It comes with simple input setup. You will only need to choose HTF you want to follow its trend and set the alert setup, then all is set. Here are the mostly selected HTF setup for each of entry timeframe: M1 Entry : M15 Trend M5 Entry : H1 Trend M15 Entry : H4 Trend H1 Entry : D1 Tr

This is a M5 EURUSD only scalper please note this (It works with all FOREX pairs but i have a lot of experience in trading this strategy with EURUSD only so it is very well tested with EURUSD pair.) (NO XAUUSD or Crypto should be traded with this strategy) Go through the manual i have attached in the comments. Please ping me up if you need anything. Without the manual this indicator is just a structure-based indicator and some white boxes you would not understand nothing else. so please go throu
M1 - H1 signals
Due to its results, this indicator will likely become more expensive.
Welcome to our page!
M1 - H1 signals is a super indicator for MetaTrader 4, for comfortable and profitable trading.
It is a sophisticated and accurate indicator designed for active traders in the financial markets.
It is easy to use, which makes it an essential tool for traders of all experience levels.
This indicator has very good potential.
It detects reversals, so you get an almost certain result on
One of the advantages of the Arrow Tracker indicator is its vivid visual representation: Histogram Display: Situated beneath the main price chart, the indicator showcases a histogram. This allows for easy identification of market trends. Color-Coded Bars: Uptrends are demarcated with blue bars, whereas downtrends are depicted with pink bars. This differentiation assists traders in swiftly gauging the market’s directional momentum. Signalling Peaks and Bottoms: The histogram employs yellow

Fibo Bollinger Indicator – MT4 Version Indicator Overview Fibo Bollinger is an advanced technical indicator that combines the dynamic behavior of Bollinger Bands with the power of Fibonacci ratios.
It is specially designed for traders who seek more precise support and resistance zones based on volatility and historical price behavior. Main Features Draws 6 Upper Bands and 6 Lower Bands based on Fibonacci levels. Provides a more detailed view of price volatility compared to traditional B
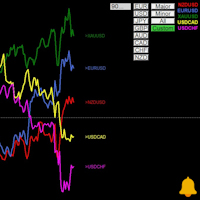
Multi Symbol RSI with alert indicator gives you overall overview of all symbols at once allowing you to compare, and contrast market for broader and simultaneous analysis of various assets at once. You can select categorized pairs from Major, Minors, All or from specific currency like all EUR pairs, USD pairs etc, You can even add your own custom list of symbols is case you want to monitor specific symbols . All of this can be done from the user friendly chart buttons.
Indicator helps in vari
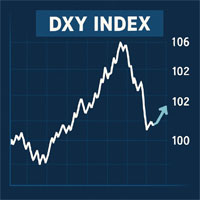
DXY Index indicator to help predict USD effect to your trade. DXY Index will help to see the power of USD.
For example if you trade XAUUSD and the DXY Index weaker, it could be the XAU will be bullish.
The same if DXY Index getting stronger, it could be that XAU will be bearish. I hope this indicator will help many trader to have better position to trade. Use this indicator wisely.

マルチタイムフレーム・キャンドル インジケーターは、トレーダーが短期の時間軸分析を高期の時間軸構造と整合させるのに役立つ強力な視覚化ツールです。選択した高期の時間軸(H1、H4、D1など)のキャンドルを現在のチャートに直接プロットすることで、チャートを切り替えることなく、市場全体の状況をより明確に把握できます。
このインジケーターが必要な人は誰ですか? このツールは次の場合に最適です。 スマート マネー コンセプト (SMC) / ICT より低い時間枠で取引を実行しながら、より高い時間枠のバイアスを利用するトレーダー。 日次またはセッションの勢いと同期を維持したいスキャルパーとデイトレーダー。 小さなチャートでエントリーを洗練させながら、HTF 構造をざっと確認したいスイング トレーダー。
価格アクション、需要と供給、またはトレンドフォローシステムのいずれを取引する場合でも、このインジケーターにより、エントリーはより長い時間枠の強さによって裏付けられます。
戦略の改善 マルチタイムフレームキャンドルは、次の点の改善に役立ちます。 方向性バイアスの確認 – 支配的なトレンドまた
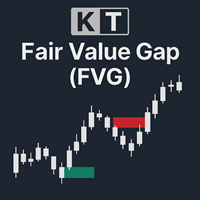
KT Fair Value Gap(FVG)は、市場における一時的な価格の不均衡ゾーンを特定し、視覚的に強調表示します。これらのギャップは、価格が継続する可能性のあるエリアとして機能するほか、時には反転ポイント(逆FVGとも呼ばれる)となる場合もあります。 強気のFVG: 緑色のボックスで表示され、上昇の勢いが再開される可能性のあるサポートゾーンとして機能します。価格がこのゾーンを埋めた後には、反転のきっかけとなることもあります。 弱気のFVG: 赤色のボックスで表示され、下降が継続される可能性のあるレジスタンスゾーンとなります。強気FVGと同様に、埋められた後に価格の反転が起こることがあります。
特徴 シンプルで見やすい設計: FVGゾーンを明確に表示するために一から設計されており、チャートの視認性を高め、トレーダーが集中しやすくなっています。 インサイトダッシュボード: 画面上のコンパクトなパネルにより、未処理(未補完)および処理済みのFVGの割合を一目で確認できます。 完全にカスタマイズ可能: FVGの閾値、処理済み/未処理のギャップの表示、色や線の太さまで自由に調整できます。
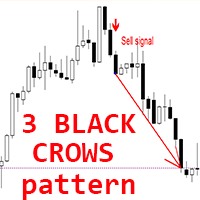
Crypto_Forex MT4用インジケーター「3 Black Crowsパターン」
- インジケーター「3 Black Crowsパターン」はプライスアクショントレードに非常に効果的です。リペイントや遅延はありません。 - インジケーターはチャート上で弱気な「3 Black Crows」パターンを検出します。チャート上に赤い矢印シグナルが表示されます(画像参照)。 - PC、モバイル、メールでアラート通知が可能です。 - 兄弟機種として、強気な「3 White Soldiersパターン」インジケーターもご用意しています(下記リンクをご覧ください)。 - インジケーター「3 Black Crowsパターン」は、サポート/レジスタンスレベルと組み合わせるのに最適です。
// 優れたトレードロボットとインジケーターは、こちらから入手できます: https://www.mql5.com/en/users/def1380/seller これはMQL5ウェブサイトでのみ提供されるオリジナル製品です。

Crypto_Forex MT4用インジケーター「HTFボリンジャーバンド」
- MT4用プロフェッショナルインジケーター「HTFボリンジャーバンド」でトレード手法をアップグレードしましょう。HTFとはHigher Time Frame(高時間枠)の略です。 - ボリンジャーバンドは市場で最も優れたインジケーターの一つであり、トレードに最適なツールです。 - プライスアクションの約90%は2つのバンド間で発生します。 - HTFボリンジャーバンドインジケーターは、プライスアクションエントリーや他のインジケーターと組み合わせたマルチタイムフレームトレードシステムに最適です。 - このインジケーターを使用すると、高時間枠のボリンジャーバンドを現在のチャートに表示できます。
// 優れたトレードロボットとインジケーターは、こちらから入手できます: https://www.mql5.com/en/users/def1380/seller これは、このMQL5ウェブサイトでのみ提供されるオリジナル製品です。
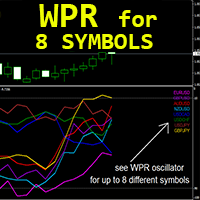
MT4用FXインジケーター「 WPR for 8 Symbols 」(リペイント機能なし)
- WPR自体はスキャルピングに最適なオシレーターの一つです。 - 強い買われ過ぎゾーン(-10以上)から売りエントリー、強い売られ過ぎゾーン(-90以下)から買いエントリーを取るのに最適です。 - 「WPR for 8 Symbols」は、1つのチャート上で最大8つの異なるシンボルのWPR値を制御できます。 - このインジケーターは、売られ過ぎ/買われ過ぎゾーンからのプライスアクションエントリーと組み合わせるのにも最適です。
// 優れたトレーディングロボットとインジケーターは、こちらから入手できます: https://www.mql5.com/en/users/def1380/seller これは、このMQL5ウェブサイトでのみ提供されるオリジナル製品です。
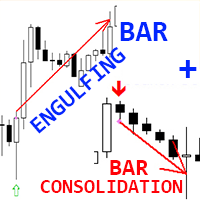
Crypto_Forexインジケーター「エングルフィングバーとコンソリデーションバー」MT4用パターン
- 「エングルフィングバーとコンソリデーションバー」パターンは、プライスアクション取引に非常に効果的です。 - インジケーターはチャート上でエングルフィングバーとコンソリデーションバーを検出します。 - 強気エングルフィングバーパターン - チャート上に緑色の矢印シグナルを表示します。 - 弱気エングルフィングバーパターン - チャート上にオレンジ色の矢印シグナルを表示します。 - 強気コンソリデーションバーパターン - チャート上に青色の矢印シグナルを表示します。 - 弱気コンソリデーションバーパターン - チャート上に赤色の矢印シグナルを表示します。 - リペイントや遅延はなく、コンソリデーションバー自体のR/R比率(リワード/リスク)は高いです。 - PC、モバイル、メールアラート機能付き。 - 「エングルフィングバーとコンソリデーションバー」パターンは、サポート/レジスタンスレベルと組み合わせるのに最適です。
// 優れたトレーディングロボットとインジケーターは、こちら

FullScalping は リペイントなし・バックペイントなし のインジケーターで、あらゆるマーケットで 常にスキャルピングエントリー を提供するように設計されています。アクティブに取引したい攻めのトレーダーに最適です! 最新情報とアップデートはインジケーター・チャンネルをチェックしてください。: https://www.mql5.com/en/channels/forexnewadvisor
このインジケーターは ほぼすべてのローソク足 でシグナルを出し、トレンドを確認したり、重要な押し戻りを示したりします。まるで常に助言してくれるレーダーのような存在です。 使い方は?とてもシンプルです: 赤い矢印 売りエントリー 青い矢印 買いエントリー
全体のトレンドに沿って取引し、1回のトレードで 15〜20pips を積極的に狙い、市場が反転する前に素早く利確します。 シグナルは 常に出続ける ので、エントリーチャンスを逃すことがありません。目的は以下の条件を活かした 高効率スキャルピング です: 大きめのロット数 低スプレ
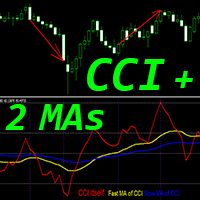
Crypto_Forex MT4用インジケーター「CCIと2つの移動平均線」、リペイントなし。
- Commodity_Channel_Index (CCI) は、トレンド方向へのモメンタムトレードに最適です。 - 「CCIと2つの移動平均線」インジケーターを使用すると、CCIインジケーターの高速移動平均線と低速移動平均線を確認できます。 - 上昇トレンド - 高速移動平均線が低速移動平均線より上。下降トレンド - 高速移動平均線が低速移動平均線より下。 - CCIは、取引で最も人気のあるオシレーターの1つで、現在の価格と過去の平均価格の差を測定します。 - オプション1 - 50から-50の値の中心領域からトレンド方向に取引を開始し、インジケーターがそれぞれ200/-200の領域に到達したら決済します。 - 重要なレベル:+/-200、オプション2 - +200以上のゾーンで売りエントリー、-200以下のゾーンで買いエントリーをトレンド方向に行います。 - インジケーターは、トレンドの変化を早期に把握する機会を提供します。
// 優れたトレーディングロボットとインジケーターは、
123456789101112131415161718192021222324252627282930313233343536373839404142434445464748495051525354555657585960616263646566676869707172737475767778798081828384858687888990919293949596979899100101102103104105106107108109110111112113114115116117118119120121122123124125126127128129130131132133134135136137138139140141142143144145146147148149
MetaTraderマーケットは自動売買ロボットとテクニカル指標を販売するための最もいい場所です。
魅力的なデザインと説明を備えたMetaTraderプラットフォーム用アプリを開発するだけでいいのです。マーケットでプロダクトをパブリッシュして何百万ものMetaTraderユーザーに提供する方法をご覧ください。
取引の機会を逃しています。
- 無料取引アプリ
- 8千を超えるシグナルをコピー
- 金融ニュースで金融マーケットを探索
新規登録
ログイン