YouTubeにあるマーケットチュートリアルビデオをご覧ください
ロボットや指標を購入する
仮想ホスティングで
EAを実行
EAを実行
ロボットや指標を購入前にテストする
マーケットで収入を得る
販売のためにプロダクトをプレゼンテーションする方法
MetaTrader 4のための新しいテクニカル指標 - 21

Discover Prozones IntraWeek MT4: Elevate Your Trading Success with Precision Are you tired of sifting through market noise in search of profitable trades? Look no further than Prozones IntraWeek MT4 – your ultimate solution for consistent trading success in the fast-paced world of intraday trading. Crafted with advanced algorithms and years of market expertise, this indicator empowers traders of all levels to make informed decisions with confidence. Key Features: Pinpoint Precision in Trend Anal
Introducing the ON Trade Melad Pattern Indicator: Enhance Your Trading Strategy with Breakout Patterns
Discover the power of the ON Trade Melad Pattern Indicator—an intuitive tool designed to elevate your trading decisions by detecting and highlighting breakout patterns on your charts. This indicator is your key to identifying crucial breakout points and potential trend shifts with simplicity and precision.
Key Features:
Breakout Pattern Detection: The ON Trade Melad Pattern Indicator foc

This indicator will give you entries as result of scalping strategy that will be applied on 14 symbols in same time and you are able to be notified with this entries
Note : This indicator for scalping on 5 minutes timeframe only .
How to use it :
1-Open chart and adjust settings (edit symbols names as your platform names , activate the alert system if you need it . 2-Wait for any signal you have it from this scanner you will have it as alert and as notification and you will see it on bo

This indicator gives you the signal of real cross on stochastic indicator. This indicator is easy to attach to an ea. This indicator will work best on All time frames. Arrow appears depending on many algorithms that study the cross parameters.
Indicator properties Use_System_Visuals: enable/disable visual styles. Stochastic_K_Period. Stochastic_D_Period. Stochastic_Slowing. Use_Notifications: enable/disable Push Notifications. Use_Alert: enable/disable Alerts. Use_E_Mail: enable/disable Email

Attraverso l'indicatore Savius Zone potrai finalmente: Definire delle zone oggettive da attenzionare Ridurre la discrezionalità Filtrare i tuoi pattern operativi Avvalerti di un metodo comprovato Qui di seguito alcune funzioni dell'indicatore Savius Zone: Zone Buy & Sell L’indicatore fornisce delle zone buy e sell ogni giorno dopo l’apertura del mercato cash sui seguenti mercati: DAX, S&P500, Nasdaq, Russel2000, Dow Jones
Occasioni giornaliere Savius Zone fornisce occasioni di trading tutti i
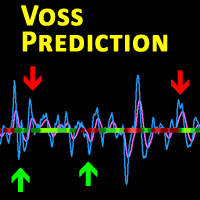
Description This is a modified version of the popular Voss Predictive Filter - A peek into the future by Dr. John Ehlers. It contains 2 lines - V-Line (blue) and F-Line (red), a trend indication and BUY/SELL signals.
Usage Buy Green dots indicate an up trend. Open a BUY position if the V-Line crosses the F-Line from below and an up trend is signaled (green dots) Close BUY position if V-Lines falls beneath F-Line again Sell Red dots indicate a down trend Open a sell position if V-Line fall

The " Candle Countdown Indicator " is a MetaTrader 4 tool that displays real-time countdowns to the next candle open. This precise timing information enhances trading decisions, making it indispensable for traders across various styles and timeframes. Customizable fonts and colors ensure seamless integration with your charts. Elevate your trading strategy with this intuitive and invaluable indicator.
FREE
DYJ峰谷指標は先進的な二乗加重平均線取引システムである。 未来のトレンド線とトレンド角度、および各ピーク谷の角度表示が含まれています。
SQWMAのピークが終わった時、減少傾向があり、
SQWMAの谷底では、上昇傾向がある。 インジケータ信号は取引量の開倉統計をシミュレートできるので、信号確率についてより詳しく知ることができます
Please download the XAUUSD parameter template file ( Link ) in the comments section.
Input
InpMAPeriod = 25 InpMAShift = 0 InpMAMethod= MODE_SMA InpAppledPrice = PRICE_CLOSE InpWaveWidthMaxBars = 10 -- The width of wave(Units are measured in Bars)
InpWaveAmplitudeSize = 2 -- Wave Amplitude Size . It's
トレード矢印付きの Macd 2 ライン インジケーター。
含まれるもの:
MACDシグナルとMACDライン 2色のヒストグラム 0レベル 可能性のあるトレードの矢 読み方 :
クロスが発生するとインジケーターに矢印が表示され、ファストラインがゼロラインの上または下に移動します。 適切なリスク管理を行い、ボラティリティの高いニュースに基づいて取引しないでください。
他の製品をチェックしてください: https://www.mql5.com/en/users/gabedk/seller Torēdo yajirushi-tsuki no Macd 2 rain injikētā. Fukuma reru mono: MACD shigunaru to MACD rain 2-shoku no hisutoguramu 0 reberu kanōsei no aru torēdo no ya yomikata: Kurosu ga hassei suru to injikētā ni yajirushi ga hyōji sa re, fasutorain ga zero
FREE

ON Trade マルボーゾキャンドルパターンインジケーター マルボーゾキャンドルパターンは、市場のセンチメントや潜在的なトレンドの反転に関する貴重な洞察を提供できる強力でわかりやすいローソク足パターンです。このパターンは、一方向の優勢なトレンドに沿って延びる長い実体を持ち、片方の端に非常に小さなまたは存在しない影(ヒゲ)を持つローソクで特徴付けられます。このパターンは、買い手と売り手の間に強力なバランスの乱れがあることを示し、市場の勢いが強く片寄っていることを意味しています。 特徴と利点: クリアな市場センチメント: マルボーゾキャンドルは、市場の主なセンチメントを明確に表現しています。上昇(白)のマルボーゾは、始値から終値までの間に強力な買い圧力を示し、下降(黒)のマルボーゾは強力な売り圧力を示しています。 トレンドの継続または反転: コンテキストによって、マルボーゾパターンはトレンドの継続または潜在的なトレンドの反転を示すことがあります。長期のトレンドの後に現れる場合、そのトレンドの継続を示す可能性があります。逆に、サポートまたはレジスタンスの領域近くで現れるマルボーゾキャンドル
FREE

ゴールドグラム価格計算ツールインジケーターのご紹介 地域通貨における金価格を常に把握したいですか?もっと探す必要はありません。ゴールドグラム価格計算ツールインジケーターは、お好きな地域通貨でグラム当たりの金価格をリアルタイムで計算できる画期的なツールを提供します。このインジケーターを使用することで、金融洞察力を活用して情報に基づいた意思決定ができます。 主な特徴: 地域化された金価格: ゴールドグラム価格計算ツールインジケーターは、特定の地域通貨での金属のグラム単位の価格、具体的には金のグラム単位の価格を提供します。これにより、身近な通貨で金の価値を便利に追跡できます。 ユーザーフレンドリーな設定: 当インジケーターは利便性を考慮して設計されています。インジケーターの設定から直接調整するか、メインチャート上で調整することができ、シームレスで個別の体験が可能です。 パラメータの説明: Use_System_Theme (システムテーマを使用): 好みのカラースキームを選択するオプションで、インジケーターの視覚的な外観を取引環境に簡単に統合できます。 Ounce_Value (オンス価値)
FREE

このエキスパートアドバイザーは取引を行いませんが、マーケットウォッチ内のシンボル全体をスキャンし、異なる時間枠で各株を 1 つずつスキャンし、最後に、どの時間枠のどのシンボルが強力な巻き込みローソク足を持っているかを示します。
さらに、MA 期間と RSI の上限と下限を定義でき、どのタイムフレームのどのシンボルが調整済み移動平均を超えるか、また、どのタイムフレームのどのシンボルが調整移動平均の上限または下限を超えるかが表示されます。 RSI。
Kono ekisupātoadobaizā wa torihiki o okonaimasenga, mākettou~otchi-nai no shinboru zentai o sukyan shi, kotonaru jikan-waku de kaku kabu o 1-tsu zutsu sukyan shi, saigo ni, dono toki-waku no dono shinboru ga kyōryokuna makikomi rōsoku ashi o motte iru ka o shimeshimasu.
FREE
DYJ SuperMATrend is a highly accurate MA trading system.
This indicator marks Bull line segment color (green) and Bear line segment color (red) on the average line. The entrance time and price are the candle time and price at the junction of the green and red lines. The next entrance is the exit point of the previous order.
Input
inpPeriod = 50 inpAtrPeriod = 5 InpLineWidth = 3 clr_buy = clrSpringGreen clr_sell = clrRed InpMup = 40

A technical indicator that calculates its readings on trading volumes. In the form of a histogram, it shows the accumulation of the strength of the movement of the trading instrument. It has independent calculation systems for bullish and bearish directions. Works on any trading instruments and time frames. Can complement any trading system.
The indicator does not redraw its values, the signals appear on the current candle.
It is easy to use and does not load the chart, does not require additi
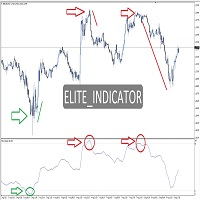
ELT Reversal MT4 (Elite_Indicator) is an indicator for the MetaTrader 4 terminal. . This indicator is based on the Counter-Trend strategy, but also uses Volatility. It is based on showing possible liquidity in the financial market, thus helping traders in their trading. ELT Reversal MT4 (Elite_Indicator) is a visual tool, intuitive, and easy to understand and use.
Recommended time frame for Scalping Trade : M1 M5 M15 Recommended time frame for Swing Trade : M30 upward Better precision:
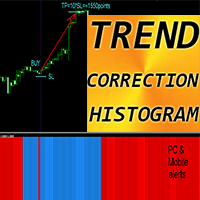
MT4用FXインジケーター「トレンド修正ヒストグラム」
トレンド修正ヒストグラムは 2 色で表示できます。弱気トレンドは赤、強気トレンドは青です。 同じ色のヒストグラム列が 7 つ連続する場合は、新しいトレンドの始まりを意味します 損失を最小限に抑え、利益を最大化することを主な目的として設計されたトレンド修正ヒストグラムインジケーター パラメータ「期間」があり、インジケーターの感度を担当します 内蔵のモバイルおよび PC アラート トレンド修正ヒストグラムは、シンプルだが収益性の高い取引システムとして使用できます。以下を参照してください。 インジケーターの使用方法: 1) 少なくとも 7 つの連続する同じ色のヒストグラム列を確認します。これは、新しいトレンドの始まりを意味します。 たとえば、下の図には青い列が 7 つ以上あります。 2) 反対色の列 (この場合は赤) が 1 つだけ待機し、その直後に再び青に変更されます。 トレンド調整だったということですね。 3) 赤い列の 1 つ前の後に、青い列が発生したときにロング取引を開始します。 調整後にメイントレンドの方向に注文がオープ

STOCHASTIC FLAT Detector - トレーディングにおける効率的な補助ツールです。 この優れたMT4インジケーターで取引方法をアップグレードすることをお勧めします。
インジケーターは、チャート上の価格平坦領域を示します。 「フラット」パラメータがあり、フラットな検出感度を担当します。 STOCHASTIC FLAT 検出器は、価格アクションのエントリー確認、ダイバージェンスまたは売られ過ぎ/買われ過ぎシグナルに使用できます。 これをトレンドフォローシステムに使用して、フラットを検出し、そこでの取引を回避できます。 リバーサルスキャルピングに使用できます - フラットボーダーからのリバーサル取引 標準の Stochastic の代わりに STOCHASTIC FLAT Detector を使用する機会がたくさんあります。
// さらに優れたエキスパートアドバイザーとインジケーターはここから入手できます: https://www.mql5.com/en/users/def1380/seller // また、収益性が高く、安定していて信頼できるシグナル https

Channel Vertex is a price action pattern formed by price Chanel and a triangle pattern . Price channels basically indicates possible support and resistance zones around a price movement and retracement or breakout at these levels can indicate possible trend continuation or reversal .
Majority of the times price fluctuations forms triangle patterns defined by 3 vertexes , these triangle patterns most times defines a trend continuation. A triangle pattern is a trend continuation pattern tha

Drop Trend is a trend indicator for the MetaTrader 4 trading platform. This indicator allows you to find the most probable trend reversal points. You will not find this indicator anywhere else. A simple but effective system for determining the forex trend. From the screenshots you can see for yourself the accuracy of this tool. Works on all currency pairs, stocks, raw materials, cryptocurrencies.
Are you tired of the constant ups and downs? Do not become a victim of unstable market movements,

The Scaled Awesome Oscillator (SAO) represents a refined adaptation of the Awesome Oscillator, aimed at establishing consistent benchmarks for identifying market edges. Unlike the standard Awesome Oscillator, which records the variation in pips across different commodities, the only unchanging reference point is the zero line. This limitation hampers investors and traders from pinpointing specific levels for trend reversals or continuations using the traditional Awesome Indicator, a creation of
FREE
This indicator is a moving average built using the triple exponential smoothing method (T3). The indicator is part of a series of indicators - T3 Line AM, T3 Momentum AM, T3 Candles AM, T3 Signal AM .
The indicator has minimal lag and allows you to effectively follow the trend direction. The indicator is not redrawn on fully formed bars. The indicator is supplemented with signals and notifications to the terminal and e-mail.
The application of the indicator is identical to the application o
FREE
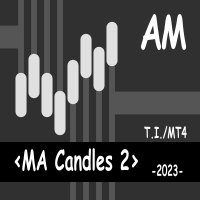
This indicator displays candle prices on the chart based on moving average data. That is, the opening price is the opening price of the moving average, the closing price is the closing price of the moving average, and so on. This approach allows you to visualize the average price changes, eliminate the "noise" and get a picture more suitable for evaluation and decision making. The indicator does not redraw on fully formed bars. At the same time, the indicator can change its data on the zero bar
FREE
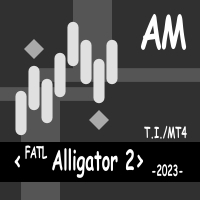
This indicator is a combination of classic trend indicator and signals of the fast digital filter. The indicator has no configurable parameters. The signals are displayed on completed bars and are not redrawn. It shows high efficiency on periods greater than 1 hour. The usage principle is intuitive - trade in the direction shown by the fan of moving averages. Enter once the price exceeds the High/Low of the bar where the signal was formed. Exit on the opposite conditions.
FREE
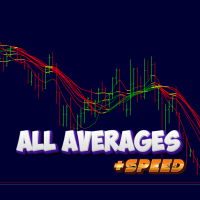
Perhaps you have previously read in technical analysis books about such a concept as "market slope", or "trend slope". Metatrader has such a tool as "trend line by angle". But when working on auto-scaled charts, this tool becomes completely abstract, and as a consequence, useless. The idea of this new parameter, included in the AllAverages_Speed indicator, is to give such a concept as "trend slope" specific numerical values, as well as the further use of the new parameter in work.
Modific

If you are a Price Action Trader this indicator will help you so much Every trader must have it ! I'm a trader so i know what you need ! Message me if you wanna see the video you should send me message
don't worry i will help you to learn how to use my indicators
i also have other indicators, please watch them stay tuned i also have other useful indicators and Experts Telegram ID: @forex_ex4
#forex #priceaction #indicator #mt4 #mt5 #trade #trader
The indicator shows the current timeframe and symbol name. It is also possible to turn on the indication of time until the end of the current bar. In the settings, you can specify: - the location of the indicator in relation to the terminal window, top left, top right, bottom left and bottom right - a row of text display arrangements so that the inscriptions do not overlap each other - color - font - font size.
FREE

This is diamond! Diamond Pattern is based on Read The Market(RTM) concepts. The purpose of this model is to face the big players of the market (financial institutions and banks), As you know in financial markets, big traders try to fool small traders, but RTM prevent traders from getting trapped. This style is formed in terms of price candles and presented according to market supply and demand areas and no price oscillator is used in it. RTM concepts are very suitable for all kinds of investment

The three white soldiers and the three black crows candlestick patterns are reversal patterns that predict a change in the direction of a trend. The pattern consists of three consecutive long-bodied candlesticks that open within the previous candle's real body and a close that exceeds the previous candle's. It's important to note that both formations are only valid when they appear after a strong uptrend or a downtrend, while their efficiency decreases in choppy markets.
Inputs AlertOn - e
FREE
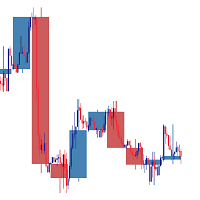
This is a Free Trial work on EURUSD. Discover the incredible potential of "Higher Timeframe Bars," your go-to MetaTrader 4 indicator for enriched trading insights. Revolutionize your trading strategy with a deeper understanding of the markets, all while staying on your current chart.
Key Features: - Seamlessly compatible with MetaTrader 4. - Choose from an array of higher timeframes, including M3, M5, M10, H1, H4, D1, and more. - Customize bar colors and enable optional borders for enhanced v
FREE
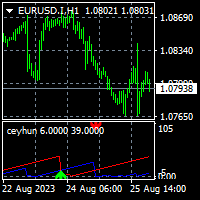
To get access to MT5 version please click here . This is the exact conversion from TradingView: "Top Bottom Indicator" by "ceyhun". This is a light-load processing and non-repaint indicator. All input options are available. This is not a multi time frame indicator. Buffers are available for processing in EAs. Extra option to show buy and sell signal alerts. You can message in private chat for further changes you need.

I was looking for a lean symbol changer. I could not find any. Normally other products hide lot's of screen space. So I developed a very lean symbol changer Just click on the 2 currencies you want to combine. The order does not matter. If you miss some pairs, you can add up to 5 custom symbols. Please make sure, your broker support your custom symbols. Drag an drop the panel with the green button.
In future I plan to include suffix and prefix als well.
FREE
We offer indicators that will meet your needs more. >> MT Sideway Filter <<
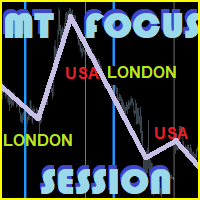
MT Focus Session : It is an indicator used to look at the session time of interest by focusing only on the market opening to closing time only. It is recommended to set Open session LONDON and End session USA, because it was a time graphs tend to have very high volume.
TRADE: Forex
TIME FRAME: M5 M15 M30 H1
SYMBOL PAIR: All Symbol
SETTINGS: FOCUS SESSION Open Session Time: Start time of t
FREE

The liquidity swings indicator highlights swing areas with existent trading activity. The number of times price revisited a swing area is highlighted by a zone delimiting the swing areas. Additionally, the accumulated volume within swing areas is highlighted by labels on the chart. An option to filter out swing areas with volume/counts not reaching a user-set threshold is also included.
This indicator by its very nature is not real-time and is meant for descriptive analysis alongside other c

This indicator is based on the classical indicator Stochastic and will be helpful for those who love and know how to use not a visual but digital representation of the indicator. All TimeFrames RSI MT4 indicator shows values from each timeframe. You will be able to change the main input parameters for each RSI for every TF. Example for M1: sTF1_____ = "M1"; kPeriod1 = 5; dPeriod1 = 3; Slowing1 = 3; stMethod1 = MODE_SMA; Price_Field1 = MODE_MAIN; stMode1 = 0;
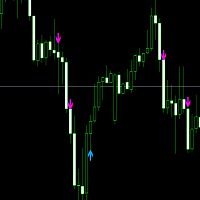
This offer is limited to a temporary period. Entry signal :follow the blue arrow for a buy trade and the Pink for a sell. Buy Trade: When the blue arrow appears, you wait until the candle completely finishes. Then you enter into a Buy Trade as soon as the next candle appears. Now wait until you hit TP1 from the Buy Goals box, then close the trade with a profit. Sell Trade: When the Pink arrow appears, you wait until the candle completely finishes Then you enter into a Buy Trade as soon as the
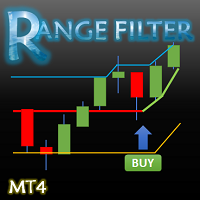
This indicator converted from 5 min Buy and Sell Range Filter - guikroth version on TradingView Popularity of the Range Filter
The Range Filter is a very popular and effective indicator in its own right, with adjustments to the few simple settings it is possible to use the Range Filter for helping filter price movement, whether helping to determine trend direction or ranges, to timing breakout or even reversal entries. Its practical versatility makes it ideal for integrating it's signals into

Introducing the "Magic Trades" for MetaTrader 4 – your ultimate tool for precision trading in dynamic markets. This innovative indicator revolutionizes the way you perceive market trends by harnessing the power of advanced analysis to detect subtle changes in character, paving the way for optimal trading opportunities.
The Magic Trades Indicator is designed to empower traders with insightful entry points and well-defined risk management levels. Through its sophisticated algorithm, this indica

Alright. This indicator works on MT4 and is very easy to use. When you receive a signal from it, you wait for that candle with the signal to close and you enter your trade at the beginning of the next new candle. A red arrow means sell and a green arrow means buy. All arrows comes with Popup Alert like for easy identification of trade signal. Are you okay with that?
100% non repaint
Work All Major currency Pair,
1 minute time frame 1 minute expire

Introducing the uGenesys Psychological Levels Indicator – Your Key to Precision Trading with Real-Time Alerts! Are you tired of guessing where the market might turn? Do you want a tool that can accurately identify psychological levels and notify you when price touches a key level? Look no further – the uGenesys Psychological Levels Indicator is here to revolutionize your trading experience. Imagine having a tool that not only identifies psychological levels with unmatched accuracy but also aler

The " Global Trend Pro Lines " indicator is one of the most important indicators designed to display trading volumes based on the sniper strategy. This indicator provides convenience for daily, medium-term, and long-term traders. The main advantages of the indicator are as follows: Suitable for the sniper strategy: The "Global Trend Pro Lines" indicator is suitable for the sniper strategy and allows traders to identify the best entry and exit points for trading. Displays volumes: The indicator

**MT4用ブレイクアウトボックスインジケーター - 効率的なトレーディングチャンスを発見**
こんにちは、尊敬するトレーダーの皆様、
私たちは、KPROによって作成された強力で正確なトレーディングツール、ブレイクアウトボックスインジケーターのバージョン2.0をご紹介させていただきます。これは、外国為替市場でトレーディングチャンスを捉え、利益を最適化し同時にリスクを最小限に抑えるための貴重な資産です。
**主な特徴:**
1. **効率的なブレイクアウトトレーディング:** ブレイクアウトボックスインジケーターは、チャート上の重要なブレイクアウトポイントを特定するために特別に設計されています。これにより、強力な価格変動を捉え、最良のトレーディングチャンスを活用することができます。
2. **リペイントのないシグナル:** このインジケーターの特筆すべき特徴の1つは、リペイントのないシグナルの機能です。これにより、インジケーターが提供する買いと売りのシグナルに信頼を置くことができ、トレーディングの決定に信頼性のある基盤が築かれます。
3. **マルチタイムフレー

このインジケーターは、手動および自動的な方法で描かれる調和パターンを検出します。 ご自身のレビューを追加してください。 注意事項: インジケーターにはコントロールパネルがあり、各(チャートとタイムフレーム)の設定を保存します。スペースを確保するために最小化することができ、他の分析ツールと一緒に作業する際にインジケーターデータをすべて非表示にするために閉じるボタンを押すこともできます。 このインジケーターを使用して設定を変更し、移動平均線やボリンジャーバンドなどのインジケーターを追加する場合、このインジケーターは自動的に編集したテンプレートを保存し、必要なときにロードすることができます。 Windows 10を使用している場合は、MetaTraderアイコンを右クリックして > 互換性 > 高DPI設定の変更 > システム(強化)を選択して、最適な画面設定にしてください(これはHDデバイスで行う必要があります)。 このインジケーターは、チャート上で調和トレーディング理論を解釈したもので、チャート上の調和パターンを検出します。詳しく学びたい場合は、Scott Carneyの「ハーモニックト

Advanced SR インジケーターをご紹介します。チャート上で最も重要なキーレベルを特定するのに役立つインジケーターです。
あなたの課題:
重要な価格エリアを正確に特定する方法がわかりません。 供給と需要またはサポートとレジスタンスのゾーンを99%のトレーダーと同様に描いています。 描いた供給と需要、サポートとレジスタンスのゾーンが効果がないと感じています。 エントリーポイントとエグジットポイントの安全性について確信がありません。 Advanced SR はこれらのすべての課題に対処します。取引量を活用してキーレベルと市場大手プレーヤーによる重要な取引が行われる価格領域を特定するアルゴリズムを使用するため、重要な価格エリアを迅速に特定できます。これらのキーレベルだけに頼ることで、独自のトレーディング戦略を容易に構築できます。
***インジケーターを購入して、80%の勝率のスキャルピング戦略を無料で入手してください。プライベートメッセージでご連絡ください!***
Advanced SR インジケーターは価格がキーレベルに接近するたびにアラートを提供し、その地点での取

---- Brand New Strategy. Three Month Rent is $30. ONE YEAR RENT ONLY $50. FREE EURUSD VERSION AVAILABLE UNDER << Forecast System Gift >>. NO NEED FOR BACKTEST! Link to the FREE version --> https://www.mql5.com/en/market/product/110085?source=Site --- This is a simple strategy based on BREAKOUT and FIBONACCI levels. After a breakout, either, the market: - continues the move directly to the 161, 261 and 423 levels, or - retraces to the 50% level (also called a correction) and thereafter continues

現在の価格は 10 部のみで、それ以降の価格は 90 ドルとなります
矢印付きのエンベロープとtmaに基づいたバンドスナイパーインジケーターは、動的なサポートとレジスタンスを示し、売買の矢印としてエントリーシグナルも与えるため、多目的のインジケーターです。
デフォルト設定は 1H の時間枠に基づいています。完全なガイドについては購入後にお問い合わせください。
エントリールール:
買い : 1.ローソク足は両バンドの下で終了
2.ローソク足 2 つの上矢印 (金色の矢印とオレンジ色の矢印) を使用して 2 つのバンド内で戻ります。
売り : 1.両方のバンドの上でローソク足で終了
2.ローソク足 2 つの下矢印 (金色の矢印とオレンジ色の矢印) を使用して 2 つのバンド内で閉じます。
TP 1 : ミドルバンドライン
TP 2 : 逆バンド
SL カップルが矢印の下でピップス
推奨される時間枠は : 15 分以上

このインジケーターは、エリオット波動理論と組み合わせて作動し、2つの方法で使用されます: 自動モード: このモードでは、インジケーターがチャート上の全ての5つのモーティブ波を自動的に検出し、予測とポテンシャルな逆転ゾーンを提供します。また、アラートやプッシュメッセージを生成する能力も備えています。この自動機能により、エリオット波動パターンの識別と分析のプロセスが効率化されます。 手動モード: このオプションは、エリオット波動理論を手動で扱いたいトレーダー向けです。9つの段階を使用して波を描画することができます。各段階は、表示された後に描画されたラインを調整して個別に定義できます。この機能により、手動で波を描画するプロセスがより効率的になります。重要な点として、すべての描画データが将来の参照のためにプラットフォームのデータフォルダに保存されることに注意してください。 パラメータ: Name: インジケーターの名前。 Use_System_Visuals: インジケーターのテーマを有効または無効にして、取引プラットフォーム全体の外観に合わせます。 Explain_Comment: 波の番号

Gannスクエアインジケーターは、W.D. Gannによって執筆された「市場予測のための数学的な式」の記事に基づく強力な市場分析ツールです。このツールは、解析に数学的な概念を応用し、Gann理論に基づいています。それは、144、90、52のスクエアや9のスクエアなど、Gannの関連テクニックの要素を取り入れています。さらに、の方法を組み込んでおり、9のスクエアとその関連性についてのチャネルやスターパターンに焦点を当てています。 ユーザーマニュアルと使用方法: このインジケーターを使用する前に、ユーザーマニュアルを読んで疑問点を解決するためにお問い合わせいただくことをお勧めします。ユーザーマニュアルの完全版は、当社のウェブサイトで入手できます。 MT5の完全版は購入できますし、MT4の無料版も試すことができます。両方のバージョンへのリンクを提供していますので、ご利用ください。 主な機能と機能: Gannスクエアインジケーターは、市場分析のための完全なツールセットを提供し、幾何学的な概念とGann理論に基づいて的確な判断を行う手助けをします。以下に主な機能を示します。 9のスクエアの分析:

このインジケーターは、トレードチャート上でドンチャンチャネルを視覚的に表現するためのものです。ドンチャンチャネルは、特定の期間における最高値と最低値の間の範囲を描画するためのシンプルなテクニカルツールです。このインジケーターは、価格動向の視覚的な分析を向上させ、潜在的なブレイクアウトとトレンドの継続ポイントに関する洞察を提供します。ドンチャンチャネルは、現在の時間枠とより高い時間枠の両方に適用できるため、このオプションを有効にすることができます。 インジケーターの主な特徴: Use_System_Visuals: このパラメータを有効にすると、システムの視覚スタイルとインジケーターの外観を切り替えることができます。有効にすると、インジケーターの視覚的要素はトレードプラットフォーム全体のテーマに合わせられます。 Signal_from_HT_Timeframe: このオプションを有効にすると、より高い時間枠からのシグナルを受信できます。言い換えれば、現在の時間枠でのトレーディングの決定に影響を与えるために、より長い時間枠でのドンチャンチャネルの動作を考慮できます。 HT_Timefram
FREE

もちろんです、以下はあなたの投稿の日本語への翻訳です: "このインジケーターは、シンプルなトレンド検出ツールです。 スキャルピングモードなど、良いエントリーを得るために戦略と組み合わせて使用できます。 価格の周りにチャンネルを描画し、時間の経過とともに拡張されます。カスタム期間では、アルゴリズムによって時間と価格を一緒に考慮し、拡張の始点に戻ります。 逆転の兆候が現れた後、チャネルの下限で買うことができます。 逆転の兆候を見た後、チャネルの上限から売ることができます。 パラメータ: システムのテーマを使用:ここからテーマを選択できます。 計算タイプ:次の3つのオプションから選択できます。 1- オリジナルの計算:このエリアは、その日のトレンドを定義し、このエリアよりも上または下で開く場合のトレンドを定義します。 2- 新しい計算:トレンドを検出するために依存するチャンネルを描画します。 3- Sheph:新しい計算方法と互換性のないシンボル上に描画される修正されたチャンネルです。" 何か他に質問があるか、またはもっとお手伝いが必要な場合は、お気軽にお知らせください!

"私たちの強力な外国為替インジケーターをご紹介します。これは、トレード戦略を向上させ、市場のトレンドについて正確な洞察を提供するために設計されました。この先進のツールは、蝋燭の測定を詳細に分析し、最適な精度を得るために調整を行う複雑なカスタムアルゴリズムを使用しています。その結果、戦略的なエントリーポイントを示すチャート上に巧みにプロットされた矢印のセットが得られます。 このインジケーターの素晴らしさは、蝋燭のパターンの力を活用し、それらを慎重に調整された調整と組み合わせる能力にあります。これにより、市場の動きに対する独自の視点が提供され、トレードの意思決定に優位性が生まれます。 このインジケーターの際立った特徴の1つは、H1時間枠での優れたパフォーマンスです。この時間枠に特化したトレーダーは、正確なエントリーポイントの多くを提供することがわかるでしょう。ただし、私たちは相乗効果の力を信じています。このインジケーターは単独で強力なツールですが、より広範なトレード戦略に組み込まれると、そのパフォーマンスはさらに向上します。既存のアプローチと組み合わせることで、その真のポテンシャルが発揮さ

このインジケーターは、ガン理論に基づく特定のパターンであるダイヤモンドガン波を検出して可視化するために設計されています。このインジケーターは、パターンのABCポイントに基づいてポイント(P)を描画することで、市場の反転の可能性についてトレーダーに洞察を提供します。さらに、インジケーターは予測されたポイント(P)から垂直線を引いて、トレーダーが潜在的な反転ポイントをより簡単に特定できるようサポートします。 インジケーターの特徴: Use_System_Visuals:このパラメーターを有効にすると、インジケーターの外観にシステムのビジュアルテーマを使用するかどうかを切り替えることができます。このオプションを有効にすると、インジケーターのビジュアル要素が取引プラットフォーム全体のテーマと一致します。 Show_Last_Candle_Counter:このオプションを有効にすると、現在のローソク足が終了するまでの残り時間を示すカウンターが表示されます。このタイマーは、特定のローソク足のパターンや時間間隔に依存するトレーダーにとって役立つ場合があります。 Candle_Counter_Colo

もちろん、こちらが日本語への翻訳です: "このインジケーターは、バイストラ・パターン理論に基づいてエントリーを検出し、エントリー値を提供し、ターゲットとストップのレベルでリミットオーダーを配置します。これにより、リスクの割合を計算できます。 注意事項: このインジケーターにはEAで使用できるバッファがあります。 この製品を使用する際には、良好なマネーマネジメントを実践することが重要です。 タイムフレームを変更すると、 インジケーターは前回のセッションで使用したテンプレートを保存します。 この方法を学ぶための書籍が必要な場合は、購入後にお知らせいただくか、ご購入後にご意見をお寄せください。 パラメーター: システムビジュアルを使用 - この製品の視覚的なテーマを有効/無効にします。 スピードに関連 - 最後の波の速い動きのみでパターンを検出するを有効/無効にします。 最後のキャンドルカウンターを表示 - キャンドルタイマーを有効/無効にします。 キャンドルカウンターの色 - キャンドルタイマーのテキストの色。 上昇パターンの色 - 上昇パターンの色。 下降パターンの色 - 下降パターンの

もちろん、こちらが「Fibo Star」という指標についての詳細な説明です。これはFibonacciファンを星の形でチャートに描画するためのもので、価格の動きに効果的であり、描画と設定を行う際の手間を減らすためのコントロールパネルもサポートされています。 使用方法: この指標は手動の使用になります。効果的に使用するためには、以下の手順に従ってください: チャート上でFibonacciファンを描画するための高値と安値のポイントを特定します。 これらの高値と安値に紫色のラインを置きます。 価格がこれらのラインに到達するのを待ち、それらがサポートと抵抗のラインとして機能するのを観察します。 パラメータ: Use_System_Theme: このパラメータを使用して、外観をトレーディングプラットフォーム全体のテーマに合わせるか、独自にカスタマイズするかを選択できます。 Levels_Color: Fibonacciファンのレベルに適用する色を選択します。 Levels_Style: Fibonacciファンのレベルのスタイルを定義し、外観を好みに調整します。 Levels_Width: チャー

「通貨強度インジケーター」は、外国為替市場での異なる通貨の相対的な強さに関する情報を提供するために開発された強力なツールです。各通貨の強さをそれぞれの対応する時間枠に基づいて計算し描画することで、この指標はトレーダーに、特に顕著なダイバージェンスやクロスが観察された場合に潜在的なトレード機会を特定する機会を提供します。 指標の主な特徴: 1. 通貨の強さの計算: この指標は、各通貨の強さを対応する時間枠に基づいて計算します。この計算は、指定された期間内に一つの通貨が他の通貨のバスケットに対するパフォーマンスを評価することを含みます。これにより、トレーダーは通貨の相対的な強さまたは弱さを理解することができます。 2. 収縮とダイバージェンス: 2つの通貨の強さの間に収縮またはダイバージェンスの動きがある場合、これは潜在的なトレード機会を示唆する可能性があります。例えば、ある通貨が著しく強くなる一方、別の通貨が弱くなる場合、可能なエントリーポイントを示す可能性があります。 3. ゼロレベルのクロス: この指標は、通貨の強さがゼロレベルをクロスする場合も識別します。ゼロを上回るクロスは強化傾

MetaTrader用 数秘術ベースのサポートとレジスタンスインジケーター 紹介: MetaTrader用 数秘術ベースのサポートとレジスタンスインジケーターで、テクニカル分析の新たな側面を開拓しましょう。このユニークなツールは、数秘術の力を活用して、チャート上で重要なサポートとレジスタンスレベルを特定し、潜在的な価格変動に関する貴重な洞察を提供します。 主要なコンセプト: トレーディングの数秘術: 数秘術は数字とその私たちの生活における意味に関する神秘的な研究です。数秘術の原則をトレーディングに適用することは、象徴的な重要性を持つ特定の数字を特定し、それらを使用して購入または売却の活動を引き寄せる可能性のある価格レベルを予測することを含みます。 インジケーターの機能: 当社のインジケーターは、数秘術の隠れたパターンを利用して、チャート上にサポートとレジスタンスのレベルを描画します。これらのレベルは、金融市場で有意義な数秘術の重要な数字から派生しています。 学習のためのおすすめステップ: 数秘術の理解:インジケーターを使用する前に、数秘術の基本を理解するために時間をかけてください。重要

FxBears Super Trading Indicator を使用した高度な取引の世界へようこそ。 MT4 プラットフォーム専用に設計されたこの革新的なツールは、エリオット波動、需要供給ゾーン、内部インジケーターの力を組み合わせて、情報に基づいた取引決定のための高品質のシグナルをトレーダーに提供します。 90% 以上の成功率を誇る FxBears Super は、あなたの取引戦略に新たなレベルの精度と収益性をもたらします。 Of Corse は再描画も再描画もありません。
エリオット波動分析: FxBears Super はエリオット波動の予測可能性を活用し、市場サイクルとトレンドを特定します。 特徴的な5波動インパルスと3波動修正パターンを分析し、潜在的な転換点や継続パターンを高精度に抽出します。
需要と供給のゾーン: 需要ゾーンと供給ゾーンの重要性を認識し、FxBears Super はチャート上の重要なサポートとレジスタンスのレベルを正確に示します。 市場センチメントが変化するこれらのゾーンは、潜在的な価格反転やブレイクアウトに関する貴重な洞

Binary Lines is a technical analysis indicator for currencies, commodities, cryptocurrencies, stocks, indices and any financial instruments. Can be used for binary options or Forex scalping. Shows entry and exit points at fixed intervals and provides traders the necessary information about the results of possible transactions. Entry points are formed at the very beginning of the candle, in the direction of the MA line, duration
trades in bars can be adjusted manually and adjusted to any financi

The RSI Divergence Indicator is a powerful tool designed to identify potential reversals in the market by spotting discrepancies between the Relative Strength Index (RSI) and price movement. Divergences can be a significant indication of an impending trend change, either from bullish to bearish or vice versa. This indicator is built for making the task of identifying potential trade opportunities more straightforward and efficient.
Features: Automatic Detection: The indicator scans the chart
FREE
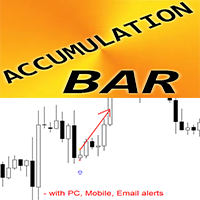
MT4の外国為替インジケーター累積バーパターン
インジケーター「アキュムレーションバー」は、プライスアクション取引のための非常に強力なブレイクアウトに焦点を当てたインジケーターです インジケーターは、1 バーの間に狭い領域での価格の蓄積を検出し、ブレイクアウトの方向、指値注文、SL の位置を表示します。 強気累積バー - チャート上の青い矢印シグナル (写真を参照) 弱気累積バー - チャート上の赤い矢印シグナル (写真を参照) 再塗装は不要です。 遅延はありません。 高い R/R 比 (報酬/リスク)。 インジケーターには調整可能な感度パラメータがあります PC、モバイル、電子メールのアラートが含まれています インジケーター「累積バーパターン」はサポート/レジスタンスレベルと組み合わせるのに適しています: https://www.mql5.com/en/market/product/100903
// さらに優れたエキスパートアドバイザーとインジケーターはここから入手できます: https://www.mql5.com/en/users/def1380/seller //
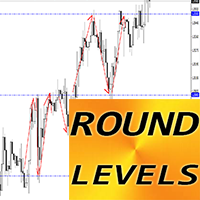
MT4用外国為替インジケーター「ラウンドレベル」
インジケーター「ラウンドレベル」は、サポート/レジスタンスを考慮するトレーダーにとって必須の補助インジケーターです ラウンドレベルは価格によって非常に尊重されます - 価格は非常に頻繁にラウンドレベルから反発します H4、D1 時間枠には 1000 ポイント ステップを使用 H1 以下の時間枠には 500 ポイント ステップを使用します (日中取引の場合) また、ラウンドレベルはテイクプロフィット(ラウンドレベルの前)とSL(ラウンドレベルの後ろ)を割り当てるのに適しています。 これらのレベルは、特に価格が横ばいおよび横ばいの期間に非常に強いです
// さらに優れたエキスパートアドバイザーとインジケーターはここから入手できます: https://www.mql5.com/en/users/def1380/seller // また、収益性が高く、安定していて信頼できるシグナル https://www.mql5.com/en/signals/1887493 に参加することも歓迎します。 当MQL5サイトのみでご提供しているオリジナ

Description Helps you detect the structure of the market, using different types of Smart Money concepts. This should help you to upgrade your trading strategy in every way. MT5 Version Here Smart Money Features: Color candle to signal the type of structure Shows CHOCH and BOS Equal Lows and Highs Order Blocks Internal and Swings Weak and strongs high and lows Fair Value Gaps High and Lows in daily weekly and monthly timeframes Premium and discount Zones KEY LINKS: How to Install – Frequent
FREE

**新登場: オーダーブロックプロ - あなたのMT4取引の秘密兵器!**
金融市場であなたのポテンシャルを最大限に引き出す新しいトレードツールをお探しですか?それなら、我々が誇りを持ってご紹介するのは「オーダーブロックプロ」です。このパワフルなツールは、幅広い機能を提供するだけでなく、従来の指標の制約を克服します。
**オーダーブロックプロの主な特徴**
**1. 正確なエントリーシグナル:** チャートと対話する際、オーダーブロックプロは単にエントリーアローを表示するだけでなく、これらのアローが「リペイント」されないように保証します。これにより、不確実性を排除したユニークなエントリーシグナルを提供します。
**2. タイムリーなアラート:** オーダーブロックプロは重要な注文ブロックエリアを特定するだけでなく、価格がこれらのエリアに近づいたときにアラートを出すことも可能です。これにより、素早く正確なトレードチャンスを捉えることができます。
**3. フレキシブルでカスタマイズ可能:** オーダーブロックプロは、好みに合わせてカスタマイズ可能です。注文ブロックエ

Sacrament mt4- This is an indicator that includes the best basic forex indicators, without redrawing. Based on this data, a signal for sale or purchase is formed. It does not disappear anywhere after the signal, which gives us the opportunity to see the results on the history.
It can be used on any currency pair, crypto metals, stocks
It is best used on an hourly chart, but other periods are also acceptable.
The best results for the period H1,H4,daily
If customers have any questions, I w

Rapid Trend is a technical analysis indicator that determines the direction and strength of a trend, and also signals a trend change. Allows you to determine the current trend. With the help of its algorithm, you can quickly understand what kind of trend is currently developing in the market. Rapid Trend can be used along with oscillators as filters. Setting up the Rapid Trend forex indicator allows you to receive more accurate signals for opening positions. Uses only one parameter for settings.

**TrendLine ProX - The Ultimate Non-Repaint Indicator for MT4 Trading**
**Product Introduction:** We are delighted to introduce TrendLine ProX - an optimized and reliable trading tool for the MT4 platform. With its accurate trend detection and non-repainting feature, TrendLine ProX will be your trustworthy companion to support intelligent trading decisions.
**The Power of TrendLine ProX:** TrendLine ProX is more than just a trading tool; it is a harmonious blend of technology and market ana
RSI Trend Lines Indicator - Identify Optimal Buying and Selling Opportunities Introduction :
The RSI Trend Lines Indicator is a powerful tool designed to assist traders in identifying optimal buying and selling opportunities based on the Relative Strength Index (RSI) oscillator. This advanced indicator draws trend lines on the RSI chart using multiple points, providing valuable insights into potential market trends and reversals. By leveraging the RSI Trend Lines Indicator, traders can enhance
This indicator is an oscillator built on the principle of the classic Momentum. The indicator is part of a series of indicators - Hull Line AM, Hull Momentum AM, Hull Candles AM, Hull Signal AM . The indicator represents the difference between the current price and the price some number of periods ago. The difference from the classic indicator Momentum is the preliminary smoothing of prices according to the method proposed by Alan Hull.
Using the indicator: It should be taken into account tha
FREE
This indicator is a moving average built according to the method proposed by Alan Hull. The indicator is part of a series of indicators - Hull Line AM, Hull Momentum AM, Hull Candles AM, Hull Signal AM . The indicator has minimal lag and allows you to effectively follow the trend direction. The indicator is not redrawn on fully formed bars. The indicator is supplemented with signals and notifications to the terminal and e-mail.
The application of the indicator is identical to the application
FREE

The presented indicator marks signals on the price chart with arrows in accordance with the data of the Hull Momentum AM indicator. The indicator gives a signal and sends a notification to the mobile terminal and email. The indicator is part of a series of indicators - Hull Line AM, Hull Momentum AM, Hull Candles AM, Hull Signal AM . For a better understanding of the operation of each of the indicators, it is recommended to start working with them by using them together on one chart. The Hull M
FREE
The presented indicator colors the chart candles in accordance with the data of the Hull Momentum AM indicator. Coloring of candlesticks depends not only on the location of the oscillator histogram above or below zero. The location of the histogram relative to the signal line is also important. The indicator is part of a series of indicators - Hull Line AM, Hull Momentum AM, Hull Candles AM, Hull Signal AM . For a better understanding of the operation of each of the indicators, it is recommended
FREE
MetaTraderマーケットが取引戦略とテクニカル指標を販売するための最適な場所である理由をご存じですか?宣伝もソフトウェア保護も必要なく、支払いのトラブルもないことです。これらはすべて、MetaTraderマーケットで提供されます。
取引の機会を逃しています。
- 無料取引アプリ
- 8千を超えるシグナルをコピー
- 金融ニュースで金融マーケットを探索
新規登録
ログイン