YouTubeにあるマーケットチュートリアルビデオをご覧ください
ロボットや指標を購入する
仮想ホスティングで
EAを実行
EAを実行
ロボットや指標を購入前にテストする
マーケットで収入を得る
販売のためにプロダクトをプレゼンテーションする方法
MetaTrader 4のための新しいテクニカル指標 - 25
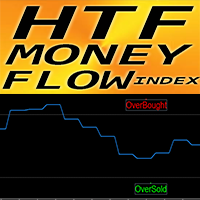
MT4用外国為替インジケーターHTF MFIオシレーター
マネー フロー インデックス (MFI) は、売られすぎゾーンと買われすぎゾーンを識別するために価格と出来高のデータを使用するテクニカル オシレーターです。 HTF は、より高い時間枠を意味します。 MFI が 80 を超えると買われすぎ、20 を下回ると売られすぎになります。 MFI はプライスアクションと組み合わせるのに最適です。 強気価格と弱気価格の勢いに関する情報を提供します このインジケーターは、他のインジケーターと組み合わせたマルチタイムフレーム取引システムに最適です。 HTF MFI インジケーターを使用すると、より高い時間枠から現在のチャートに MFI を添付できます インジケーターにはモバイルおよび PC アラートが組み込まれています
// さらに優れたエキスパートアドバイザーとインジケーターはここから入手できます: https://www.mql5.com/en/users/def1380/seller // また、収益性が高く、安定していて信頼できるシグナル https://www.mql5.co
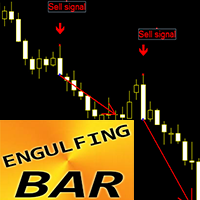
MT4の外国為替インジケーターENGULFINGバーパターン
インジケーター「ENGULFING Bar」は、プライスアクション取引にとって非常に強力なインジケーターです。再描画や遅延はありません。 インジケーターはチャート上のENGULFINGバーパターンを検出します: 強気のENGULFINGバー - チャート上の青い矢印シグナル(写真を参照) ENGULFING 弱気バー - チャート上の赤い矢印シグナル (写真を参照) PC、モバイル、電子メールのアラートが含まれています インジケーター「ENGULFING Bar Pattern」はサポート/レジスタンスレベルと組み合わせるのに最適です: https://www.mql5.com/en/market/product/100903
// さらに優れたエキスパートアドバイザーとインジケーターはここから入手できます: https://www.mql5.com/en/users/def1380/seller // また、収益性が高く、安定していて信頼できるシグナル https://www.mql5.com/en/signal

We offer indicators that will meet your needs more.
>> MT Trend Pro <<
>> MT Magical <<
>> MT Merit TLC <<
MT Supply Demand : It is an indicator created to find supply and demand, which will be important support and resistance levels for the price. It can be set pending orders or used in conjunction with other indicators to send buy or sell signals.
PLATFROM: MT4 Only
TRADE: Forex
TIME FRAME: All Time Frame
SYMBOL PAIR: All Symbol
SETTI
FREE

[ MT5 Version ] Only the next 10 units at current price! Final price: $299 Are you tired of spending months on demo or live accounts to test your trading strategies? The Backtesting Simulator is the ultimate tool designed to elevate your backtesting experience to new heights. Utilizing Metatrader historical symbol information, it offers an unparalleled simulation of real market conditions. Take control of your testing speed, test ideas quickly or at a slower pace, and witness remarkable improvem

You get Ea based on MRA Index for free as a Bonus in case of indicator purchase. For sc alping I optimize sets on period of l ast 12 months and use it next 1 month, this w ay it works very well ! Def ault settings are just for visu alis ation, it c an not be profit able with it, recommended set files I sh are with buyers. The "MRA Index" forex indicator is a versatile tool that combines various technical elements to provide traders with valuable insights into potential market trends and entr
Please feel free to contact me if you need any further information.
Please let me know if you have any questions.
I hope the above is useful to you. MT Magical : is a swing trade and trend and supply&demand strategy through signal filtering with experience. We worked really hard on this project. But it's worth it for investors.
indicator for trade by yourself
TRADE: Forex
TIME FRAME: All Time Frame (Not M1)
SYMBOL PAIR: All Symbol, Recommended
SETTINGS:
SIGNAL: Aggressiv

The FCPI indicator or Forex Currency Power Index indicator for MT4 is a multi currency pairs indicator that displays 28 pairs on 1 chart, which consists of 8 Major Pairs and 20 Cross pairs. 8 Major Pairs and 20 Cross pairs: EURUSD,GBPUSD,AUDUSD,NZDUSD,USDCAD,USDCHF,USDJPY,EURGBP,EURAUD,EURNZD,EURCAD,EURCHF,EURJPY,GBPAUD, GBPNZD,GBPCAD,GBPCHF,GBPJPY,AUDNZD,AUDCAD,AUDCHF,AUDJPY,NZDCAD,NZDCHF,NZDJPY,CADCHF,CADJPY,CHFJPY. Automatically detects symbols that have a symbol prefix and/or a symbol suffi
This indicator allows you to identify a long-term trend and shorter-term price fluctuations. Indicator signals are given only after the full formation of the bar. The indicator can be used to trade any market. The indicator showed the most interesting results on major currency pairs for time periods of one hour or more. Its basic parameters perform well in most situations. At the same time, before starting trading, you should choose the most effective indicator settings for the user's trading st
FREE

This Rattling Signal Point indicator is designed for signal trading. This indicator generates trend signals.
It uses many algorithms and indicators to generate this signal. It tries to generate signals from the points with the highest trend potential.
This indicator is a complete trading product. This indicator does not need any additional indicators.
The indicator is never repainted. The point at which the signal is given does not change. When the signal comes the arrows are put back

This Great Entry System indicator is designed for signal trading. This indicator generates trend signals.
It uses many algorithms and indicators to generate this signal. It tries to generate signals from the points with the highest trend potential.
This indicator is a complete trading product. This indicator does not need any additional indicators.
The indicator is never repainted. The point at which the signal is given does not change. When the signal comes the arrows are put back one
Candlestick Mod rapat.
Chart Candlesticks will stick together. make it look neat and tidy Switch between Candlestick and Line chart fixed. Instruction.
If you don't like the candles colors, you can do so by changing color. read below:
-Colors must be changed in the indicator setting.
-It won't change through the Chart properties to modify.
-After changing the color, save it as template so it wont change the colors to default value.
FREE
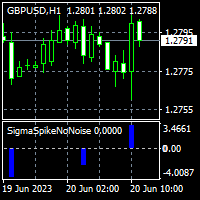
To get access to MT5 version please click here . - This is the exact conversion from TradingView: "Sigma Spikes No Noise" by "irdoj75" - This is a light-load processing and non-repaint indicator. - All input options are available. - Buffers are available for processing in EAs. - You can message in private chat for further changes you need. Thanks for downloading

Super Scalp Indicator MT4 is a unique trend reversal 100% non-repainting multi-algo indicator that can be used on all symbols/instruments: forex, commodities, cryptocurrencies, indices, stocks . Super Scalp Indicator MT4 will determine the current trend at its early stages, gathering information and data from up to 10 standard algos When indicator give a valid buy or sell signal, a corresponding arrow will be printed on the chart, open trade at start of the next candle/bar
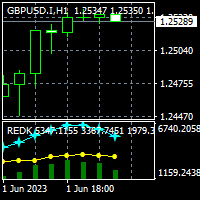
To get access to MT5 version please click here . This is the exact conversion from TradingView: "RedK_Supply/Demand Volume Viewer v3.0" by "RedKTrader" This is a light-load processing and non-repaint indicator. All input options are available. Buffers are available for processing in EAs. You can message in private chat for further changes you need. Thanks for downloading
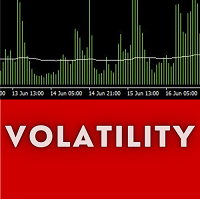
Holy Trinity Volatility Indicator This indicator reflects the peak time of the day wherein there's is expected to be sharp price actions. It also presents the markets as just waking up from the dull and less volatile Asian (and or London) trading sessions into a bustling time of highly liquid price flows. NOTE: This indicator informs the trader ahead of peak price movements - one bar just before the real actions starts. Enter when the volatility line falls below the Tripple Exponential Moving Av

Fractals indicator on Steroids. It has many options to customize and display Fractals from Multi Time Frames. The fractals on their own is a technical analysis tool used in trading to identify key turning points in price trends. Fractals, in the context of trading, refer to recurring patterns that occur within price charts. These patterns consist of five consecutive bars, with the middle bar having the highest high or lowest low, surrounded by two lower highs and two higher lows. The Fractals in
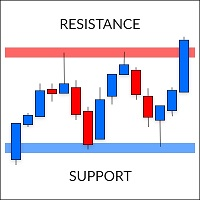
Supports and Resistances is a quick and easy tool for finding support and resistance levels. It was created according to the "run and forget" idea to automate daily routines and speed up the decision-making process.
The indicator analyzes the chart and determines all the zones found with the power assigned to them. Power in this case means the amount of confirmation. The zones are classified into three types: weak, normal and strong - each with a different color. The program implements two ty

驚異的なFXインジケーター「Miraculous」をご紹介します。完璧な結果を得るための1時間足を含むすべてのタイムフレームで効果的に機能する、最強の強力な特殊MT4フォレックスインジケーターです。 すべてのタイムフレームで優れた結果を提供する最高のFXインジケーターを探し続けるのに疲れましたか?これ以上探す必要はありません!「Miraculous」フォレックスインジケーターをご紹介します。このインジケーターは、トレーディングの経験を変革し、収益を新たなレベルに引き上げるために設計されました。 先進のテクノロジーと長年にわたる緻密な開発に基づいて構築された「Miraculous」フォレックスインジケーターは、FX市場における力と正確さの頂点となります。この素晴らしいツールは、すべてのレベルのトレーダーのニーズを満たすように設計されており、一貫した収益性を追求する上で比類のない優位性を提供します。 「Miraculous」フォレックスインジケーターの他との違いは、その非常に適応性にあります。デイトレーダー、スウィングトレーダーであろうと、長期ポジションを好む方であろうと、このインジケータ

オメガのサポートとレジスタンス 安く買って高く売る戦略のための独自の指標 リバーサルタイプのエントリーでは、価格が全長ラインまで上昇すると、価格が反転/スイング/反転することが予想されます。 日次セットアップでは 1 ~ 5 分チャートと 4 時間チャート、または日足では m15 以上、長期セットアップでは週足では 1 時間チャートを取引できます 週足、日足、4時間足、さらには1時間足チャートで、あらゆる商品の高値または安値を予測する高精度の将来価格予測ツール 特定のレベルでの侵入を回避するには、SonicR カラー バー インジケーターなどを使用するのが最善です。その方法と理由についてはビデオをご覧ください。 MT4バージョンは無料のため、サポートは提供されません。MT5のお客様のみがサポートを受けられます。 ビデオと詳細は近日公開予定です! 特徴 独自のサポートとレジスタンスの価格レベル 履歴の日数を制限する 線、色を変更するための入力 使用法 このインジケーターは、取引のみに使用することも、他の戦略と組み合わせて使用することもできます。 予想されるターゲットと転換点、独自の
FREE
収益性の高い市場トレンドを逃すことにうんざりしていませんか?トレンドの継続を正確に識別できる信頼できるツールがあればいいのにと思いませんか?
これ以上探さない!私たちのトレンド継続インジケーターは、あなたの取引戦略を強化し、ゲームの先を行くのに役立ちます。
トレンド継続インジケーターは、トレーダーがさまざまな金融市場におけるトレンド継続パターンを特定して確認できるようにするために特別に作成された強力なツールです。
株、通貨、商品、指数のいずれを取引する場合でも、このインジケーターは取引の意思決定を強化するための究極の相棒です。
MT5バージョン: WH Trend Continuation MT5
特徴:
正確 トレンドの確認. カスタマイズ可能 パラメーター. 使い やすい インターフェイス. リアルタイム アラート. 包括的 サポート . MT4 のトレンド継続インジケーターを使用して、取引戦略を新たな高みに引き上げましょう。トレンド分析の力を活用し、情報に基づいた取引の意思決定を行い、潜在的な利益の世界を解き放ちます。チャンスを逃さな
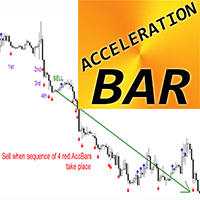
MT4 用外国為替インジケーター アクセラレーション バー - 巨大なトレンドをキャッチできます
インジケーター「アクセラレーションバー」は、トレンド取引のための非常に強力なツールです - 市場フラットの影響は最小限に抑えられます 強気加速バー (青) は、最大値が前の 5 つのバーの最大値よりも高く、最小値が次の 5 つのバーの最小値よりも低いチャート上のバーです。 弱気加速バー (赤) は、最小値が前の 5 つのバーの最小値よりも低く、最大値が次の 5 つのバーの最大値よりも高いチャート上のバーです。 トレンド取引: 買いシグナル - チャート上に 4 つの強気の AccBar のシーケンスがある場合 売りシグナル - チャート上に 4 つの弱気 AccBar のシーケンスがある場合 PC、モバイル、電子メールのアラートが含まれています
// さらに優れたエキスパートアドバイザーとインジケーターはここから入手できます: https://www.mql5.com/en/users/def1380/seller // また、収益性が高く、安定していて信頼できるシグナル htt

The indicator is like a mother-in-law, who talks often, talks a lot and often inappropriately.
The indicator, in addition to giving us an entry signal on parameters which I will then list, monitors the trend of the hourly timeframe, OSMA to understand the entry direction, RSI to sense any overbought or oversold conditions from which to abstain, ATR for the volatility and ADX for the trend.
Indicator not recommended for newbies.
Only the human judgment of these parameters, combined with the e
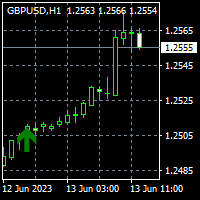
To get access to MT5 version please click here . This is the exact conversion from TradingView: "UT Bot Alerts" by "QuantNomad". This is a light-load processing and non-repaint indicator. Buffers are available for processing in EAs. Candle color option is not available. You can message in private chat for further changes you need. Here is the source code of a simple Expert Advisor operating based on signals from UT Bot Alerts . #property strict input string EA_Setting= "" ; input int magic_numb

The Structural Trend indicator helps to analyze the market on the selected time interval. It defines the mainstream. Easy to set up and works on all pairs and all time frames. Trend indicators make it possible to classify the direction of price movement by determining its strength.
Structural Trend is a trend trading and filtering solution with all the important features of a trend tool built into one tool! The Structural Trend indicator is a development for trend trading.
Good for any trad

Using the Arrow Effect forex indicator algorithm, you can quickly understand what kind of trend is currently developing in the market. The Elephant indicator accompanies long trends, can be used without restrictions on instruments or timeframes. With this indicator, you can try to predict future values. But the main use of the indicator is to generate buy and sell signals. The indicator tracks the market trend, ignoring sharp market fluctuations and noises around the average price. The indicator
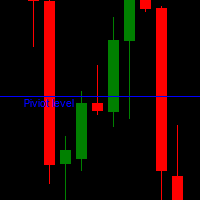
Dear Forex Trader,
We all know that our fx products has remained the buzz of the forex market ever since its inception. Thanks to our subscribers who have been sending their trade history results to us in a viewable format. You've also seen the crazy consistent pips these subscribers generate on a daily basis, What boils down is just a question of whether or not you are ready to change your trading for the better this year. Why not include any of our trading packages in your investment plan t

The Riko Trend indicator is a revolutionary trend trading and filtering solution with all the important features of a trend tool built into one tool! The Riko Trend indicator is good for any trader, suitable for any trader for both forex and binary options. You don’t need to configure anything, everything is perfected by time and experience, it works great during a flat and in a trend.
The Riko Trend indicator is a technical analysis tool for financial markets that reflects the current price

To get access to MT5 version please click here . This is the exact conversion from TradingView: "[SHK] Schaff Trend Cycle (STC)" by "shayankm". This is a light-load processing indicator. This is a non-repaint indicator. Buffers are available for processing in EAs. All input fields are available. You can message in private chat for further changes you need. Thanks for downloading

ForceX Trend is a trend indicator that allows you to effectively determine the direction of the current trend, as well as identify potential reversal points. The indicator makes it possible to classify the direction of price movement by determining its strength. Solving this problem helps to enter the market in time and get the desired result.
Let's start with the benefits.
Allows you to determine the current trend. You can quickly understand what kind of trend is currently developing in th
This indicator displays RVI indicator signals on the chart. The main point of Relative Vigor Index Technical Indicator (RVI) is that on the bull market the closing price is, as a rule, higher, than the opening price. It is the other way round on the bear market. So the idea behind Relative Vigor Index is that the vigor, or energy, of the move is thus established by where the prices end up at the close. To normalize the index to the daily trading range, divide the change of price by the maximum r
FREE
This indicator colors candles in accordance with the projected price movement. This indicator displays signals on the price chart when the closing price crosses the standard moving average line, as well as when the moving average changes its direction. The indicator does not redraw on completed candlesticks. The forming candlestick can change its color depending on the current data. Thus, it is recommended to wait for the candlestick to be completed before making a decision.
Custom Parameters:
FREE
The presented indicator is the author's implementation of the idea embodied in the Alligator indicator, which has already become a classic. The proposed product allows you to visually demonstrate the direction of price movement, temporary price rollbacks and zones of multidirectional price movement. Namely: The indicator lines go up and diverge from each other - a strong bullish trend; The indicator lines go down and diverge from each other - a strong bearish trend; The indicator lines go up but
FREE
Supply and Demand Tracker MT4
US PPI, Fed Interest Rates, and FOMC Trade Setup Time Lapse: U.S. dollar(DXY) and Australian dollar vs U.S. dollar(AUD/USD) https://youtu.be/XVJqdEWfv6s May CPI Trade Setup Time Lapse: Gold, Euro/US dollar, US Tech 100, and USDX Experience the power of our cutting-edge supply and demand system as we delve into the captivating world of market dynamics surrounding the release of the consumer price index (CPI). Our system, built on the principles of supply and dema

This indicator identifies swing highs and swing lows in the price chart by comparing the Highs and lows of each candle to a specified number of candle before and after it. Once it has identified the swing highs and swing lows, it can use them to determine potential support and resistance levels. A support level is formed when the price drops and bounces back up from a swing low, indicating that there is buying pressure at that level. A resistance level is formed when the price rises and reve
FREE

This indicator uses the Zigzag indicator to identify swing highs and swing lows in the price chart. Once it has identified the swing highs and swing lows, it can use them to determine potential support and resistance levels. A support level is formed when the price drops and bounces back up from a swing low, indicating that there is buying pressure at that level. A resistance level is formed when the price rises and reverses downward from a swing high, suggesting selling pressure at that leve
FREE

Th indicator is a technical analysis tool that helps identify significant changes in price trends and filter out minor price fluctuations. It is used to highlight price swings and provide a clearer picture of market movements. The Pivots are found by checking if a certain candle is the highest/lowest in a given number of candles that come before and after it. This indicator has only one input, its period. The Higher the period, the more strict the indicator is about what constitutes a Pivot. Th
FREE
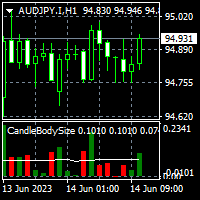
To get access to MT5 version please click here . This is the exact conversion from TradingView: "Candle body size" by "Syamay". This is a light-load processing indicator. This is a non-repaint indicator. Buffers are available for processing in EAs. All input fields are available. You can message in private chat for further changes you need. Thanks for downloading
FREE

XP Speed Meter the best indicator that measures the price/tick’s currency speed for you. It will give you the ability to know when the pair moving fast or slow . So, you can trade or not trade. It’s very important tool for scalper traders – news traders. Even for trend traders it will be useful to know if the market is trending fast or slow . XP Speed Meter is better than the volume type indicators of course. Because it shows the currency speed on the run-time without any lacking like what the v

Dear traders I am happy to introduce to you my new tool called "Brilliant Oscillator" Indicator. This is one of the indicators that can be used as a stand alone indicator. WHAT I LIKE ABOUT THIS TOOL IS Fast and reliable signals Purpose The purpose of this tool is to assist both newbie and Advanced traders to analyze the market with high level of accuracy in both bearish and bullish market trends. The inputs In the input section you will be able to change colors of the indicator only. Currency p

Dear Traders here is my another tool called the "Sell Index". My goal is to come up with different tools to help you trade successfully. No matter the strategy and trading style you use but what matters most at the end is "making money out of the market". Go with a strategy that works for you and it should be the one you find easy to use. The philosophy behind this tool is "Focus only on sell signals" meaning that if the market is currently bearish why should you focus on buy signals?. Sometime

Dear Traders here is my another tool called the "Buy Index". My goal is to come up with different tools to help you trade successfully. No matter the strategy and trading style you use but what matters most at the end is "making money out of the market". Go with a strategy that works for you and it must be the one you find easy to use. The philosophy behind this tool is "Focus only on buy signals" meaning that if the market is currently bullish why should you focus on sell signals?. Someti
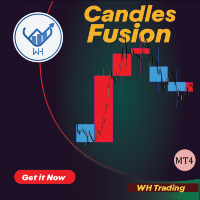
Candles Fusion is a powerful MT4 indicator that enhances your trading analysis by displaying higher timeframe candles on the current timeframe.
This unique feature provides traders with a comprehensive view of price action across different timeframes, enabling them to make more informed trading decisions.
Features:
Multi-Timeframe Overlay. Customizable Timeframe Selection. Clear Visualization and color candle selection . Real-Time Updates. User-Friendly Interface.
Candles Fusion is
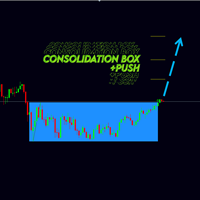
Новая версия индикатора консолидаций Consolidation box Generator. Предыдущая версия тут . Примеры настроек на индикатор тут . На данный момент этот инструмент анализа рынка уже нельзя назвать просто индикатором. Потому как это торговая стратегия. Наше ноу-хау заключается в том, что данный индикатор не требует огромного количества тестов в тестере стратегий. В индикаторе реализован блок статистики - при нанесении на график вам сразу будет видна результативность работы стратегии. Вы можете настро
The Relative Currency Strength Indicator is a tool designed to analyze and compare the strength of a quote currency against four different currency pairs on a selected timeframe. It provides a visual representation of the relative strength of currencies, helping traders identify potential trading opportunities. Key Features: Customizable quote currency: Select a specific currency to measure its strength against multiple currency pairs. Multi-timeframe analysis: Choose the desired timeframe to ev

TPSpro TRENDPRO - is a trend indicator that automatically analyzes the market and provides information about the trend and each of its changes, as well as giving signals for entering trades without redrawing! The indicator uses each candle, analyzing them separately. referring to different impulses - up or down impulse. Exact entry points into transactions for currencies, crypto, metals, stocks, indices! - Version MT5 DETAILED DESCRIPTION R ecommended to use with
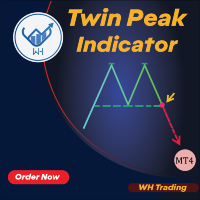
ツインピークインジケーターMT4へようこそ --(ダブルトップ/ボトム)-- ダブルトップアンドボトムインジケーターは、市場の潜在的な反転パターンを特定するために設計されたテクニカル分析ツールです。
これは、価格がほぼ同じ高さの 2 つの連続した山または谷を形成し、その後、反対方向に価格が変動した領域を特定します。
このパターンは、市場が勢いを失いつつあり、トレンド反転の準備ができている可能性があることを示しています。
特徴:
チャートの自動注釈: インディケータはチャート上のダブルトップとボトムのパターンを自動的にマークします。 使いやすさ: このインジケーターはユーザーフレンドリーで、MT5 プラットフォームのどのチャートにも簡単に適用できます。 カスタマイズ可能: インジケーターにはカスタマイズ可能な設定があります。 警報システム。 あらゆる楽器で動作します。 このインジケーターを他のテクニカル分析ツールと組み合わせて使用すると、トレンドの方向と反転パターンの潜在的な強さを確認できます。 全体として、ダブルトップアンドボトムインジケーターは、市場の潜在的
信頼性の低いバイナリオプションのインジケーターにうんざりしていませんか?偽のシグナルを出して損失や失望を招くこともありますよね?それなら、CLOCK INDICATORを探す必要はありません。これはMT4トレーディングプラットフォームで利用できる最高のバイナリオプションのインジケーターです。
高度なアルゴリズムと強力なテクニカル分析ツールを備えたCLOCK INDICATORは、初心者から経験豊富なトレーダーまで、究極のトレーディングツールです。市場のトレンドを正確に予測し、利益を生むトレードの機会を特定し、利益を最大化し、損失を最小限に抑えるのに役立ちます。
他の複雑で使いにくいバイナリオプションのインジケーターとは異なり、CLOCK INDICATORは簡単にインストールしてカスタマイズできます。設定を個別の取引の好みに合わせることができ、すべての主要な通貨ペアと時間枠でシームレスに動作します。
CLOCK INDICATORの特筆すべき特徴の1つは、再描画されない性質です。シグナルが生成されると、チャート上に表示されるため、正確な情報に基づいて的確な取引決定をするこ

F-16 Plane Indicatorをご紹介します。これは、取引体験を革新するために設計された最先端のMT4ツールです。F-16戦闘機の無類のスピードと精度に触発され、このインジケーターは高度なアルゴリズムと最新技術を組み合わせ、金融市場で比類のないパフォーマンスを提供します。 F-16 Plane Indicatorを使用すると、リアルタイムの分析と高精度な取引シグナルの生成が可能で、競争相手を圧倒します。ダイナミックな機能により、さまざまな資産クラスで利益を見つけることができ、自信を持って的確な決定を行うことができます。 使いやすいインターフェースを備えたF-16 Plane Indicatorは、人気のあるMetaTrader 4プラットフォームとシームレスに統合され、スムーズで効率的な取引プロセスを実現します。初心者のトレーダーでも経験豊富なプロフェッショナルでも、このインジケーターは独自の取引スタイルと好みに合わせて簡単にカスタマイズすることができます。 F-16 Plane Indicatorのパワーを体感し、市場のトレンドを精密かつ敏捷にナビゲートします。高度なチャー

強力かつ多用途のマルチシンボルである移動平均クロスオーバー スキャナー Pro の紹介。 マルチタイムフレーム 取引の意思決定を強化するために設計されたインジケーター。この高度なインジケーターには移動平均 (MA) クロスオーバーが組み込まれており、高速で信頼性の高いアラートを提供する追加機能が提供されます。
Moving Average Crossover Scanner Pro を使用すると、複数の通貨ペアと時間枠にわたる MA クロスオーバーのユニークな特性から恩恵を受けることができます。このインジケーターの包括的なダッシュボードにはすべてのシグナルがボタンとして表示され、必要な情報に簡単にアクセスできます。ボタンをクリックするだけで、クロスオーバー ラインを含む新しいチャートが開き、シグナルがより詳細に表示されます。
取引体験を合理化するために、インジケーターにはシグナルに対応する最新のチャートを自動的に開くオプションが含まれています。 「新しいチャートを開く」機能を有効にすることで、取引機会を迅速に分析し、対処することができます。
Movi

5/10 30$でコピー ---> 次は50$ // MT5版
Forex Vigor は、8つの主要通貨(EUR、GBP、AUD、NZD、USD、CAD、CHF、JPY)の勢いの強さを評価するテクニカル指標です。このインディケータは、28の通貨ペア間の相関性の欠如を測定する数学的計算 に依存しています。その値を計算するために、線形加重平均法(LWMA)と、モデルにおいて有意性を示さない値を排除する統計システムを使用して、終値の差の割合を分析します。この方法は、最近の値動きをより重要視する加重平均を提供するものです。この割合の差を考慮することで、この指標は、通貨のモメンタムの強さと方向性を示す指標となります。
主要通貨のモメンタムの強さを評価し、市場力学に関する貴重な洞察を提供するこの指標は、トレーダーが潜在的な取引機会を特定し、より多くの情報に基づいた取引決定を行い、効果的にリスクを管理するのに役立つ。
特徴 リペイントなし 新しいデータが届いても、このインジケータの値は変わりません。 取引ペア 28の取引ペア 時間枠 全て (M1, M5, M15, M30,

MT4 用の高度なマルチシンボルおよびマルチタイムフレーム インジケーターであるハル移動平均スキャナー の紹介です。この強力で多用途のツールは、取引上の意思決定を強化するように設計されています。このインジケーターには ハル移動平均 (HMA) が組み込まれており、高速で信頼性の高いアラートを提供する追加機能が提供されます。 ハル移動平均スキャナを使用すると、複数の通貨ペアと時間枠にわたるハル移動平均の固有の特性から恩恵を受けることができます。このインジケーターの包括的なダッシュボードにはすべてのシグナルがボタンとして表示され、必要な情報に簡単にアクセスできます。ボタンをクリックするだけで、HMA ラインを含む新しいチャートが開き、シグナルがより詳細に表示されます。 取引体験を合理化するために、インジケーターにはシグナルに対応する最新のチャートを自動的に開くオプションが含まれています。 「新しいチャートを開く」機能を有効にすることで、取引機会を迅速に分析し、対処することができます。 ハル移動平均スキャナー インジケーターには、スキャンと単一 HMA ライン描画の 2 つのモードがありま

あなたのトレーディングジャーニーを変える高度なマルチシンボルおよびマルチタイムフレームインジケーターであるパラボリック ブレイクアウト スキャナー プロのパワーを体験してください。比類のない精度で、このインジケーターを使用すると、SAR のブレイクアウトを特定し、最適なエントリーポイントとエグジットポイントに関するアラートをタイムリーに受け取ることができます。ユーザーフレンドリーなダッシュボード、カスタマイズ可能なパラメータ、自動チャート表示、市場とのつながりを維持する包括的なアラート システムの利便性を実感してください。 Parabolic Breakout Scanner Pro は、その卓越した機能でトレーダーに力を与えるように設計されています。複数の通貨ペアと時間枠を同時にスキャンして分析できるこの強力なインジケーターは、市場の状況の全体的なビューを提供します。潜在的な取引の概要を明確に提供する包括的なダッシュボードのおかげで、取引機会をシームレスにナビゲートし、情報に基づいた意思決定を簡単に行うことができます。 インタラクティブなボタンインターフェイスを使用して取引体験を簡素
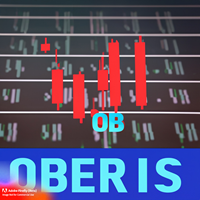
オーダーブロックインジケーターを使用して取引を改善したいと思いませんか? 注文ブロックは、トレンドの変化や強い動きを引き起こす可能性のある買い注文または売り注文が蓄積される市場の領域です。 これらの注文ブロックを特定することは、参入機会と撤退機会を見つけたり、リスクと利益を管理したりするのに非常に役立ちます。 しかし、これらの順序ブロックを手動で見つけるのは難しく、面倒な場合があります。 そのため、私たちは、チャート上でこれらのブロックを自動的に検出してマークするのに役立つ、MetaTrader 4 の注文ブロック インジケーターである Oberis を作成しました。 Oberis はどのように機能しますか? Oberis は、価格と出来高を分析して市場で最も関連性の高い注文ブロックを特定する指標です。 これらの注文ブロックは、強気か弱気かに応じて、緑または赤の四角形で表示されます。 Oberis は非常に使いやすいです。 これを MetaTrader 4 にインストールし、取引したい通貨ペアまたは資産のチャートに適用するだけです。 Oberis は、あらゆる時間枠とあらゆるチャート
チャート上で描画するインジケーターをご紹介します:チャート上で創造力を解放しましょう!
トレードチャートに注釈をつけるのに苦労して、分析を理解したりアイデアを効果的に伝えるのに苦労していませんか?それならお探しのものはこちらです!私たちは、チャート上で簡単に描画や注釈をすることができる画期的なツール、「チャート上で描画するインジケーター」をご紹介できることを喜んでいます。わずか数回のクリックやペンのストロークで、あなたのチャートに直接描画や注釈を追加できます。
私たちの革新的なチャート上で描画するインジケーターは、チャート体験を向上させ、あなたの創造力の可能性を引き出すことを目指しています。この強力なツールを手にすれば、思考を簡単に表現し、重要な水準を示し、パターンを強調表示し、トレード戦略を視覚的に表現することができます。経験豊富なトレーダー、テクニカルアナリスト、またはトレーディングの魅力的な世界を探求する初心者であっても、チャート上で描画するインジケーターは、チャートとの対話方法を根本から変える非常に価値のあるツールです。
主な特徴:
使いやすいインターフェース

Professional Histogram (PH) は、外国為替、CFD、バイナリー オプションを取引するための非常に効率的で信頼性の高いツールです。
PH は、初心者にも経験豊富なトレーダーにも使いやすく、設定も簡単です。
ほとんどのインジケーターとは異なり、プロフェッショナル ヒストグラムはより長いトレンドを検出し、誤ったシグナルを与えることが少なくなります。
買いまたは売りのシグナルが現れるとアラートがトリガーされるため、タイムリーにポジションをオープンできるため、常に PC の前に座っている必要がなくなります。
取引のヒント ヒストグラムの色が変わったらポジションをオープンします。 スクリーンショット 1 のサンプル取引を参照してください。
このインジケーターは、M15-H4 での取引に最適です。
特徴 スキャルピングや長期トレードに適しています。 電子メールやモバイル デバイスに信号を送信します。 使い方も設定も簡単です。 独立したツールとして使用することも、他のインジケーターと組み合わせて使用することもできます。 再塗装は無し。 遅

Scalping Entry Points - is a manual trading system that can adjust to price movements and give signals to open trades without redrawing. The indicator determines the direction of the trend by the central level of support and resistance. The dot indicator provides signals for entries and exits. Suitable for manual intraday trading, scalping and binary options. Works on all time frames and trading instruments.
The indicator gives several types of alerts.
How to use the product
The blue line
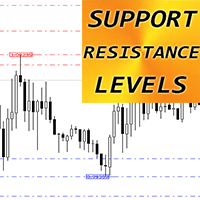
MT4用外国為替インジケーター「サポートレジスタンスレベル」
インジケーター「サポートレジスタンスレベル」はトレードに非常に役立つ補助インジケーターです 「サポート」と「レジスタンス」は価格によって考慮されるチャート上の重要なゾーンです サポートレベルとは、価格が定期的に下落を止めて反発するレベルです。 レジスタンスレベルとは、通常、価格の上昇が止まり、再び下落する地点です。 インジケーター「サポート抵抗レベル」は、最近のレベルを示します。 抵抗レベル - 赤い線。 サポートレベル - 青い線 計算に使用するバーの数、線の種類、色は設定で調整できます インジケーター「サポートレジスタンスレベル」は、価格アクションパターンによるテイクプロフィットターゲット、価格反転、再テストを計画するのに最適です。
// さらに優れたエキスパートアドバイザーとインジケーターはここから入手できます: https://www.mql5.com/en/users/def1380/seller // また、収益性が高く、安定していて信頼できるシグナル https://www.mql5.com/en/s

The Accurate Werewolf indicator tracks market trends, ignoring sharp swings and market noise. The indicator can work both for entry points and as a filter.
The Accurate Werewolf indicator displays information in a visual way. It will help in finding entry points in the analysis. Suitable for trading on low timeframes because it ignores sudden price spikes or corrections in price action by reducing market noise around the average price.
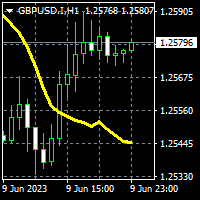
To get access to MT5 version please click here . This is the exact conversion from TradingView: "ZLSMA - Zero Lag LSMA" by "veryfid". This is a light-load processing indicator. This is a non-repaint indicator. Buffers are available for processing in EAs. All input fields are available. You can message in private chat for further changes you need. Thanks for downloading

Jerk Trend is a new product that allows you to identify the current market phase (uptrend, downtrend or flat). Represents a typical investor strategy that usually indicates a trend change from bearish to bullish. A tool that allows you to determine the direction and strength of a trend. Unlike most indicators, Jerk Trend finds longer-term trends and gives fewer false signals.
This indicator displays arrows of different colors depending on the current state of the market and thus signals the u

Ready-made trading strategy on the signals of the "Myforexfunds" indicator:
1. Market entry point: When the indicator draws a blue line, open the cover to buy (long). When the indicator draws a red line, open the cover to sell (short). You can enter the market at the close of the bar, when a new signal is formed.
2. Market exit point: Set-stop-loss (stop-loss) at the old distance from the entry point, eliminating potential losses in case of wrong market direction. For example, you can set a

"Dragon's Tail" is an integrated trading system, not just an indicator. This system analyzes each candle on a minute-by-minute basis, which is particularly effective in high market volatility conditions. The "Dragon's Tail" system identifies key market moments referred to as "bull and bear battles". Based on these "battles", the system gives trade direction recommendations. In the case of an arrow appearing on the chart, this signals the possibility of opening two trades in the indicated directi

URGENT REMINDER> Only 5 remaining Copies for next unlimited price to be 360$ (THIS IS A SPECIAL OFFER TOOL) If you are looking for FAST , RELIABLE and PROFITABLE indicator to help you take easy trades then this is the tool to go with. Trading is very tricky, frustrating, confusing, embarrassing and even can make you go broke if you approach the market with gambling mindset, poor entry and exit strategies, unreliable indicators or signals, poor money management skills and lack of knowledge. Many

The indicator visualizes the result of the CalculateScientificTradePeriod script (which, of course, also needs to be downloaded), which, firstly , estimates how many Mx bars of the active chart the future trend will most likely continue and what is its quality, and, secondly , calculates the optimal the averaging period (which is also equal to Mx) of the ScientificTrade indicator, which gives the maximum profit according to the extremely effective ScientificTrade strategy. For the FindS
One of the basic rules of trading is that the trend is your friend. The presented indicator is one of the best solutions for building your own trading system. Basic rules for its use: Green line - buy trades are allowed; Red line - sell trades are allowed. The indicator displays signals confirming the development of a bullish and bearish trend using the ADX oscillator algorithm. Average directional movement index (ADX) determines a price movement direction comparing its high and low with high an
FREE
The presented indicator gives signals about the price leaving the Donchian channel, as well as about the price returning to the channel. Donchian channel - a technical indicator developed by Richard Donchian, is a variation of the trading interval breakout rule. It is built by taking the highest (high from High) and lowest (low from Low) prices for the previous n periods, followed by marking the area between them on the chart. Donchian recommended using his indicator for daily timeframes with an
FREE
A popular signal indicator marking buy/sell points. Recommended for use in conjunction with a trend indicator to filter signals. The indicator has only one adjustable parameter that determines its sensitivity, which greatly simplifies setting the indicator to the current market and the user's trading style. The indicator can be used to trade any market. Its basic parameters perform well in most situations. At the same time, before starting trading, you should choose the most effective indicator
FREE
The presented indicator gives signals about the price exiting the Keltner channel, as well as about the price returning to the channel. Keltner channel is a technical indicator consisting of two bands above and below the moving average of the price indicator, the width of which is determined as a share of the average price change over the period. The author of this technique is Chester W. Keltner, who published it in his book How To Make Money in Commodities in 1960. The Keltner channel has unde
FREE
Automated Supply and Demand Trading Edge MT4 These videos demonstrate how we apply the supply and demand system to our latest trading review and market analysis. US Tech 100 Index Trade Setup time laps 12/6/2023. https://youtu.be/zHdjHnr3GNo https://youtu.be/JJanqcNzLGM , https://youtu.be/l70MIHaQQa4 , https://youtu.be/pg0oiT5_8y0 Enhance your Trading Strategy with the Supply and Demand Trading Edge MT4. Gain a competitive market advantage with the Supply and Demand Trading Edge MT4

The Binary Tend Follower indicator has been designed especially for Binary options trading. The best time frame to use the indicator on is a 1M chart with 1Min expiry's as soon as the signal candle closes. There is no need to over complicate your trading as all the thinking has been done for you. The indicator was designed as simple as possible to take out all the subjectivity of trying to follow a complicated strategy, and allowing the trader to focus on extremely simple entry's. Buy: When th
MetaTraderマーケットはMetaTraderプラットフォームのためのアプリを購入するための便利で安全な場所を提供します。エキスパートアドバイザーとインディケータをストラテジーテスターの中でテストするためにターミナルから無料のデモバージョンをダウンロードしてください。
パフォーマンスをモニターするためにいろいろなモードでアプリをテストし、MQL5.community支払いシステムを使ってお望みのプロダクトの支払いをしてください。
取引の機会を逃しています。
- 無料取引アプリ
- 8千を超えるシグナルをコピー
- 金融ニュースで金融マーケットを探索
新規登録
ログイン