YouTubeにあるマーケットチュートリアルビデオをご覧ください
ロボットや指標を購入する
仮想ホスティングで
EAを実行
EAを実行
ロボットや指標を購入前にテストする
マーケットで収入を得る
販売のためにプロダクトをプレゼンテーションする方法
MetaTrader 4のための新しいテクニカル指標

4.8(25件) ゴゴジャングル での評価
【トレンドラインPro2】 MT4(MetaTrader4)ライントレード補助インジケーターです。 ダウ理論に忠実であることを前提とした、誰にでもお勧めできる、とてもベーシックな仕様です。 ダウ理論に基づくトレンドを認識し、さらにサポートライン・レジスタンスライン・トレンドラインをリアルタイム自動描画・自動削除します。 精度は非常に高いです。
【挙動確認】 Youtube では、毎週末に挙動確認用動画をアップしています。
【ZigZag】 チャート形状から作られる、ダウ理論に沿ったオリジナルのジグザグをベースとしています。 ジグザグから読み取れるトレンドは、ダウ理論に沿って8段階まで束ねられています。
【Sign】 ダウ理論に基づく8段階のジグザグに沿って、トレンド方向を表示します。 緑(アップトレンド) 赤(ダウントレンド) 白(トレンドレス) 黄(最小から5つ以上のトレンドが上を示している) 黄(最小から5つ以上のトレンドが下を示している)
【Lines】 ダウ理論に基づく8段階のジグザグに沿っ

Reversal Zones Pro is an indicator specifically designed to accurately identify key trend reversal zones. It calculates the average true range of price movement from the lower to upper boundaries and visually displays potential zones directly on the chart, helping traders effectively identify important trend reversal points.
Key Features:
Reversal Zone Identification: The indicator visually displays potential reversal zones directly on the chart. This helps traders effectively identify impo
移動平均線を微調整するための究極のツール これは、移動平均線の設定を簡素化し、最適化するために設計された高度なツールです。MAチューナーを使用すると、ユーザーフレンドリーなパネルを通じて、主要なパラメーター(期間、シフト、メソッド、価格)を簡単に調整でき、キャンドルが移動平均線を交差する頻度や、それに対するオープンおよびクローズの位置に関する詳細な統計情報を即座に取得できます。 なぜ、標準の移動平均線インジケーターよりも優れているのでしょうか? 標準の移動平均線インジケーターと同じMAラインを描画しながら、MAチューナーでは、期間を1ずつ増やすたびにインジケーターウィンドウを開く必要がありません。さらに、シフトや他の調整もスムーズに行えるため、より効率的なトレーディングが可能です。
FREE
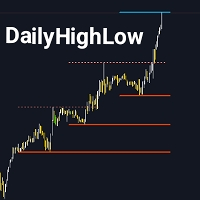
DailyHighLow インジケーターは、MetaTrader 4 (MT4) プラットフォーム用に設計されており、トレーダーが日々の価格変動を監視するのに役立ちます。このインジケーターは、指定した期間の最高値と最低値に基づいて自動的にトレンドラインを描画し、正確な市場情報を視覚的に提供します。 主な特徴: トレンドラインのカスタマイズ: トレーダーの好みに合わせて、トレンドラインの色、スタイル、幅を調整できます。トレンドラインには、ブレイクとノンブレイクの両方の設定が可能です。 動的な更新: トレンドラインは最新の市場データに基づいて自動的に調整され、ブレイクの状況を示す視覚的なマーカーが用意されています。 柔軟なパラメータ設定: 表示する日数の設定、ブレイク後のラインの終了時間、および高値と安値のトレンドラインの外観をカスタマイズできます。 明確な視覚効果: ブレイクラインとノンブレイクラインを異なる色とスタイルで区別し、市場の主要レベルを迅速に識別できます。 このインジケーターは、トレンドラインを明確にカスタマイズし、短期および長期の市場動向を分析する際に役立つツールです。Da
FREE

Smart Fibo Zones are powerful, auto-generated Fibonacci Retracements that are anchored to key market structure shifts . These zones serve as critical Supply and Demand levels, guiding you to identify potential price reactions and confirm market direction. Fibonacci calculations, widely used by professional traders, can be complex when it comes to identifying highs and lows. However, Smart Fibo Zones simplify this process by automatically highlighting order blocks and key zones, complete with St
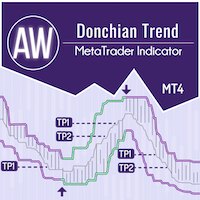
AW Donchian Trend は、Donchian チャネルに基づくトレンド インジケーターです。このインジケーターは、TakeProfit レベルと StopLoss レベルを計算でき、シグナルの成功に関する高度な統計情報と、受信したシグナルに関する 3 種類の通知を備えています。 セットアップガイドと手順 - こちら / MT5バージョン - こちら インジケーターを使った取引方法: AW Donchian Trend を使用した取引は、次の 3 つの簡単なステップで行えます。 ステップ1 - ポジションを開く M15時間枠で70%以上の成功率で買いシグナルを受信し、H1とD1でトレンドの方向を確認し、より高い時間枠でシグナルの方向とトレンドが一致したときにポジションを開きます。
ステップ2 - 定義 ストップロス 逆シグナルまたはストップロスレベルの動的計算によるストップロスの選択 ステップ3 - テイクプロフィット戦略の定義 戦略1: TP1に達したらポジション全体をクローズする
戦略2: TP1に到達したらポジションの50%をクローズし

ボリューム ブレイク オシレーターは、オシレーターの形で価格変動とボリューム トレンドを一致させるインジケーターです。
私はボリューム分析を戦略に統合したいと思っていましたが、OBV、マネー フロー インデックス、A/D、ボリューム加重 Macd など、ほとんどのボリューム インジケーターにいつもがっかりしていました。
そのため、このインジケーターを自分で作成し、その有用性に満足したので、市場に公開することにしました。
主な機能:
ボリュームの増加 (ブレイク) によってサポートされる方向に価格が動くフェーズを強調します。 ボリュームの増加が止まり、市場が縮小するフェーズを強調します。 特に時間枠 (<=15 分) のデイトレードでは、価格もボリュームも動かないため、市場が将来の動きに備えられるフェーズを強調します。 ボリュームの増加によってサポートされていない場合、他のエキスパート アドバイザーからの誤ったシグナルをフィルターします。 トレンドとレンジ フェーズを非常に簡単に視覚化できます 入力パラメーター: 計算設定: 計算タイプ: FAST、NORMAL、SLO
「リアルタイム・マルチインジケーター」とは何ですか? 「リアルタイム・マルチインジケーター」は、テクニカル分析を簡素化し、最適化するために設計された高度なトレーディングツールです。この革新的なインジケーターは、複数のタイムフレームやテクニカル指標からのシグナルを収集し、それらを単一の、わかりやすく読みやすいテーブルに表示します。チャートを頻繁に切り替えたり、各インジケーターを手動で分析したりすることなく、マーケットの全体像を把握したい方には、「リアルタイム・マルチインジケーター」が最適なソリューションです。 「リアルタイム・マルチインジケーター」を選ぶ理由は? マルチタイムフレーム分析: 「リアルタイム・マルチインジケーター」は、異なるタイムフレームで市場を同時に監視することができます。M15からH4まで、このインジケーターは各タイムフレームでトレンドが上昇か下降かを明確に示し、市場の全体像に基づいた情報に基づいた意思決定をサポートします。 複数の指標の統合: このツールは、パラボリックSAR、MACD、SMA、ADX、およびCCIなど、いくつかの重要なテクニカル指標のシグナルを組み合
9月1日(日)まで、77.90ドルから37.90ドルに割引 「Forex Scanner」とは何ですか? 「Forex Scanner」は、外国為替市場をリアルタイムで包括的に把握するために設計された強力な取引ツールです。この高度なインジケーターは、複数のテクニカルインジケーターや時間枠から重要なデータを収集し、取引の機会を迅速に特定できるようにします。複数の資産やパラメーターを監視しつつ、チャートを切り替えることなく取引したい場合、「Forex Scanner」は最適なソリューションです。 「Forex Scanner」を選ぶ理由 マルチタイムフレームスキャン: 「Forex Scanner」は、数分から数時間のさまざまな時間枠で市場を監視することができます。このツールは、複数の時間レベルでトレンドや取引シグナルを即座に識別するのに役立ち、完全で詳細な市場のビューに基づいて行動することを可能にします。 複数インジケーターの統合: このインジケーターは、ATR、RSI、ストキャスティクス、ADX、ピボット、MAなど、幅広いテクニカルツールを統合しており、各資産の市場状況を明確かつ正確に
Enhanced RSI: より深いテクニカル分析のためのハイブリッドインジケーター Enhanced RSIは、トレーダーにより包括的で正確な市場分析を提供するために設計された、多用途でカスタマイズ可能なテクニカルインジケーターです。移動平均、RSI、MACDの最良の特徴を組み合わせることで、このインジケーターはモメンタムとトレンドの強さの多次元的な視点を提供します。 主な特徴: 完璧なハイブリッド: Enhanced RSIは、移動平均、RSI、MACDの機能を融合させ、価格動向のより完全な把握を提供します。 最大の柔軟性: カスタマイズ可能な期間により、このインジケーターはどんなトレードスタイルや時間枠にも適応します。 汎用性: 外為市場から仮想通貨、株式、指数まで、あらゆる金融資産で機能します。 分析サポート: Enhanced RSIは自動取引システムではなく、あなたのテクニカル分析を強化するための有用なシグナルと確認を提供するツールです。 動作原理: Enhanced RSIは、RSIの指数移動平均を計算し、それをMACDからのシグナルと組み合わせます。その結果、買われ過ぎ
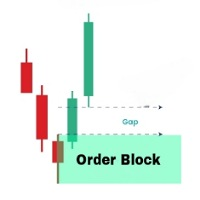
OrderBlock Analyzer は、MetaTrader 4 (MT4) 用にカスタマイズされたインジケーターで、価格チャート上のオーダーブロック(Order Blocks)を検出し、ハイライトします。このインジケーターは、市場の主要な構造を特定するのに役立ち、反転や継続の可能性のある領域を示します。OrderBlock Analyzer は、マーケットの動きに基づいて、自動的にオーダーブロックを描画し、上昇と下降のブロックを異なる色で区別します。 主な機能: 上昇および下降オーダーブロックの検出とマーキング。 グラフ上でリアルタイムにオーダーブロックを更新し、トレーディングのチャンスを迅速に特定します。 オーダーブロックの色、ボーダーライン、ラインスタイルのカスタマイズが可能です。 ボーダーラインの色と厚さの柔軟な設定。 このインジケーターは、トレンドや反転に基づいたトレーディング戦略を使用するすべてのタイプのトレーダーに最適です。
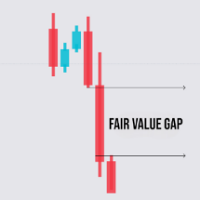
FVG Analyzer は、MetaTrader 4 用にカスタマイズされたインディケーターで、価格チャート上の公正価値ギャップ(Fair Value Gaps、FVG)を検出して強調表示するために設計されています。このツールは、価格のギャップが発生したエリアを検出し、これらのギャップに基づいた潜在的な取引機会を提供します。 主な特徴: FVGの検出 : ブルリッシュFVG : 次のローソク足の最高値が前のローソク足の最低値よりも低い場合に、高値のギャップを検出します。 ベアリッシュFVG : 次のローソク足の最低値が前のローソク足の最高値よりも高い場合に、低値のギャップを検出します。 強調表示 : チャート上に色付きの長方形を描画してFVGを表示します。 FVGが埋まると、事前に設定された色に基づいて長方形の色を変更するオプションがあります。 FVG内に埋め込み用のラインを表示し、ラインの色、太さ、スタイルを調整できます。 設定パラメータ : ローソク足の数 : FVGを検出するために使用するローソク足の数を定義します。 FVGの最小幅 : 検出するためのギャップの最小幅(ポイント
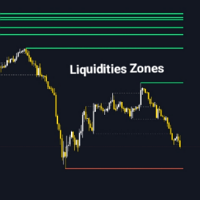
Liquidity Zone Detectorは、ZigZagインジケーターを使用して市場の重要な流動性ゾーンを特定し、強調するために設計された高度なテクニカルインジケーターです。このツールは、ZigZagによって検出された高値と安値にトレンドラインを描画することで、重要な流動性が存在する可能性のある価格レベルを特定します。Liquidity Zone Detectorは、流動性の蓄積や放出に基づいて、トレンドの反転や継続の可能性があるエリアを特定するのに役立ちます。 主な機能: 自動流動性ゾーン識別 : ZigZagインジケーターによって特定された高値と安値にトレンドラインを描画します。 高度なカスタマイズ : 流動性ラインの色、厚さ、スタイルを調整可能です。 動的な色変更 : 流動性レベルが突破された時にラインの色を変更するオプションがあります。 調整可能なZigZagパラメータ : より正確な検出のために、ZigZagの深さ、偏差、バックステップを調整できます。 Liquidity Zone Detectorは、市場の構造を分析し、重要な価格変動が発生する可能性のあるゾーンを特定
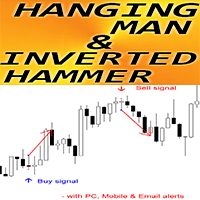
MT4 用 Forex インジケーター「ハンギングマンと逆ハンマーパターン」
インジケーター「ハンギングマンと逆ハンマーパターン」は、プライスアクション取引に非常に強力なインジケーターです。再描画なし、遅延なし。 インジケーターは、チャート上で強気の逆ハンマーと弱気のハンギングマンパターンを検出します。 強気の逆ハンマー - チャート上の青い矢印信号 (画像を参照) 弱気のハンギングマン - チャート上の赤い矢印信号 (画像を参照) PC、モバイル、および電子メールアラートが含まれています インジケーター「ハンギングマンと逆ハンマーパターン」は、サポート/レジスタンスレベルと組み合わせるのに最適です
// より優れたエキスパートアドバイザーとインジケーターは、こちらで入手できます: https://www.mql5.com/en/users/def1380/seller これは、この MQL5 ウェブサイトでのみ提供されるオリジナル製品です
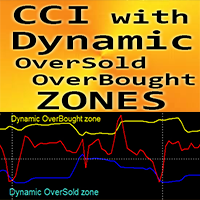
MT4 用 Forex インジケーター「ダイナミック売られ過ぎ/買われ過ぎゾーン付き CCI」。
コモディティ チャネル インデックス (CCI) は、トレンド方向へのモメンタム トレーディングに最適です。 ダイナミック買われ過ぎゾーンから売りエントリーを取り、ダイナミック売られ過ぎゾーンからメイン トレンドの方向に買いエントリーを取るのに最適です。 このインジケーターは、プライス アクション エントリーと組み合わせるのにも最適です。 ダイナミック買われ過ぎゾーン - 黄色の線の上 ダイナミック売られ過ぎゾーン - 青い線の下 CCI オシレーターは、現在の価格と過去の平均価格の差を測定します。
// より優れたエキスパート アドバイザーとインジケーターは、こちらで入手できます: https://www.mql5.com/en/users/def1380/seller これは、この MQL5 Web サイトでのみ提供されるオリジナル製品です。
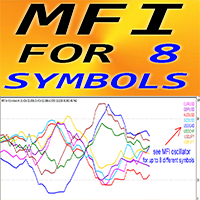
MT4 用 Forex インジケーター「MFI for 8 Symbols」。
マネーフローインデックス (MFI) は、価格とボリュームデータを使用して売られすぎと買われすぎのゾーンを識別するテクニカルオシレーターです。 MFI が 80 を超える場合は買われすぎから売りエントリーし、20 を下回る場合は売られすぎから買いエントリーするのに最適です。 MFI はダイバージェンス検出に非常に役立ち、プライスアクションと組み合わせるのも最適です。 「MFI for 8 Symbols」を使用すると、1 つのチャートで最大 8 つの異なるシンボルの MFI 値を制御できます。 MFI オシレーターは、強気と弱気の価格モメンタムに関する情報を提供します。
// より優れたエキスパートアドバイザーとインジケーターは、 https://www.mql5.com/en/users/def1380/seller で入手できます。 これは、この MQL5 Web サイトでのみ提供されるオリジナル製品です。
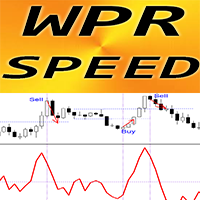
MT4 用 Forex インジケーター「WPR SPEED」 - 優れた予測ツール!
このインジケーターの計算は、物理学の方程式に基づいています。WPR SPEED は、WPR オシレーター自体の 1 次導関数です WPR SPEED は、横ばいおよびフラットな市場でのスキャルピング エントリに適しています WPR SPEED インジケーターは、WPR 自体が方向を変える速度を示します - 非常に敏感です モメンタム スキャルピング トレーディング戦略には、WPR SPEED インジケーターの使用をお勧めします: インジケーターの大きなピークを見つけます - 反対方向にスキャルピング トレードを開始します (画像のように) インジケーターには、モバイルおよび PC アラートが組み込まれています
// より優れたエキスパート アドバイザーとインジケーターは、こちらで入手できます: https://www.mql5.com/en/users/def1380/seller これは、この MQL5 Web サイトでのみ提供されるオリジナル製品です。
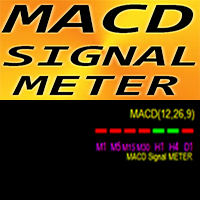
MT4 用 Forex インジケーター MACD シグナル メーター
非常に便利な MACD シグナル メーター インジケーターは、7 つのタイム フレームの現在の MACD 値 (シグナルの上/下) を同時に表示します 緑のボックス - MACD はシグナルの上 赤のボックス - MACD はシグナルの下 Forex インジケーター MACD シグナル メーターは、マルチ タイム フレーム取引の取引エントリ フィルターとして使用できます
// より優れたエキスパート アドバイザーとインジケーターは、こちらで入手できます: https://www.mql5.com/en/users/def1380/seller これは、この MQL5 Web サイトでのみ提供されるオリジナル製品です。
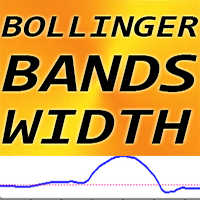
MT4 用 Forex インジケーター Bollinger Bands 幅、再描画なし。
-BB 幅インジケーターは、標準の Bollinger Bands インジケーターと一緒に使用できます。 -このソフトウェアは、Bollinger Bands インジケーター ファンにとって必須です。組み合わせると、ブレイクアウトの取引に非常に効率的だからです。 -BB 幅インジケーターは、Bollinger Bands 間の距離 (スパン) を示します。
BB 幅の使用方法 (画像の例を参照): 1) 過去 6 か月間の BB 幅の最低値を見つけ、この値に 25% を加算して LEVEL を取得します。 2) BB 幅インジケーターに LEVEL を添付します。また、Bollinger Bands インジケーターをチャートに添付します。 3)価格がボリンジャーバンドインジケーターの境界線の間で横ばいになり、BB幅の値がレベルを下回るまで待ちます 4)ボリンジャーバンドインジケーターの境界線を抜けてブレイクアウトする場所(ローソク足はバンドの外側で閉じるはずです)、BB幅を確認します。レ
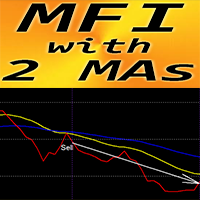
MT4 向け Forex インジケーター「MFI と 2 つの移動平均線」
マネーフローインデックス (MFI) は、価格とボリュームデータを使用して売られすぎと買われすぎのゾーンを識別するテクニカルオシレーターです 「MFI と 2 つの移動平均線」インジケーターを使用すると、MFI オシレーターの高速移動平均線と低速移動平均線を表示できます インジケーターを使用すると、トレンドの変化を非常に早い段階で確認することができます このインジケーターは、パラメーターを使用して簡単に設定でき、どの時間枠でも使用できます 画像で買いと売りのエントリー条件を確認できます 買い (売り) シグナル条件: (1)-高速 MA が低速 MA を上向き (下向き) に横切る、(2)-赤い MFI ラインが高速 MA の上 (下) にある、(3)-赤いラインが黄色のラインに接近する、 (4)-赤いラインが黄色のラインから上向き (下向き) に反発する、(5)-買い (売り) フックがちょうど形成された - ここでトレードを開始する、(6)-重要: MA の後の最初のフックのみを使用するクロス
/
Triple SD Osc (Triple synthetic digital oscillator) is a tool that allows you to combine into one whole the readings of three popular indicators simultaneously for a comprehensive analysis of price behavior. The user can select three different oscillators from the list of classic oscillators built into the MT4 trading platform and configure each of them separately. The indicator combines the values of user-selected oscillators and builds a synthetic oscillator based on them. To cut off false s
The Period Breakout Indicator is a versatile tool designed for traders seeking to identify breakout opportunities based on customizable time periods. This indicator automatically determines the highest and lowest prices within a user-defined period, allowing you to tailor it precisely to your trading strategy. Key Features: Customizable Time Periods: Define the start and end times based on your preferred trading hours or any specific period. The indicator will then calculate the highest and low
FREE

A Full Concept of BUY/SELL Scalping Strategy Trend detection is one of the basic challenges of every trader. Finding a way to tell when to enter a trade is very important, timing is a game changer, not too early and not too late. Sometimes, due to not knowing the market conditions, the trader closes his positions with a small profit or allows the losses to grow, these are the mistakes that novice traders make. Indicator Trend Whipper is a complete trading strategy and can improve the trader's tr

!!!The free version works only on "EURUSD"!!! WaPreviousCandleLevels MT4 shows the previous candle levels, it shows the previous candle Open High Low Close levels (OHLC Levels) in different time frame. It's designed to help the trader to analyse the market and pay attention to the previous candle levels in different time frame. We all know that the OHLC Levels in Monthly, Weekly and Daily are really strong and must of the time, the price strongly reacts at those levels. In the technical analys
FREE
Author's implementation of the classic technical analysis indicator Heiken Ashi. This indicator makes it easier to identify a trend and is the basis of many strategies. At its core, the Heiken Ashi (HA) indicator is just a way to construct a price candlestick chart. In the classic version of the indicator, the opening point of the HA candle is the average value between the opening and closing prices of the previous HA candle, and the closing point of the HA candle is the average value between th

Divergence Divergence refers to when the price of a currency pair moves in one direction while the trend indicator is moving in the opposite direction. With divergence, there can be positive and negative signals. Divergences in Forex trading are quite common signals of technical analysis. These are basic early Forex signals indicating the trend reversal and filter false signals. Application of this indicator It is usually not easy to detect divergences by the trader and it may be time-consuming

he "Super Trampoline" is an innovative trading indicator designed to simplify decision-making in financial markets. It analyzes chart data and provides clear and timely signals on when to buy or sell an asset, based on a proven strategy of candlestick pattern analysis. Product Advantages: Intuitive Interface : "Super Trampoline" integrates directly into your trading terminal, displaying signals as simple arrows on the chart. This means you don't need deep technical analysis knowledge to start us

Introducing "Super Transplant with Filter" — a game-changing tool for traders who value precision, reliability, and simplicity. This indicator combines advanced trend analysis techniques with intelligent signal filtering, allowing you to make decisions based on the most relevant data. Benefits of "Super Transplant with Filter": Accuracy in Every Trade : The indicator meticulously analyzes market data, identifying key trends while filtering out false signals. This enables you to make more informe
MACD Indicator The Moving Average Convergence and Divergence (MACD) is a trend following momentum indicator which shows the relationship between two moving averages that we chose and configure them on the indicator. The MACD is calculated by subtracting the 26-period exponential moving average and the 12 period D.A.M. These are the default parameters when you put the MACD indicator on the charts, and the period is usually 9 which means the last 9 candles. DT-Oscillator This is Robert C. Miner's

WaPreviousCandleLevels MT4 shows the previous candle levels, it shows the previous candle Open High Low Close levels (OHLC Levels) in different time frame. It's designed to help the trader to analyse the market and pay attention to the previous candle levels in different time frame. We all know that the OHLC Levels in Monthly, Weekly and Daily are really strong and must of the time, the price strongly reacts at those levels. In the technical analysis, the user can use them as a support and res
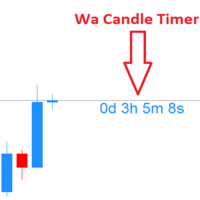
Wa Candle Timer MT4 is an indicator which shows the user how much time is remaining until the next candle will form. When it remains less than 5% before the current candle will be closed, the color of the time changed. These are the settings: 1- Color of Candle Timer when it remains MORE than 5% percentage of current bar to be closed. 2- Color of Candle Timer when it remains LESS than 5% percentage of current bar to be closed. 3- Candle Timer Font Size. 4- Candle Timer font (e.g.: "Arial").
FREE
Scalping Strategy BUY SELL
Having a strategy in the market is one of the main conditions for trading. The presence of various and complicated indicators and tools sometimes makes trading difficult, and the user gets confused after trying various methods and gets stuck in a loss cycle, the result of which is usually clear. This indicator is a simple strategy based on the detection of pivots and short-term trends, which helps you to easily trade in trends. Sometimes a simple but efficient st

The indicator monitors price movements in relation to a dynamic trailing stop line derived from the Average True Range (ATR). The trailing stop line adjusts based on market volatility, with the ATR determining the distance of the stop from the current price. This allows the stop to widen during periods of high volatility and tighten during calmer market conditions. The indicator tracks how the price interacts with this trailing stop line, marking potential reversal points when the price crosses
FREE

The indicator defines the buy and sell arrows with high performance and consistent results. Suitable for trend trading or following the trend. Automatic analysis of market opportunities ; Help traders earn more from their investments;
Never repaints, recalculates or backpaints signals; This is FREE demo version of the indicator and works only on "GBP USD M5" . The demo version does not work on SUFFIX OR PREFIX brokers ! Forex Trend Commander All details about the indicator here :
FREE

This indicator/dashboard , is place on a single symbol. It shows the percentage of movement withing all time frames from M1 to W1.The text will change green if all % are in the positive for a buy signal.The text will change red if all % are below zero and in negative for a sell signal. There are audible notifications, as well as on screen notifications along with push notifications that can be turned on and ON/OFF in the settings.
This is a sure way to Find trends quickly and efficiently, with
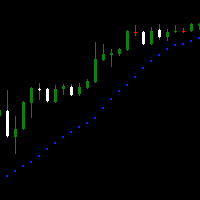
Доброго времени суток.
Вашему вниманию простой, но крайне удобный продукт для любителей индикатора Parabolic SAR . Он представляет собой окно осциллятора, на который выводится несколько тайм-фреймов в режими реального времени вместе с индикатором.
Настройки интуитивно понятные, что бы включать и отключать количество выбранных таймов - необходимо применять PERIOD_CURRENT, в таком случае дополнительный тайм не откроется.
Пишите в комментариях к продукту, что бы вы хотели увидеть в новых вер
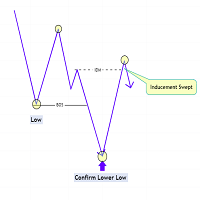
The Market Structure with Inducements & Sweeps indicator is a unique take on Smart Money Concepts related market structure labels that aims to give traders a more precise interpretation considering various factors.
Compared to traditional market structure scripts that include Change of Character (CHoCH) & Break of Structures (BOS) -- this script also includes the detection of Inducements (IDM) & Sweeps which are major components of determining other structures labeled on the chart.
SMC &
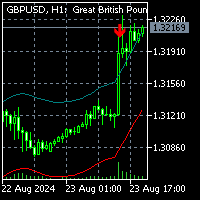
To get access to MT5 version click here . This is the exact conversion from "Nadaraya-Watson Envelope" by " LuxAlgo ". (with non-repaint input option) This is not a light-load processing indicator if repaint input is set to true . All input options are available. Buffers are available for processing in EAs. I changed default input setup to non-repaint mode for better performance required for mql market validation procedure . Here is the source code of a simple Expert Advisor operating

MT4 is a Histogram version of MT5: https://www.mql5.com/en/market/product/122151 Introducing Trade Sniper: Your Edge in the Markets. Tired of missing profitable trades or getting caught on the wrong side of the market? Meet Trade Sniper, the cutting-edge indicator that harnesses the power of trends to give you a razor-sharp advantage in your trading. Trend Sniper is not just another run-of-the-mill indicator. It's a sophisticated tool that combines advanced algorithms with time-tested trading

Session Standard Deviation Date Range Analyzer: Evaluate the standard deviation of each bar's price (high, low, close, open, weighted, median, and typical) within defined trading sessions and date ranges, providing detailed insights into price volatility and market behavior. **Note:** When the trading platform is closed, the indicator may not load correctly. To ensure it works, you may need to load the indicator, unload it, and then load it again. **Note:** This indicator can only be used with
FREE
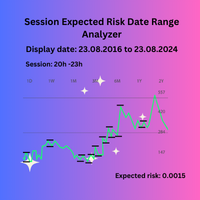
Session Expected Risk Date Range Analyzer: Analyzes price data across specified date ranges to provide detailed insights into financial risk and volatility, using each bar's price metrics for accurate risk assessment.
The Session Expected Risk Date Range Analyzer is a sophisticated tool designed to offer traders and analysts detailed insights into the expected financial risk across specific date ranges. Unlike traditional session-based analysis, this indicator focuses on calculating risk met
FREE
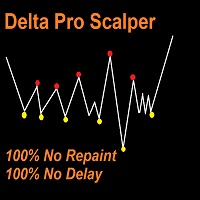
Delta Pro Scalper - Your Ultimate Trend Trading Solution, Delta Pro Scalper is a TREND indicator that automatically analyzes the market and provides information about the trend without redrawing or delay.
The indicator uses candlestick OHLC data and analyzing them to determine up trend or down trend, You MUST wait till closing candle, once the dot appear the next open candle you can open buy or sell position. Red Dot = Bearish Trend (Open SELL)
Yellow Dot = Bullish Trend (Open BUY) Here's th

Выпадающее меню для трендовых линий и прямоугольника. Позволяет редактировать цвет, стиль и толщину. При выделении линии появляется меню, каждая функция разделена. Можно сразу нажать и поменять на нужное. Толщина меняется по другому, нужно нажать на цифру, она станет в синем цвете, нажать нужную цифру от 1 до 4, в зависимости от нужной толщины, нажать интер.

MACDは、最も人気のある勢いとトレンドの指標の1つです。 通貨強度メーターは、複数の通貨に基づくトレンドインジケーターでもあります。 MACD通貨強度メーターは、MACDと通貨強度メーターのアルゴリズムを備えた1つのチャートインジケーターです。 また、ダッシュボードに28のメジャーペアとマイナーペアが表示されるワンクリック機能があり、特定のペアをクリックすると、チャートが自動的に選択したチャートに変わります。
製品の利点 インジケーターの使用方法に関する記録されたウェビナー 資金管理、入場、TPおよび出口戦略のための完全なシステム 入力パラメータ MACD設定-高速および低速のEMA値を入力します。デフォルト値は12,26,9です 折れ線グラフの種類、ダッシュボード、市場動向 表示設定-フォント通貨の色、信号の色、線の色、X軸とY軸のオブジェクトの配置 コンピューター、電子メール、チャートアラート

Indicator Waiting Volatility - an indicator for determining volatility zones and flat conditions.
Over time, the price on the chart is in different trends, goes down, goes up, or stays the same. The indicator helps the trader determine which trend the price is in.
In its work, it uses several tools for technical analysis; first, the direction of the trend is determined, then, in this direction, the indicator monitors changes in volatility.
If the price fluctuates within the noise, it is in tr

SENSEは、厳選されたGANN手法とフラクタル計算を組み合わせた自動システムです。このシステムは、どこで取引を開始し、どこで決済するかを教えてくれます。もう複雑な計算に時間を費やす必要はありません。インジケータをインストールするだけです。
基本原則:
価格が白い線の上にある時、市場は強気である。
白い線の上で買い、下で止める 緑線は上値目標 白い線より下にあるときは弱気。
白い線より下で売り、上で止める。 赤線は下値目標 緑または赤の線が二重になっている場合は、強いエリアであることを示す。
なぜSENSEなのか?
利益目標 SENSEは自動的に利益確定のターゲットを設定し、取引の成功を最大化するお手伝いをします。 自動適応: このインディケータは、どのような時間枠に対しても自動的に再計算を行い、手動で調整する必要なく、正確で信頼性の高いシグナルを提供します。
スキャルピングにも最適です。
デモをチェック

トレンドトレーディングの力をマスター
このインジケーターは、初心者、中級者、そしてプロのトレーダー向けに設計されています。どの通貨ペアでも、正確に実際のトレンドを特定することで、トレーディングプロセスを簡素化します。
なぜこのインジケーターを選ぶべきなのか?
- 簡単なトレード: もはや複雑な分析は必要ありません。インジケーターをチャートにロードし、買いまたは売りのシグナルを待つだけで、1日中チャートに貼り付く必要がありません。 - 明確なエントリーシグナル: インジケーターは正確なエントリーポイントを提供し、買いシグナルには青い矢印、売りシグナルには赤オレンジの矢印が表示されます。さらに、トレンドラインは市場の現在のトレンドを確認するために色が変わります。 - 理想的なタイムフレーム: 最良の結果を得るには、5分足のタイムフレームを使用することをお勧めします。H1のタイムフレームで再度インジケーターを適用してシグナルを確認することで、より正確なデータを得ることができます。 - スキャナーと組み合わせるとさらに強力: 内蔵スキャナーを使用して、すべての通貨ペアのトレンドを
Follow Line インジケーターは、マーケットのトレンドを正確に把握し、フォローするための重要なツールです。このインジケーターは、価格変動に動的に適応し、価格の動きを滑らかかつ継続的に追跡するラインを描きます。その視覚的なシンプルさとトレンド変化を示唆する効果的な機能により、Follow Line はすべてのトレーダーの戦略にとって素晴らしい追加ツールです。 主な特徴: トレンド追跡: Follow Line は価格を厳密に追跡し、トレーダーが現在の市場トレンドを簡単に特定できるようにします。 視覚的なシンプルさ: 明確でよく定義されたラインにより、初心者のトレーダーでも市場の方向をすばやく理解することができます。 適応性: さまざまなタイムフレームやインストゥルメントで機能し、デイトレードからスイングトレードまで、さまざまなトレード戦略に最適です。 使用方法: インストール: 分析したい金融商品のチャートに Follow Line インジケーターを追加します。 設定: トレード戦略に合わせてインジケーターのパラメーターを調整します。 トレンド分析: Follow Line のラ
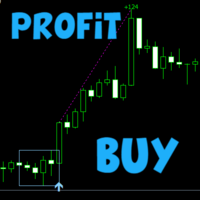
Scalper Box MT4
Fully ready strategy for trading on all markets (Stocks, Futures, Forex and Cryptocurrencies).
Indicator signals are not repaint!!!
Discounted price - 50$ (2 copies only) The next price is 99$
How to trade?
Wait for a signal from the indicator Scalper Box MT4 (blue arrow - buy, red arrow - sell).
After the signal we immediately enter the market, SL set behind the formed box.
Using trend filter indicator and template
Recommended timeframe:
M5 - Ideal for Sca
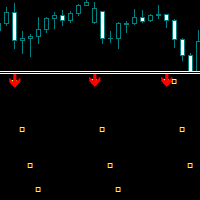
A technical indicator designed specifically for scalping, which can determine volatility impulses and show their duration.
It has flexible parameters for manual adjustment, allowing you to apply the indicator functionality to any trading instrument.
Recommended time frames for use are M5, M15, M30, H1 and H4.
There are several types of alerts.
All signals never change or repaint at the close of the candle.
The indicator is configured by parameters from top to bottom.
Trend Length - Spec

Bomb Bank シグナル: MetaTrader 4 の信頼度インジケーター
Bomb Bank Signal は、金融市場で最も関連性の高いトレンドを特定するように設計された MetaTrader 4 の強力なインジケーターです。動きを正確に予測するツールをお探しなら、Bomb Bank が最適です。
仕組み:
このインジケーターは、出来高分析、ローソク足終値、対称トレンドという 3 つの異なる方法を組み合わせて、売買の機会を検出してシグナルを送ります。 Bomb Bank は、買いの機会を特定するときは「爆弾」のようなものであり、売りシグナルを検出するときは「ドクロ」のようなものです。
ボムバンクはなぜ違うのですか?
完全な信頼性: Bomb Bank Signal は信号を削除しません。一度シグナルが発せられると、シグナルは残り続けるので、チャンスを逃すことはありません。 極めて高い精度: Bomb Bank は誤った信号を送信しません。リアルタイムで最新情報を更新し、市場の進化に合わせて調整しながら、以前のシグナルの透明性を維持します。 ライブアップデ

This indicator is not a guarantee of profitability but is designed to provide valuable insights and reduce the time spent analyzing charts, allowing you to focus on what matters most—your time.
The "Candle Info" indicator is designed to analyze and display specific candle formations directly on the chart within MetaTrader 4 (MT4). The indicator provides traders with visual cues about market sentiment by identifying various candle formations, such as Higher Highs, Lower Lows, Higher Lows, and
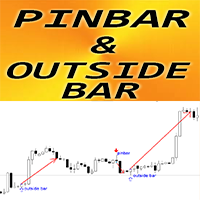
MT4用FXインジケーター「ピンバー&アウトサイドバーパターン」
インジケーター「ピンバーとアウトサイドバーパターン」はプライスアクション取引に非常に強力です インジケーターはチャート上のピンバーとアウトサイドバーのパターンを検出します。 強気パターン - チャート上の青い矢印シグナル (写真を参照) 弱気パターン - チャート上の赤い矢印シグナル (写真を参照) 再塗装は不要です。 遅延はありません。 PC、モバイル、電子メールによるアラート インジケーター「ピンバーとアウトサイドバーパターン」は、サポート/レジスタンスレベルと組み合わせるのに最適です
// さらに優れたエキスパートアドバイザーとインジケーターはここから入手できます: https://www.mql5.com/en/users/def1380/seller 当MQL5サイトのみでご提供しているオリジナル商品です。
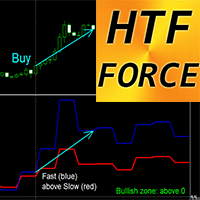
MT4 用 Forex インジケーター HTF Force Oscillator
HTF Force は、マルチタイム フレーム取引用の強力なインジケーターです。HTF は、Higher Time Frame を意味します。Force インデックスは、価格とボリュームのデータを 1 つの値に組み合わせるトップ インジケーターの 1 つです。 High タイム フレームの値は、トレンドの方向を示します (下降トレンド - 0 未満、上昇トレンド - 0 超)。 Fast Force - 青線、Slow Force - 赤線 買いシグナル - Fast ラインが Slow ラインを上向きに交差し、両方とも 0 超 (画像を参照) 売りシグナル - Fast ラインが Slow ラインを下向きに交差し、両方とも 0 未満 (画像を参照) インジケーターには、モバイルおよび PC アラートが組み込まれています。
// より優れたエキスパート アドバイザーとインジケーターは、こちらで入手できます: https://www.mql5.com/en/users/def1380/seller
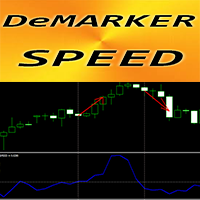
MT4 用 Forex インジケーター「DeMarker Speed」
このインジケーターの計算は、物理学の方程式に基づいています。DeMarker Speed は、DeMarker 自体の 1 次導関数です。 DeMarker オシレーター カーブは、インジケーターの計算期間中の以前の高値と安値に対する現在の価格位置を示します。 DeMarker Speed は、標準 DeMarker オシレーターが売られ過ぎ/買われ過ぎゾーンにある場合 (画像のように) のスキャルピング エントリに適しています。 DeMarker Speed インジケーターは、DeMarker 自体が方向を変える速度を示します。非常に敏感です。 DeMarker Speed インジケーターの値が < 0 の場合: 速度は負です。DeMarker Speed インジケーターの値が > 0 の場合: 速度は正です。 インジケーターには、モバイルおよび PC アラートが組み込まれています。
// より優れたエキスパート アドバイザーとインジケーターは、こちらで入手できます: https://www.mql5.
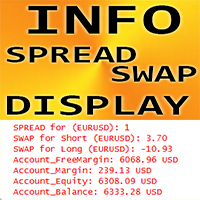
MT4 用外国為替インジケーター「INFO スプレッド スワップ ディスプレイ」、取引サポート ツール。
INFO スプレッド スワップ ディスプレイ インジケーターは、それが添付されている外国為替ペアの現在のスプレッドとスワップを表示します。 また、口座残高、エクイティ、マージンも表示します。 インジケーターの値はチャートのどのコーナーにも配置できます。 0 - 左上コーナー、1 - 右上、2 - 左下、3 - 右下 色とフォント サイズも設定できます。
// より優れたエキスパート アドバイザーとインジケーターは、こちらで入手できます: https://www.mql5.com/en/users/def1380/seller これは、この MQL5 ウェブサイトでのみ提供されるオリジナル製品です。
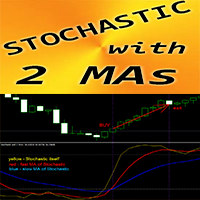
MT4用外国為替インジケーター「確率的および2つの移動平均」
確率的オシレーターは市場で最高のインジケーターの 1 つであり、多くのトレーダーにとって完璧なツールです。 「確率的および 2 移動平均」インジケーターを使用すると、確率的オシレーターの高速移動平均と低速移動平均を確認できます。 買われすぎゾーン - 80 以上。売られすぎ 1 - 20 未満 80 ゾーンを超えるゾーンから売りエントリーを取得し、20 ゾーン未満から買いエントリーを取得するのは素晴らしいことです。 写真で売買エントリー条件を確認できます。 買い(売り)シグナル条件を考慮してください。 (1) - 売られ過ぎ(買われ過ぎ)で速いMAが遅いMAを上向き(下向き)にクロスする: 買い(売り)取引を開始する (2) - 確率的値が買われ過ぎゾーンにあり、MA を下向きに高速で交差します (売られ過ぎゾーンでは MA を上向きに高速で交差します): 買い (売り) トレードからの終了
// さらに優れたエキスパートアドバイザーとインジケーターはここから入手できます: https://www.mql5.com

MT4用外国為替インジケーター「サポートレジスタンスレベル」
インジケーター「サポートレジスタンスレベル」はトレードに非常に役立つ補助インジケーターです 「サポート」と「レジスタンス」は価格によって考慮されるチャート上の重要なゾーンです サポートレベルとは、価格が定期的に下落を止めて反発するレベルです。 レジスタンスレベルとは、通常、価格の上昇が止まり、再び下落する場所です。 インジケーター「サポート抵抗レベル」は、最近のレベルを示します。 抵抗レベル - 赤い線。 サポートレベル - 青い線 計算に使用するバーの数、線の種類、色は設定で調整できます インジケーター「サポートレジスタンスレベル」は、価格アクションパターンによるテイクプロフィットターゲット、価格反転、再テストを計画するのに最適です。
// さらに優れたエキスパートアドバイザーとインジケーターはここから入手できます: https://www.mql5.com/en/users/def1380/seller 当MQL5サイトのみでご提供しているオリジナル商品です。

YOU CAN NOW DOWNLOAD FREE VERSIONS OF OUR PAID INDICATORS . IT'S OUR WAY OF GIVING BACK TO THE COMMUNITY ! >>> GO HERE TO DOWNLOAD
V1 Scalper is an easy to use tool designed for trend scalping. It tries to spot good entry points in a major trend by using swing high and lows formed along the trend . This tool can be used on Fx Pairs , Indices , Commodities and stocks. Not often but in some signals , the arrow might repaint on the current candle so extra confirmation tools are advised for t
FREE
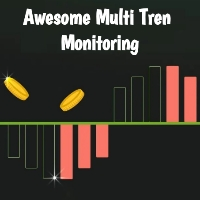
This indicator was created based on a multi-time trend monitoring system by combining several trend signals into 1 signal in the panel. This indicator is also equipped with an alert feature. Try to master how to reveal Fibo Weasel Candle Break Reetes to make it easier to use this indicator. for entry we only monitor the signal in the top left corner for the ongoing trend as a trading reference For the risk reward reference, we use the Fibo Weasel withdrawal reference which is in the same direct
FREE

Platone Breakout SMC - Advanced Trading Indicator Overview The Platone Breakout SMC is an innovative and powerful MetaTrader 4 (MT4) indicator designed for traders who seek to capitalize on smart money concepts (SMC) and breakout trading strategies. This indicator provides precision in identifying breakout levels, session times, and profit targets, ensuring that traders can execute well-informed trades with confidence. Trading Logic The core of the Platone Breakout SMC is its ability to identif
FREE
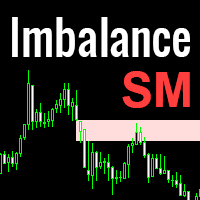
Imbalance is one of the important zones on the chart, to which the price will always strive to cover it. It is from the imbalance zone that the market most often makes significant reversals, rollbacks and gives entry points that you can successfully trade. In the Smart Money concept, the imbalance zone is used to find an entry point, as well as a place for take profit at the level of imbalance overlap by the price. Until the imbalance is overlapped, it is the closest target for the price. Ho
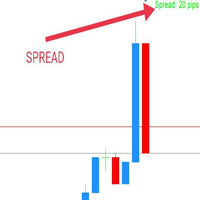
WaSpread MT4 Indicator shows the current spread in pips with color.
* Set the Spread Threshold and the color to identify when the current spread is below or above the Spread Threshold.
* Set X axis and Y axis and chose the Corner and the Anchor to position the Spread Label on the chart.
* Write the font and the font size for more confort.
* Activate alert if the current spread is above the spread threshold.
* For more precision, the user can choose to show the decimal numbers.
* The
FREE
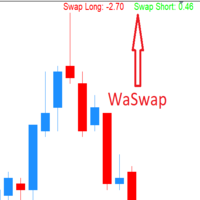
WaSwap MT4 Indicator shows the current Swap Long and current Swap Short with color.
* Set the Swap Threshold and the color to identify when the current swap is below or above the Spread Threshold.
* Set X axis and Y axis and chose the Corner and the Anchor to position the Swap Label on the chart.
* Write the font and the font size for more confort.
* Activate alert if the current Swap Long or the current Swap Short is below the swap threshold.
* The user will never swing with a negati
FREE
This indicator is designed for effective short-term trading and the most aggressive reinvestment of potential profits into new positions. The philosophy of its use involves entering based on the indicator signal and fixing profit/loss as quickly as possible when receiving an opposite indicator signal on an even shorter time period of the chart.
Thus, the algorithm for effectively using the presented indicator is as follows: 1. Wait for a buy/sell signal to appear. The signal appears at the mom

Aristotle Market Profile SMC Indicator: Overview: The Aristotle Market Profile SMC Indicator, is a comprehensive and highly customizable tool designed for traders seeking to integrate Market Profile analysis into their trading strategies. This advanced indicator is built to display the Market Profile across various trading sessions, including intraday, daily, weekly, and monthly periods, offering deep insights into market behavior and price levels over different timeframes. Key Features: Multip
FREE

This indicator works on MT4 and is very easy to use. When you receive a signal from it, you wait for that candle with the signal to close and you enter your trade at the beginning of the next new candle . A red arrow means sell and a green arrow means buy. All arrows comes with Alert like for easy identification of trade signal. Are you okay with that?
1 minute candle
1 minute expire

Adjustable Consecutive Fractals looks for 2 or more fractals in one direction and sends out a on screen alert, sound alert and push notification, for strong reversal points .
Adjustable Consecutive Fractals, shows the fractals on chart along with a color changing text for buy and sell signals when one or more fractals appear on one side of price.
Adjustable Consecutive Fractals is based Bill Williams Fractals . The standard Bill Williams fractals are set at a non adjustable 5 bars, BUT withe

The Binary Profit Maker,
This indicator works on MT4 and is very easy to use. When you receive a signal from it, you wait for that candle with the signal to close and you enter your trade at the beginning of the next new candle . A Up Purple arrow means Buy and a Down Purple arrow means Sell. All arrows comes with Alert like for easy identification of trade signal. Are you okay with that?
How To Enter Trade?
1 minute candle
1 minute expire

Average Session Range MT4: Calculate and Average the Sessions High-Low Range of Specific Time Sessions Over Multiple Days. The Session Average Range is a sophisticated and precise tool designed to calculate the volatility of specific time sessions within the trading day. By meticulously analyzing the range between the high and low prices of a defined trading session over multiple days, this tool provides traders with a clear and actionable average range. **Note:** When the trading platform is cl
FREE
123456789101112131415161718192021222324252627282930313233343536373839404142434445464748495051525354555657585960616263646566676869707172737475767778798081828384858687888990919293949596979899100101102103104105106107108109110111112113114115116117118119120121122123124125126127128129130131132133134135136137138139140
MetaTraderマーケットは、他に類のない自動売買ロボットやテクニカル指標の販売場所です。
MQL5.community ユーザーメモを読んで、取引シグナルのコピー、フリーランサーによるカスタムアプリの開発、支払いシステムを経由した自動支払い、MQL5Cloud Networkなど、当社がトレーダーに対して提供するユニークなサービスについて詳しくご覧ください。
取引の機会を逃しています。
- 無料取引アプリ
- 8千を超えるシグナルをコピー
- 金融ニュースで金融マーケットを探索
新規登録
ログイン