YouTubeにあるマーケットチュートリアルビデオをご覧ください
ロボットや指標を購入する
仮想ホスティングで
EAを実行
EAを実行
ロボットや指標を購入前にテストする
マーケットで収入を得る
販売のためにプロダクトをプレゼンテーションする方法
MetaTrader 4のための新しいテクニカル指標 - 6

Use GANN 369 to use a combination of 30's,60's,90's time to cross 3's,6's,9's. Any larger combination of these cross smaller combinations of these
Using GANN 369 Method for Trading Reversals The GANN 369 method, inspired by the works of W.D. Gann and Nikola Tesla's 3, 6, 9 numerical patterns, can be employed to identify potential reversals in financial markets. By combining specific periods (30, 60, and 90) with the numbers 3, 6, and 9, traders can seek opportunities for trend changes.

30% DISCOUNT ! DISCOUNT ! DISCOUNT ONLY FOR 5 USERS at125$ valid for 1 day only.Grab it The PERFECT TREND HIT creates BUY and SELL perfect trend arrow signals based on ADX EMA AND RSI And all filters inbuilt with accurate trend entries. Furthermore, the indicator and template display the trend direction, strength, and trade recommendation for independent price charts. ROCK WITH THE TREND Moreover, it shows the final trade recommendation to BUY or SELL with all filters and displays that info

You can visually backtest Elliot Wave Impulse to see how it behaved in the past!
Manual guide: Click here Starting price of $59 for the first 25 copies ( 1 left)! -- Next price is $120 .
This indicator is unstoppable when combined with our other indicator called Katana . After purchase, send us a message and you could get it for FREE as a BONUS! The Elliot Wave Impulse is a pattern identified in the Elliott Wave Theory, a form of technical analysis used to a

この取引ツールを使用すると、15の市場を同時にスキャンできます。
新しい取引インジケーター2024のご紹介:
️ダッシュボード マルチ通貨 マルチタイムフレーム ダブルCCI。
この取引ツールを作成した理由は少なくとも2つあります。
まず、1つの市場だけを観察することに飽き飽きしています。
次に、別の市場でのエントリーの瞬間を失いたくないのです。
そのため、同時に他の市場の状況を知りたいのです。
このため、複数の市場の状況を同時にスキャンできるスキャナーが必要です。
私は、高速CCIライン> (または<=) 低速CCIラインがM1からH4 (またはM1からM30のみ) から始まる市場をよく探します。
私の分析に同意するなら、これはあなたが探していた取引インジケーターです。
市場の状況が上記の要件を満たす瞬間を逃さないでください。
これは、多くの優れた機能を備えたストキャスティクスのスキャナーまたはダッシュボードです。
高速 CCI ラインのデータを表示できます 低速 CCI ラインのデータを表示できます 高速 CCI ラインと低速 C
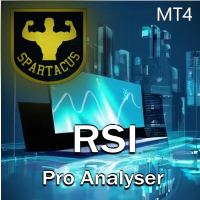
RSI Pro Analyzer インジケーターは、複数の時間枠にわたって同時に情報に基づいた意思決定を行いたいトレーダー向けに設計された強力なツールです。 このインジケーターは RSI を使用して買われすぎ、売られすぎ、トレンドのシグナルを提供し、市場参入の機会を特定しやすくします。 その主な利点は、さまざまな市場状況を示す明確で明確なカラーコードのおかげで読みやすいことです。
このインジケーターは RSI 値と関連シグナルを 5 つの異なる時間枠 (D、H4、H1、M30、M15) で表示するため、トレーダーは包括的な市場の視点を取得し、複数の時間軸で情報に基づいた意思決定を行うことができます。
色の変化を使用して、さまざまな時間枠にわたる傾向と反転の可能性を特定します。 買われすぎ領域と売られすぎ領域を探して、逆トレンドまたはトレンド反転の取引機会を見つけます。
赤: RSI は下降傾向を示します。
緑: RSI は上昇傾向を示します。
濃い赤: RSI は売られ過ぎ領域を示します。
濃い緑色: RSI は買われ過ぎゾーンを示します。
また、ポップアップ

volatility level indicator is a volatility oscillator to see trend reversal points. price trends has reverese when volatility inreased . this indicator show trend reversal points volatility. mostly same level up and down volatility is reversal points. red colour shows up points of volatilty.and probably trend will down. blue colour oscillator shows deep point of price when increased volatiliyty. on pictures horizontal lines on oscillator has drawed by hand.to see the before level and compare now
スマート ボリューム トラッカーは、専用ウィンドウに買値と売値のデータを視覚的に表示することで、市場センチメントに関する洞察を提供するように設計されたインジケーターです。 この直感的なツールは、トレーダーが売買活動が集中している場所を素早く特定するのに役立ち、より多くの情報に基づいた取引上の意思決定を可能にします。
Smart Volume Tracker を使用すると、市場が強気トレンドに傾いているか弱気トレンドに傾いているかを簡単に判断できます。 これは買値と売値のクラスターを示しており、緑色は買い活動を、赤色は売り活動を表しています。 この色分けされた視覚化により、現在の市場の雰囲気を簡単に判断できるため、トレンドや潜在的な転換点を特定するのに役立ちます。
クラスタリング パターンを観察することで、効果的な取引に重要な主要なサポート レベルとレジスタンス レベルを特定できます。 独立したインジケーター ウィンドウによりメイン チャートが明確に保たれるため、市場のダイナミクスに関する貴重な洞察を得ると同時に、取引戦略に集中することができます。
スマート ボリューム ト

There is No use in the Testing Demo. You will understand nothing from running flashing numbers. It is a Dashboard. Just try to understand idea, get it and I will help in everything further. Symbols must be separated by commas (,) and entered into the parameters exactly as displayed by your broker to ensure they are recognized in the dashboard. These symbols will be used for analysis by the indicator.
With one click open any pair any timeframe directly from dashboard The MA Speedometer Dashboar

on free demo press zoom out button to see back.. cnt number is bar numbers.you can change up to 3000 related to chart bars numbers. minimum value is 500. there is g value set to 10000. no need to change it.
this indicator almost grail,no repaint and all pairs ,all timeframe indicator. there is red and blue histograms. if gold x sign comes on red histogram that is sell signal. if blue x sign comes on blue histogram that is buy signal. this indicator on thise version works all pairs.al timeframe

タイトル: BBMA 構造ガイド - BBMA 構造ガイド
説明: BBMA 構造ガイドは、BBMA 構造の進化をより簡単かつ効率的に理解するのに役立つ特別な MQL4 インジケーターです。BBMA、または「Bollinger Bands Moving Average」は、「一歩先を行く」というモットーで知られており、市場構造を深く理解することの重要性を強調しています。
BBMA 構造ガイドを使用すると、価格変動の基本的な市場構造パターンを迅速に識別できます。これにより、より正確かつ効果的な取引の決定が可能になります。このインジケーターは情報を明確で直感的に表示し、次の取引ステップをより自信を持って進むことができます。
主な特徴: - **深い理解:** BBMA 構造ガイドは、市場構造を明確に示し、市場のダイナミクスをより良く理解できます。 - **使いやすさ:** 直感的なインターフェイスで設計されており、すべての経験レベルのトレーダーが簡単に使用できます。 - **強力なシグナル:** このインジケーターは、**CSAK**(キャンドルスティックの強力な方向)や *
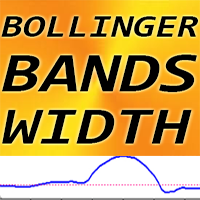
MT4の外国為替インジケーターのボリンジャーバンド幅、再ペイントなし。
-BB幅インジケーターは、標準のボリンジャーバンドインジケーターと併用することができます。 -ボリンジャーバンドインジケーターの組み合わせは非常に優れているため、このソフトウェアはすべてのボリンジャーバンドインジケーターファンにとって必須です。 ブレイクアウトをトレードするのに効率的 -BB幅インジケーターはボリンジャーバンド間の距離(スパン)を示します。
BB幅の使用方法(写真の例を参照): 1) 過去 6 か月の BB 幅の最小値を見つけ、この値に 25% を加算して LEVEL を取得します。 2) BB幅インジケーターにLEVELを取り付けます。 ボリンジャーバンドインジケーターもチャートに添付します。 3)価格がボリンジャーバンドインジケーターの境界線の間でフラットになり、BB幅の値がレベルを下回るまで待ちます。 4) ボリンジャーバンドインジケーターの境界を通過するブレイクアウトを待ちます(ローソク足はバンドの外側で閉じるはずです)、BB幅を確認してください - それはレベルより上である必要が
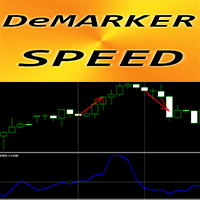
MT4用外国為替インジケーター「DeMarker Speed」
この指標の計算は物理学の方程式に基づいています。 DeMarker Speed は DeMarker 自体の 1 次派生です DeMarker オシレーター カーブは、インジケーター計算期間中の以前の高値および安値と比較した現在の価格の位置を示します。 DeMarker スピードは、標準の DeMarker オシレーターが売られ過ぎ/買われ過ぎゾーンにある場合にエントリーをスキャルピングするのに適しています (写真のように) DeMarker 速度インジケーターは、DeMarker 自体が方向を変える速度を示します - 非常に敏感です DeMarker 速度インジケーターの値が 0 未満の場合: 速度は負です。 DeMarker 速度インジケーターの値が > 0 の場合: 速度は正です インジケーターにはモバイルおよび PC アラートが組み込まれています
// さらに優れたエキスパートアドバイザーとインジケーターはここから入手できます: https://www.mql5.com/en/users/def1380/
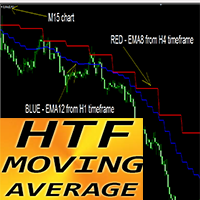
MT4の外国為替インジケーターHTF移動平均
MT4 用のプロフェッショナルな HTF MA インジケーターを使用して取引方法をアップグレードします。 HTF とは、より高い時間枠を意味します。 このインジケーターは、プライスアクションエントリーを持つトレンドトレーダーに最適です。 HTF MA インジケーターを使用すると、より高い時間枠からの移動平均を現在のチャートに添付できます。 インジケーターはより高い時間枠からの傾向を示します --> これは常に収益性の高い方法です。 HTF MA インジケーターは、低リスクで大きな利益を得る機会を与えます。
使い方: D1 から H4 または H1 チャートに MA を添付します H4 から H1、M30、または M15 のチャートに MA を添付します など(写真参照)
// さらに優れたエキスパートアドバイザーとインジケーターはここから入手できます: https://www.mql5.com/en/users/def1380/seller // また、収益性が高く、安定していて信頼性の高いシグナル https://www.m
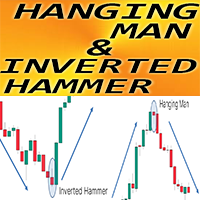
MT4用外国為替インジケーター「ぶら下がっている男と逆ハンマーパターン」
インジケーター「ハンギングマンと逆ハンマーパターン」は、プライスアクション取引にとって非常に強力なインジケーターです。再描画や遅延はありません。 インジケーターは、チャート上で強気の逆ハンマーパターンと弱気のハンギングマンパターンを検出します。 強気の逆ハンマー - チャート上の青い矢印シグナル (写真を参照) 弱気のハンギングマン - チャート上の赤い矢印シグナル (写真を参照) PC、モバイル、電子メールのアラートが含まれています インジケーター「ハンギングマンと逆ハンマーパターン」は、サポート/レジスタンスレベルと組み合わせるのに最適です: https://www.mql5.com/en/market/product/100903
// さらに優れたエキスパートアドバイザーとインジケーターはここから入手できます: https://www.mql5.com/en/users/def1380/seller // また、収益性が高く、安定していて信頼性の高いシグナル https://www.mql5.c

MT4用外国為替インジケーターHTF MACDオシレーター
HTF とは、より高い時間枠を意味します。 MACD インジケーター自体は、トレンド取引で最も人気のあるインジケーターの 1 つです。 このインジケーターは、プライスアクションエントリーまたは他のインジケーターと組み合わせたマルチタイムフレーム取引システムに最適です。 HTF MACD インジケーターを使用すると、より高い時間枠から現在のチャートに MACD を添付できます --> これはプロの取引アプローチです インジケーターにはモバイルおよび PC アラートが組み込まれています
// さらに優れたエキスパートアドバイザーとインジケーターはここから入手できます: https://www.mql5.com/en/users/def1380/seller // また、収益性が高く、安定していて信頼性の高いシグナル https://www.mql5.com/en/signals/1887493 に参加することも歓迎します。 当MQL5サイトのみで販売しているオリジナル商品です。
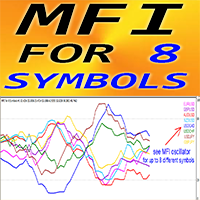
MT4用FXインジケーター「MFI for 8 Symbols」。
マネー フロー インデックス (MFI) は、売られすぎゾーンと買われすぎゾーンを識別するために価格と出来高のデータを使用するテクニカル オシレーターです。 MFI が 80 を超えている場合は買われすぎから売りエントリーを取得し、20 を下回っている場合は売られすぎから買いエントリーを取得するのは素晴らしいことです。 MFIはダイバージェンス検出に非常に役立ち、プライスアクションと組み合わせるのも最適です。 「MFI for 8 Symbols」は、1 つのチャート上で最大 8 つの異なるシンボルの MFI 値を制御する機会を与えます。 MFI オシレーターは、強気および弱気の価格の勢いに関する情報を提供します
// さらに優れたエキスパートアドバイザーとインジケーターはここから入手できます: https://www.mql5.com/en/users/def1380/seller // また、収益性が高く、安定していて信頼性の高いシグナル https://www.mql5.com/en/signals/1
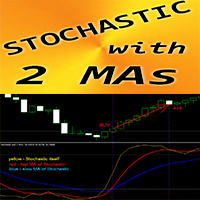
MT4用外国為替インジケーター「確率的および2つの移動平均」
確率的オシレーターは市場で最高のインジケーターの 1 つであり、多くのトレーダーにとって完璧なツールです。 「確率的および 2 移動平均」インジケーターを使用すると、確率的オシレーターの高速移動平均と低速移動平均を確認できます。 買われすぎゾーン - 80 以上。 売られすぎ 1 - 20 未満 80 ゾーンを超えるゾーンから売りエントリーを取得し、20 ゾーン未満から買いエントリーを取得するのは素晴らしいことです。 写真で売買エントリー条件を確認できます。 買い(売り)シグナル条件を考慮してください。 (1) - 売られ過ぎ(買われ過ぎ)で速いMAが遅いMAを上向き(下向き)にクロスする: 買い(売り)取引を開始する (2) - 確率的値が買われ過ぎゾーンにあり、MA を下向きに高速で交差します (売られ過ぎゾーンでは MA を上向きに高速で交差します): 買い (売り) トレードからの終了
// さらに優れたエキスパートアドバイザーとインジケーターはここから入手できます: https://www.mql5.co

The Tripl indicator is designed to visually display the current trend in the market. One of the key aspects of currency market analysis is identifying a trend, which is a stable direction in which prices are moving. For this purpose, the Tripl indicator uses calculations that smooth out sharp fluctuations that do not have a significant impact on the overall trend of price movements.
A trend can be either upward (bullish) or downward (bearish). Most often, a trend develops for a long time befo

In a departure from the conventional approach, traders can leverage the bearish engulfing candlestick pattern as a buy signal for short-term mean reversion trades. Here's how this alternative strategy unfolds: The bearish engulfing pattern, (typically signaling a reversal of bullish momentum) , is interpreted differently in this context. Instead of viewing it as a precursor to further downward movement, we perceive it as an indication of a potential short-term bounce or mean reversion in prices.
FREE

This trading system is based on mathematical probability. In this case, 5 consecutive candles are compared with each other. For a logical comparison, consider these 5 candles as 1 candle on the M5 timeframe. Therefore, the comparison begins with the opening of a candle on the M5 timeframe. The probability of a match is 50% in the 1st candle, 25% in the 2nd candle, 12.5% in the 3rd candle, 6.25% in the 4th candle, 3.125% in the 5th candle. Thus, the 5th candle has a probability of matching in 1

About Waddah Multimeter (free): This product is based on the WAExplosion Indicator. It helps identify explosive market trends and potential trading opportunities. Waddah Multi-meter (Multi-timeframe) Check out the detailed product post here for scanner and multimeter both: https://www.mql5.com/en/blogs/post/758020
Please note that scanner is paid and multimeter is free.
Features: Waddah Trend Direction Trend Strength (above/below explosion line or deadzone) Trend Explosion Alert Alignment al
FREE

Waddah Explosion Scanner Features : - Waddah Trend, Explosion Increase/Decrease
- Trend Percentage with Threshold
- DeadZone
- Trend Direction Aligned Checks
- Highlight and Alerts
- Multi-Timeframe & Multi-Currency
Check out the blog post for more info: https://www.mql5.com/en/blogs/post/758020
Customizable Threshold: With customizable threshold, you can identify best trading opportunities in volume-based trading. Use Trend Height (x times Explosion) : Trend height in relat

With the growth of information technology and the increasing number of participants in financial markets, traditional analysis tools are becoming less effective. Conventional technical indicators, such as the moving average or stochastic, in their pure form are unable to accurately determine the direction of the trend or its reversal. Is it possible to find an indicator that remains effective for 14 years without changing its parameters, and at the same time adapts to market changes? Yes, such
Please feel free to contact me if you need any further information.
Please let me know if you have any questions.
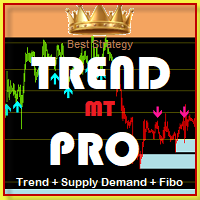
I hope the above is useful to you. MT Trend Pro: "Trade according to the trend and you will be a winner." There is Supply&Demand and Fibo to help set SL and TP. indicator for trade by yourself
TRADE: Forex
TIME FRAME: All Time Frame (Not M1)
SYMBOL PAIR: All Symbol
SETTINGS:
SIGNAL FOLLOW TREND: Input period (>1)
CANDLE MA FILTER TREND: Set MA to change the can

Auto Multi Channels VT Ещё один технический индикатор в помощь трейдеру. Данный индикатор, автоматически показывает, наклонные каналы в восходящем,
нисходящем и боковом движении цены, т.е. тренды. (Внутри дня. Среднесрочные и долгосрочные, а также Восходящие, нисходящие и боковые).
О понятии Тренд. На бирже, трендом называется направленное движение ценового графика в одну из сторон (вверх или вниз) . То есть, тренд в трейдинге — это ситуация,
когда цена определенное время возрастает или

Safe Trade Indicator MT4
The Safe Trade indicator is an analytical and technical tool that has different features and very accurate signals. This indicator can be used in various markets such as the stock market and the forex market. It states and also provides buy and sell signals.
Features of the Safe Trade indicator
Receiving signals as notifications on the Metatrader mobile application. Receive signals by email. Receiving signals in the form of warning messages or alarms on Metatrader.

Unveil the Secret to Trading with Joker's TrendMaster!
Ready to outperform the markets with a proven and reliable strategy? Look no further! Introducing Joker's TrendMaster, the revolutionary indicator crafted by Yuri Congia! With Joker's TrendMaster, you'll gain access to a powerful combination of advanced technical analysis and unique strategic insights.
Limited-time Special Opportunity: Seize the moment! Be among the first 10 (Purchasing 1/10) to seize this unique opportunity, and not
FREE

MACD is probably one of the most popular technical indicators out there. When the market is trending, it actually does a pretty good job, but when the market starts consolidating and moving sideways, the MACD performs not so well. SX Impulse MACD for MT5 is available here . Impulse MACD is a modified version of MACD that works very well for trading Forex, stocks, and cryptocurrencies. It has its own unique feature which perfectly filters out the values in a moving average range and enables it t

Introducing the “Symbol Cost Info MT4” indicator – your ultimate tool for staying ahead in the forex market! This innovative indicator is designed to empower traders with real-time cost information, directly on their charts. Here’s why every trader needs the “Symbol Cost Info MT4” in their arsenal: Real-Time Spread Monitoring : Keep a close eye on the spread for any currency pair, ensuring you enter the market at the most cost-effective times. Pip Value at Your Fingertips : Instantly know t
FREE

Precision Pivot Points Yuri Congia Description: Precision Pivot Points is a sophisticated indicator designed to identify potential market reversal points with accuracy and precision. Utilizing advanced algorithms, this indicator automatically calculates key support and resistance levels based on pivot point analysis. Pivot points are essential tools used by traders worldwide to make informed trading decisions and optimize their trading strategies. Join me in the exciting world of financial trad
FREE

Yuri Congia Market Info Indicator
Description: The Yuri Congia Market Info Indicator is a tool for traders, providing a wide range of key data directly on the chart. Developed by Yuri Congia, this indicator offers detailed information on the current price, spread, daily highs and lows, remaining time before candle close, and more. It's an essential tool for traders who want immediate access to crucial information during their trading operations. Join me in the exciting world of financial trad
FREE

TrendExpert Indicator Overview
The TrendExpert indicator is designed to identify and visualize trend zones in financial markets. It utilizes zigzag high and low points to determine support and resistance levels, providing insights into potential market reversals and continuation patterns.
Features - Detection of support and resistance zones based on price action. - Strength categorization (Proven, Verified, Untested, Turncoat, Weak) based on historical testing. - Adjustable parameters fo
FREE

The indicator show Higher timeframe candles for ICT technical analisys Higher time frames reduce the 'noise' inherent in lower time frames, providing a clearer, more accurate picture of the market's movements.
By examining higher time frames, you can better identify trends, reversals, and key areas of support and resistance.
The Higher Time Frame Candles indicator overlays higher time frame data directly onto your current chart.
You can easily specify the higher time frame candles yo

TrendWave Oscillator is an advanced MT4 oscillator that not only identifies the trend direction but also provides visual and audio alerts to enhance trading strategies.
Key Features: - Color-coded trend indication: - Blue : Indicates an uptrend, signaling potential price growth. - Orange : Indicates a downtrend, suggesting possible price decline. - Gray : Represents a flat market or lack of clear entry signals.
- Graphical signals on the chart : - Aqua : Highlights an uptrend, empha

Elevate your trading game with TigerSignals – the ultimate MetaTrader 4 indicator. Designed for simplicity and precision, TigerSignals provides crystal-clear buy and sell signals, making it a must-have for traders of all levels.
Features: User-Friendly: Easy-to-use interface ensures hassle-free integration into your trading strategy. Alerts: Sound, phone, and email alerts. Receive notifications when a new signal appears, giving you the freedom to step away from the chart! Lot Size Calcula

Introducing the Ultimate Horizontal Line Alert Indicator for MT4! Transform your trading with the smartest tool in the market. Our Horizontal Line Alert Indicator isn't just any indicator — it's your new trading partner that combines precision, flexibility, and intuitive control. What Does It Do? This revolutionary MT4 indicator automatically adjusts trend lines to be horizontal with just the press of the 'L' key. It’s perfect for traders who want to focus on specific price levels, ensu
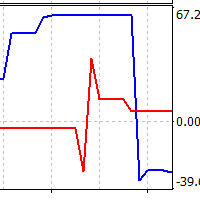
Two lines are being drawn in a separate window. And both are representing an angle of a trendline. One trendline is measured going across two price highs, but the other is measured across two lows. You get to choose the period from which the first price high and first price low is being determined. The second high and low comes from identical time period preceding the first one. Feel free to experiment with the period count until you get the confirmation you are looking for.

Biggest V.7 update for Break and Retest since the official release!
️ V.7 UPDATE includes the following:
Multi Symbol Screener Panel where you can automatically add any symbol you want. Each symbol is clickable to automatically switch between them!
Multi Timeframe Screener Panel where you can automatically scan all the timeframes for the selected symbols! Timeframe Screener is clickable for on/off!
This means that you can open only 1 chart and let the indicator scan for sig

この取引ツールを使用すると、15 の市場を同時にスキャンできます。
新しい取引指標 2024 のご紹介:
️ ダッシュボード マルチ通貨 マルチタイムフレーム 確率的。
私がこの取引ツールを作成した理由は少なくとも 2 つあります。
まず、1 つの市場だけを観察することに飽きました。 次に、別の市場への参入の瞬間を逃したくないです。
だからこそ、他の市況も同時に知りたいのです。
このため、複数の市場の状況を同時にスキャンできるスキャナーが必要です。
私は確率的メインライン > (または <=) 確率的シグナルラインが M1 から H4 (または単に M1 から M30) で始まる市場をよく探します。
私の分析に同意するなら、これがあなたが探していた取引指標です。
市況が上記の要件を満たす瞬間を見逃さないでください。
これは、多くの優れた機能を備えたストキャスティックのスキャナーまたはダッシュボードです。
確率的メインラインのデータを表示可能 確率シグナルラインのデータを表示可能 確率的メインラインとシグナルラインの位置を表示可能(シグナル

革新的なメタトレーダーテーマビルダーで取引チャートに命を吹き込みましょう!
テーマビルダーを使えば、あなたのスタイルや好みに合った取引環境を作ることができます。使いやすいインターフェースとメタトレーダーとの完全な統合により、チャートのルック&フィールを完全にコントロールすることができます / MT5無料版
特徴 完全カスタマイズ: ローソク足の色やチャートの背景を簡単に変更し、独自の取引スタイルを反映させることができます。ソフトでプロフェッショナルな色調から、鮮やかで大胆な色まで、可能性は無限です。 無限の創造性: 様々な色の組み合わせやスタイルを試して、あなたの個性や好みに合った完璧な外観を見つけましょう! 使いやすさ: 当社のツールは、初心者トレーダーでも直感的に使いやすいように設計されています。数回クリックするだけで、チャートを完全にカスタマイズし、全く新しいルック&フィールを与えることができます。 取引体験の向上: 視覚的に魅力的な取引環境は、見て楽しいだけでなく、金融市場の取引中の集中力を高めます。
使用方法 以下のビデオをご覧ください。
FREE
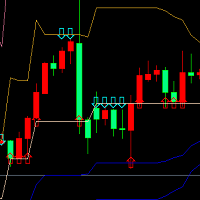
本指標は金分割理論に基づいて、過去22(デフォルト)本のK線の高低価格をそれぞれ取得し、金分割係数計算により支持、圧力曲線を算出する。 価格が初めて圧力線に近づいたり、圧力線に何度も近づいたりすると、下向きの矢印が一致し、圧力があることを示し、空セルを作るのに適しています。 価格が初めて下向きに支持線に近づいたり、何度も支持線に近づいたりすると、上向きの矢印が一致し、支持があり、多buyに適していることを示したり、 データウィンドウでは、各支持、圧力線の価格値が提示され、出現した矢印の符合値は値up、downである。
この指標は、掛けられたグラフの中で短い線を作るのに適しています。つまり、入場して倉庫を開けた後、何本かのK線柱を持って、それから倉庫を平らにすることができます。多くすると、止損は支持線の下にあり、圧力線の近くに止まることができます。空にすると、止損は圧力線の上で、支持線の近くで止められます。
本指標に係る金分割係数はそれぞれ0.382、0.618、1.618、2.168、4.236であり、対応する支持圧力線を算出した。 MT 4の指標数は限られているため、本指標
This indicator informs the user when the ATR is above a certain value defined by the user, as well as when the ATR prints a percentage increase or percentage decrease in its value, in order to offer the user information about the occurrence of spikes or drops in volatility which can be widely used within volatility-based trading systems or, especially, in Recovery Zone or Grid Hedge systems. Furthermore, as the volatility aspect is extremely determining for the success rate of any system based o
これは無料の製品ですので、ニーズに合わせてご使用ください。
また、肯定的なフィードバックをいただき大変感謝しております。 どうもありがとう!
// さらに優れたエキスパートアドバイザーとインジケーターはここから入手できます: https://www.mql5.com/en/users/def1380/seller // また、収益性が高く、安定していて信頼性の高いシグナル https://www.mql5.com/en/signals/1887493 に参加することも歓迎します。
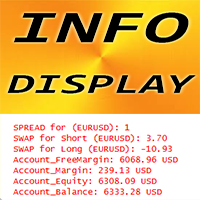
MT4用FXインジケーター「INFOディスプレイ」、取引支援ツール。
INFO ディスプレイインジケーターは、それが接続されている外国為替ペアの現在のスプレッドとスワップを示します。 また、口座残高、資本、証拠金も表示されます。 チャートのどの隅でもインジケーター値を見つけることができます。 0 - 左上隅、1 - 右上、2 - 左下、3 - 右下 色や文字サイズなども設定可能
当MQL5サイトのみで販売しているオリジナル商品です。
FREE
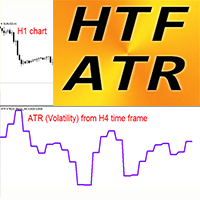
MT4用外国為替ボラティリティインジケーターHTF ATR
平均トゥルーレンジ自体はトレーダーにとって最も重要な指標の 1 つであり、市場のボラティリティを示します。 HTF ATR は、テクニカル分析で使用される市場ボラティリティ指標です。 HTF とは、より高い時間枠を意味します。 ATR は、動的なテイクプロフィット/SL の場所を計画するのに最適です。 たとえば、最適な SL 値は 1.2 ~ 2.5 の ATR 値にあります。 このインジケーターは、あらゆる取引システムに追加できる便利なツールです。 HTF ATR インジケーターを使用すると、より高い時間枠から現在のチャートに ATR を添付できます --> これはプロの取引アプローチです
// さらに優れたエキスパートアドバイザーとインジケーターはここから入手できます: https://www.mql5.com/en/users/def1380/seller // また、収益性が高く、安定していて信頼性の高いシグナル https://www.mql5.com/en/signals/1887493 に参加することも

MT4用外国為替インジケーター「MA Speed」、リペイントなし。
移動平均の速度 - 独自のトレンド指標です この指標の計算は物理学の方程式に基づいています。 速度は移動平均の一次導関数です MA 速度インジケーターは、MA 自体が方向を変える速度を示します。 MA スピードを使用すると、標準的な戦略でもアップグレードする機会がたくさんあります。 SMA、EMA、SMMA、LWMA に適しています インジケーターの値が 0 未満の場合、トレンド戦略では MA スピードを使用することをお勧めします。トレンドは下降します。 インジケーターの値が > 0 の場合: トレンドは上昇します 期間 - 任意。 取引ペア - 任意 インジケーターにはモバイルおよび PC アラートが組み込まれています。
パラメータ (設定は非常に簡単です): 1) 速度の期間。 推奨値は 3 ~ 7 です。Period of Speed が低いとインジケーターの感度が上がり、その逆も同様です。 2) MA の期間 (この MA の速度が計算されます) 3) MA メソッド: SMA、EMA、SMMA、L
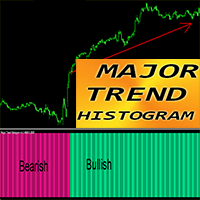
MT4用FXインジケーター「メジャートレンドヒストグラム」
本当に大きなトレンドを捉えるように設計されたメジャー トレンド ヒストグラム インジケーター インジケーターは 2 色で表示できます: 弱気トレンドの場合は DeepPink、強気トレンドの場合は SpringGreen (色は変更可能) 初期段階でトレンドを検出します。標準的な MA クロスよりもはるかに効率的です。 メジャー トレンド ヒストグラムは、プライス アクション、VSA、その他の指標など、他の取引方法と組み合わせることができます。 インジケーターにはモバイルおよび PC アラートが組み込まれています
// さらに優れたエキスパートアドバイザーとインジケーターはここから入手できます: https://www.mql5.com/en/users/def1380/seller // また、収益性が高く、安定していて信頼性の高いシグナル https://www.mql5.com/en/signals/1887493 に参加することも歓迎します。 当MQL5サイトのみでご提供しているオリジナル商品です。
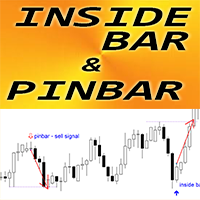
MT4用外国為替インジケーター「インサイドバー&ピンバーパターン」
インジケーター「インサイドバー&ピンバーパターン」はプライスアクション取引に非常に強力です インジケーターはチャート上のインサイドバーとピンバーパターンを検出します。 強気パターン - チャート上の青い矢印シグナル (写真を参照) 弱気パターン - チャート上の赤い矢印シグナル (写真を参照) 再塗装は不要です。 遅延はありません。 インサイドバー自体のR/R比(報酬/リスク)が高い PC、モバイル、電子メールによるアラート インジケーター「インサイドバー&ピンバーパターン」はサポート/レジスタンスレベルと組み合わせるのに最適です: https://www.mql5.com/en/market/product/100903
// さらに優れたエキスパートアドバイザーとインジケーターはここから入手できます: https://www.mql5.com/en/users/def1380/seller // また、収益性が高く、安定していて信頼性の高いシグナル https://www.mql5.com/en/sign
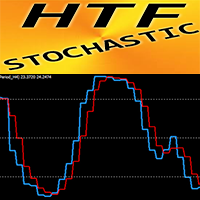
MT4の外国為替インジケーターHTFストキャスティクス
確率的オシレーターは市場で最高のインジケーターの 1 つであり、多くのトレーダーにとって完璧なツールです。 HTF とは、より高い時間枠を意味します。 買われすぎゾーン - 80 以上。 売られすぎ 1 - 20 未満 HTF 確率的インジケーターは、特にプライスアクションエントリーを伴うマルチタイムフレーム取引システムに優れています。 このインジケーターを使用すると、より高い時間枠から現在のチャートにストキャスティクスを接続できます --> これはプロの取引アプローチです インジケーターにはモバイルおよび PC アラートが組み込まれています HTF 確率オシレーターは、通常の発散検出にも使用できます。
// さらに優れたエキスパートアドバイザーとインジケーターはここから入手できます: https://www.mql5.com/en/users/def1380/seller // また、収益性が高く、安定していて信頼性の高いシグナル https://www.mql5.com/en/signals/1887493 に参加す
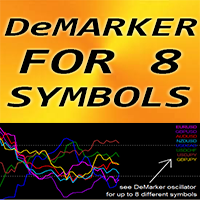
MT4用外国為替インジケーター「DeMarker for 8 Symbols」、リペイントなし
DeMarker オシレーター カーブは、インジケーター計算期間中の以前の高値および安値と比較した現在の価格の位置を示します。 DeMarker は、他のオシレーターの中で最も効率的な規則的な発散信号を提供します。 買われすぎゾーン (0.7 以上) で定期的に発散する売りエントリーと、売られすぎゾーン (0.3 以下) で定期的に発散する買いエントリーを取得するのは素晴らしいことです。 「8 シンボルの DeMarker」は、1 つのチャート上で最大 8 つの異なるシンボルの DeMarker 値を制御する機会を提供します。 このインジケーターは、売られすぎ/買われすぎエリアからの価格アクションのエントリーと組み合わせるのにも優れています。
// さらに優れたエキスパートアドバイザーとインジケーターはここから入手できます: https://www.mql5.com/en/users/def1380/seller // また、収益性が高く、安定していて信頼性の高いシグナル http
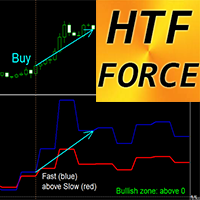
MT4用外国為替インジケーターHTFフォースオシレーター
HTF Forceは、マルチタイムフレーム取引のための強力なインジケーターです。 HTF とは、より高い時間枠を意味します。 フォースインデックスは、価格と出来高のデータを単一の値に結合する最上位の指標の 1 つです。 高時間枠の値はトレンドの方向を示すことができます (下降傾向 - 0 未満、上昇傾向 - 0 より上) ファストフォース - 青線、スローフォース - 赤線 買いシグナル - 速いラインが遅いラインを上向きにクロスし、両方 - 0 を上回ります (図を参照) 売りシグナル - 速いラインがクロスする 遅いラインが下向き、および両方 - 0 を下回る (図を参照) インジケーターにはモバイルおよび PC アラートが組み込まれています
// さらに優れたエキスパートアドバイザーとインジケーターはここから入手できます: https://www.mql5.com/en/users/def1380/seller // また、収益性が高く、安定していて信頼性の高いシグナル https://www.mql5.com/
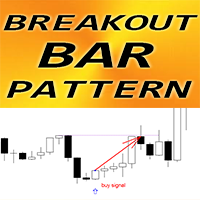
MT4用FXインジケーター「ブレイクアウトバーパターン」
インジケーター「ブレイクアウト バー パターン」は、プライス アクション取引にとって非常に強力なインジケーターです。再描画や遅延はありません。 インジケーターはチャート上のブレイクアウトバーパターンを検出します。 強気ブレイクアウトバーパターン - チャート上の青い矢印シグナル (写真を参照) 弱気ブレイクアウトバーパターン - チャート上の赤い矢印シグナル (写真を参照) PC、モバイル、電子メールによるアラート インジケーター「ブレイクアウトバーパターン」はサポート/レジスタンスレベルと組み合わせるのに最適です: https://www.mql5.com/en/market/product/100903
// さらに優れたエキスパートアドバイザーとインジケーターはここから入手できます: https://www.mql5.com/en/users/def1380/seller // また、収益性が高く、安定していて信頼性の高いシグナル https://www.mql5.com/en/signals/1887493 に

The "Trend Tandem" indicator is a trend analysis tool in financial markets that helps traders determine the direction of price movement.
Options:
RISK: Determines the level of risk taken into account in the trend analysis. The higher the value, the more aggressively volatility is taken into account. SSP (SSP Period): Defines the period of the moving average used to identify a trend. The higher the value, the smoother the trend signal will be. CountBars: Determines the number of bars on whic
This indicator informs the user when the ATR is above a certain value defined by the user, as well as when the ATR prints a percentage increase or percentage decrease in its value, in order to offer the user information about the occurrence of spikes or drops in volatility which can be widely used within volatility-based trading systems or, especially, in Recovery Zone or Grid Hedge systems. Furthermore, as the volatility aspect is extremely determining for the success rate of any system based o
FREE

The "Trend Api" indicator is an innovative tool for trend analysis in the Forex market. It has unique features and a wide range of settings that will help traders make informed decisions when trading.
This indicator is based on the analysis of the market trend and helps to identify the direction of price movement. It uses various mathematical algorithms and statistical methods to determine the strength and sustainability of a trend in the market.
One of the key features of the "Trend Api" i

缠中说禅在MT4的应用,该指标自动识别分型,划笔,划线段,显示笔中枢,线段中枢,也可以根据需求在参数中设置显示自己所需要的。 1.笔采用条件较为宽松的新笔。 2.当前分型与前面分型不能构成笔时,若与前面笔同向且创新高或新底时会延伸笔,若与前面笔异向且符合替换条件则去除倒数第一笔,直接倒数第二笔。 3.线段的终结第一类情况:缺口封闭,再次创新高或新底新低,则判为终结,同时破坏那一笔的右侧考虑特征序列包含。 4.线段终结的第二类情况,缺口未封闭,考虑后一段特征序列分型出现新的顶底分型,同时做了包含处理。 5.中枢显示笔中枢和段中枢可在参数选择 6.第一类买卖点两种方式可选,参数1为MACD动能柱面积,参数2为斜率

本指标是根据黄金分割理论,分别获取过去22(默认)根K线高低价,并通过黄金分割系数计算得出支撑、压力曲线。 当价格第一次向上靠近压力线,或者多次靠近压力线时,会出现向下的箭头符合,提示有压力,适宜做空sell; 当价格第一次向下靠近支撑线,或者多次靠近支撑线时,会出现向上的箭头符合,提示有支撑,适宜做多buy; 在数据窗口,会提示各条支撑、压力线的价格数值,出现的箭头符合数值为up、down。
这个指标,适合在所挂的图表里做短线,也即进场开仓后,持仓几根K线柱,然后可以平仓。做多的话,止损可以在支撑线下方,止盈在压力线附近。做空的话,止损可以在压力线上方,止盈在支撑线附近。
本指标涉及的黄金分割系数分别为0.382、0.618、1.618、2.168、4.236,计算得到对应的支撑压力线。 由于MT4的指标数量有限,本指标分成了2个EX4文件,第一个的黄金分割系数为0.382、0.618、1.618,第二个为2.168、4.236,第二个文件名为“Golden Ratio Support Pressure Indicator extend”,可免费下载和使用。
FREE

Indicador de Bandas de Fibonacci para Metatrader 4 . Este indicador funciona de forma similar a las conocidas Bandas de Bollinger clásicas, pero en lugar de usar la desviación estándar para trazar las bandas usa números de Fibonacci y el ATR (Average True Range). Puede usarse para trazar niveles de soporte y resistencia que pueden emplearse en sistemas de scalping de corto plazo y swing trading. Las bandas del indicador son calculadas de la siguiente forma: Línea central : Media móvil de n peri
FREE

The Breakout Line in technical analysis serves as a crucial tool for understanding market dynamics and potential shifts in price direction. It's designed to highlight rapid accelerations or declines in the market's trajectory. Unconventional Analysis : The Breakout Line is not your typical technical indicator; it's tailored to capture swift market movements, offering a unique perspective on price trends. Angle of the Breakout Line : The sharper the angle formed by the Breakout Line, the stro

Smart Mone Liquidity Zone
Overview : Smart Mone Liquidity Zone is a sophisticated MetaTrader 4 indicator meticulously crafted to illuminate crucial liquidity zones on price charts, amplifying traders' capacity to discern optimal trading opportunities. Engineered by Yuri Congia, this indicator empowers traders with profound insights into market dynamics, enabling astute decision-making within various timeframes.
Limited-time Special Opportunity:
Seize the moment! Be among the first 10 (Pu
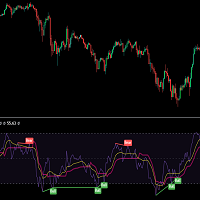
MOST is applied on this RSI moving average with an extra default option added VAR/VIDYA (Variable Index Dynamic Moving Average)
MOST added on RSI has a Moving Average of RSI and a trailing percent stop level of the Moving Average that can be adjusted by changing the length of the MA and %percent of the stop level.
BUY SIGNAL when the Moving Average Line crosses above the MOST Line
LONG CONDITION when the Moving Average is above the MOST
SELL SIGNAL when Moving Average Line crosses belo

MA Trend Following Indicator for MT4 is a simple technical analysis tool designed to follow the trend in any currency pair chosen by the trader by combining 3 moving averages on two different time frames, one long term and one short term.
It basically provides a bullish or bearish signal when the moving averages on one time frame align with the moving averages on a different time frame to have a confluence signal.
The indicator is presented as a screener with multiple currency pairs (that

This tool helps you to find easily and clearly when you enter trade with day time and price examples Entered Buy at Monday 20:30 with price 2150 Exited buy at Tues 10: 30 with price 2187 You can convert as local time by inputting shift hours and minutes.
Trading is a learning skill, so you have to evaluate your trading performance at the end of your day. Did you follow your rules? If you did then it was a win, regardless if you earned pips or not. If you didn't follow my rules then is a

MAXLUM SYSTEM is a Trading System that uses anti-Margin Call without using SL with a positive correlation Hedging Strategy
Simple example of BUY on EURUSD and SELL on GBPUSD at the same time This kind of trading will not occur as a Margin Call By calculating the GAP difference between the 2 pairs we can take advantage of the GAP
This indicator will be more effective if you use Data Analysis download excel file on telegram Group Please join the Maxlum System Telegram group for details t.me/m

Direct translation of blackcat's L3 Banker Fund Flow Trend Oscillator. Get push notifications on your phone app when a signal bar has formed. Historical signals are shown with buy/sell arrow right on the main chart. Indicator uses two data calculations to check for a cross below 25% level (a signal to go long) and above 75% level (a signal to short). For any further questions feel free to contact me directly. Including requests for product improvements.

精密な取引分析を指先で:次世代取引分析ソフトウェア 市場に出回っている一般的な取引分析ソフトウェアは、時間別または週別の損益率統計のみを提供することが多く、より正確な取引分析のニーズを満たしていません。しかし、実際の取引市場では、毎日が独自の状況を呈しています。月曜日は静かで、水曜日は3倍のオーバーナイト金利で活発になり、金曜日は重要なデータ発表で非常に活発になります。明らかに、毎日統計分析を行うことは科学的ではなく、週単位で分析する方が理にかなっています。しかし、週足チャートは各日の統計的な状況のみを示しており、時間ごとの変化を捉えることができません。さらに、特定の銘柄は、ロングポジションとショートポジションで大きな違いを示すため、個別の分析が必要ですが、これは現在の取引分析ソフトウェアには欠けています。
時間単位が粗すぎることに加えて、既存の取引分析ソフトウェアは、戦略のフィルタリングの点でも不足しています。銘柄名のみでフィルタリングを行うことは、1つの銘柄で複数の戦略が同時に実行されている可能性があるため、科学的ではありません。同様に、マジックナンバーのみを頼りにフィルタリ
FREE
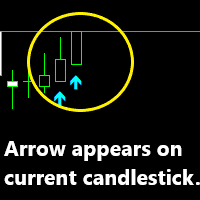
Advanced artificial intelligence indicator that is 100% non-repaint and appears on current candlestick. The indicator is based on arrows which serve as your entry points. Buy arrow is your buy signal and orange arrow are your sell signal as more arrows appear the stronger the trend and you can add more entries. The indicator works on all timeframe from the one-minute timeframe to the monthly timeframe. The AI Non-repaint indicator works on all forex pairs.

メタトレーダー用ボリュームプロファイルインジケーターで、ボリューム分析の威力を実感してください! / MT5バージョン
ベーシックボリュームプロファイルは、取引の最適化を目指すマニュアルトレーダーのために特別に設計されたインジケーターです。ボリューム・プロファイル・インジケータは、市場の動きをより深く理解したい本格的なトレーダーにとって不可欠なツールです。当社の革新的なソリューションにより、取引量が価格にどのように分布しているかを明確かつ簡潔に視覚化することができます。これにより、支持線・抵抗線、集積・分配ゾーン、重要なコントロール・ポイントなど、主要な注目エリアを特定することができます。特定の日の取引量を表示する通常の出来高インジケーターとは異なり、ベーシック・ボリューム・プロファイルは特定の価格における取引量を表示します。
当社のインジケータは、直感的でカスタマイズ可能なインターフェイスを備えており、お客様の取引の好みに合わせてカスタマイズすることができます。
特徴 価格チャート上に出来高プロフィールを明確に表示。 出来高の多いエリアと少ないエリアを素早く識別。 取引
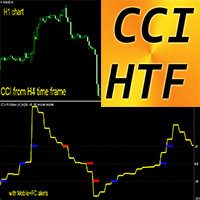
MT4用外国為替インジケーターCCI HTFオシレーター
MT4 用のプロフェッショナルな CCI HTF オシレーターで取引方法をアップグレードしてください。 HTF とは、より高い時間枠を意味します。 コモディティ チャネル インデックス (CCI) は、現在の価格と過去の平均価格の差を測定します。 重要なレベル: +/-200、+/-100 +200ゾーンより上の売りエントリーと-200以下のゾーンからの買いエントリーを取るのは素晴らしいことです このインジケーターは、プライスアクションエントリーまたは他のインジケーターと組み合わせたマルチタイムフレーム取引システムに最適です。 CCI HTF オシレーター インジケーターを使用すると、より高い時間枠から現在のチャートに CCI を接続できます。 インジケーターにはモバイルおよび PC アラートが組み込まれています
// さらに優れたエキスパートアドバイザーとインジケーターはここから入手できます: https://www.mql5.com/en/users/def1380/seller // また、収益性が高く、安定してい
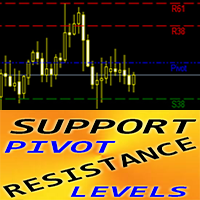
MT4用外国為替インジケーター「ピボットサポートレジスタンスレベル日週月」
インジケーター「Pivot SR Levels D_W_M」は、プライスアクション取引のための非常に強力な補助インジケーターです この特定のインジケーターは計算にフィボナッチ数を使用しています。 ピボット レベルは、前の取引期間の市場のパフォーマンスから重要な価格の平均として計算されます。 ピボットレベル自体は、市場全体の状況に応じて、最も高いレジスタンスまたはサポートのレベルを表します。 インジケーター「Pivot SR Levels D_W_M」は、価格によって到達できる最も可能性の高い反転レベルを示します。 R - レベル (赤) - 抵抗 S - レベル (緑) - サポート 日次、週次、月次の過去の取引期間は計算設定で利用可能です インジケーター「ピボットレベル D_W_M 」は、価格アクションパターンを介して利益確定目標や価格反転を計画するのに最適です。 インジケーターの使用方法: 1) インジケーターを対応するチャートに添付します 2) 必要な設定を選択し、OK ボタンを押します 3) イン
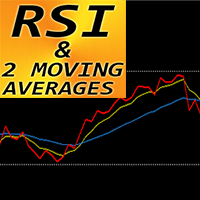
MT4用外国為替インジケーター「RSIと2つの移動平均」
このインジケーターは、モメンタム取引システムに最適です。 「RSI と 2 MA」インジケーターを使用すると、RSI 自体の高速移動平均と低速移動平均を確認できます。 インジケーターはトレンドの変化を非常に早い段階で確認する機会を与えます 「RSIと2つのMA」でトレンド方向への勢いを掴むことが可能 このインジケーターはパラメーターを使用して非常に簡単に設定できます (図を参照) インジケーターはどの時間枠でも使用できます
// さらに優れたエキスパートアドバイザーとインジケーターはここから入手できます: https://www.mql5.com/en/users/def1380/seller // また、収益性が高く、安定していて信頼できるシグナル https://www.mql5.com/en/signals/1887493 に参加することも歓迎します。 当MQL5サイトのみでご提供しているオリジナル商品です。
MetaTraderマーケットは自動売買ロボットとテクニカル指標を販売するための最もいい場所です。
魅力的なデザインと説明を備えたMetaTraderプラットフォーム用アプリを開発するだけでいいのです。マーケットでプロダクトをパブリッシュして何百万ものMetaTraderユーザーに提供する方法をご覧ください。
取引の機会を逃しています。
- 無料取引アプリ
- 8千を超えるシグナルをコピー
- 金融ニュースで金融マーケットを探索
新規登録
ログイン