YouTubeにあるマーケットチュートリアルビデオをご覧ください
ロボットや指標を購入する
仮想ホスティングで
EAを実行
EAを実行
ロボットや指標を購入前にテストする
マーケットで収入を得る
販売のためにプロダクトをプレゼンテーションする方法
MetaTrader 4のための新しいテクニカル指標 - 36

SX Price Action Patterns is a comprehensive indicator which shows various price action patterns on the chart for those who are interested in price action trading. These patterns are as follows: A Pin Bar is a candlestick price bar, which has a long wick on one side and a small body. It is a powerful signal of price reversal in a currency trading strategy. An Inside Bar is characterized by a bar or candle that is entirely ‘inside’ the range of the preceding one and represents the consolidation o
FREE

Introducing Real Cross System , the cutting-edge trading signal indicator designed to revolutionize your trading experience. Whether you are a seasoned trader or a newcomer to the financial markets, this powerful tool is engineered to provide accurate and timely signals, empowering you to make informed trading decisions with confidence. Features: Real-Time Signal Generation: Real Cross System utilizes advanced algorithms to generate real-time trading signals based on precise market analysis.

The Exact Arrow Entry Signal Indicator is a powerful tool designed to assist traders in making informed decisions in the financial markets. This advanced indicator leverages cutting-edge algorithms and technical analysis to identify potential entry points with high accuracy.
Features: 1. Precision Entry Points: The indicator generates precise arrow signals on the chart, highlighting potential entry points for various trading strategies.
2. Trend Identification: By analyzing price movements a

All Symbols AND All Time frames Scan
Document Introduction
A breakout refers to when the price of an asset moves above a resistance zone or moves below a support zone. A breakout indicates the potential for a price trend to break.Break provides a potential business opportunity. A break from the top signals to traders that it is better to take a buy position or close a sell position. A breakout from the bottom signals to traders that it is better to take sell positions or close their bu

Arbitrage MACD: Your Key to Analyzing Market Trends
The Arbitrage MACD is a cutting-edge indicator designed to assist traders and investors in analyzing market trends with greater precision and confidence. MACD, which stands for Moving Average Convergence Divergence, is a well-known and widely used tool in the financial world, and the "Arbitrage MACD" takes its functionality to the next level.
This innovative indicator offers a comprehensive analysis of the relationship between two moving ave

The " Arbitrage RSI " is a cutting-edge technical indicator designed to assist traders in making informed decisions in the financial markets. This powerful tool leverages the concept of Relative Strength Index (RSI) divergence to identify potential trading opportunities. To View Our Other Products Go to the link: Other Products
Features: RSI Divergence Detection: The Arbitrage RSI excels at identifying divergence patterns in the RSI indicator. By comparing the price action with the RSI move

ATR Channels Indicator Introducing the ATR Channels Indicator, a powerful tool designed to enhance your trading experience and provide valuable insights into market volatility. ATR, short for Average True Range, is a technical indicator that helps traders understand the overall price volatility of an asset or market. The ATR Channels Indicator takes the ATR calculations to the next level by plotting them as dynamic channels on your price chart. These channels represent the range within which pri

Introducing the Great Oscillator Trend Indicator – a powerful tool designed to enhance your trading strategies and improve your decision-making process.
The Great Oscillator Trend Indicator is a versatile technical analysis tool that helps you identify trends and potential reversals in the financial markets. It utilizes a combination of oscillators and moving averages to generate accurate and reliable signals.
With this indicator, you can easily spot overbought and oversold conditions, as w

1 of 10 for 69$
.
Next Price is 89$
SMC Unmitigated Finding is a indicator for find unmitigated supply and demand in previous legs of price
Settings Zigzag Settings ZZDepth - by Default is 12.
ZZDeviation - by Default is 5.
ZZBackStep - by Default is 3. Rectangle Settings SupportColor- color for Support line.
ResistanceColor - color for Resistance line.
Settings Num of Show - Number of Support & Resistance Show.

Gioteen Volatility Index (GVI) - your ultimate solution to overcoming market unpredictability and maximizing trading opportunities. This revolutionary indicator helps you in lowering your losing trades due to choppy market movements. The GVI is designed to measure market volatility, providing you with valuable insights to identify the most favorable trading prospects. Its intuitive interface consists of a dynamic red line representing the volatility index, accompanied by blue line that indicat
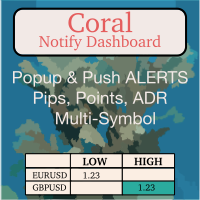
Coral Notify Dash allows you to manage all of your chart price-based notifications from a single consolidated dashboard. It fills a gap left by MT4, which does not support popup alerts. If you're like me and you often don't hear the alert sound for the built-in alerts, this is an indispensable tool. I use Coral Notify Dash as part of my daily chart analysis workflow. I use a tool like Coral Dash (available for free, here ) or one of the other dashboards to set my trading bias. As I review t

Introducing ICT Reaction Levels, a reliable indicator designed to plot key levels on your chart. Unlike classical support and resistance, these levels are derived from significant highs and lows observed on higher timeframes, such as the weekly and monthly periods. The indicator provides a valuable tool for traders seeking to identify critical price levels based on historical price reactions.
ICT Reaction Levels analyzes price action on the specified timeframe, using special inputs to determin

The FollowLine indicator is a trend following indicator. The blue/red lines are activated when the price closes above the upper Bollinger band or below the lower one.
Once the trigger of the trend direction is made, the FollowLine will be placed at High or Low (depending of the trend).
An ATR filter can be selected to place the line at a more distance level than the normal mode settled at candles Highs/Lows.
Some features: + Trend detech + Reversal signal + Alert teminar / mobile app

Title: Best Trend Sniper Indicator - A Custom MQL4 Indicator for Spotting Potential Trends Description: Indicator Name: Best Trend Sniper Indicator Introduction: The "Best Trend Sniper Indicator" is a custom Meta Quotes Language 4 (MQL4) indicator designed to identify potential trends in financial markets. This indicator is intended to be used on Meta Trader 4 (MT4) trading platforms. Key Features: Non Repaint: The Best Trend Sniper Indicator is a non-repaint indicator, which means it does not

ご紹介 クォンタム トレンド スナイパー インジケーターは 、トレンド反転を特定して取引する方法を変革する画期的な MQL5 インジケーターです。 13年以上の取引経験を持つ経験豊富なトレーダーのチームによって開発されました。 クォンタムトレンドスナイパーインジケーター は、非常に高い精度でトレンドの反転を識別する革新的な方法で、あなたのトレーディングの旅を新たな高みに押し上げるように設計されています。
***Quantum Trend Sniper Indicatorを購入すると、Quantum Breakout Indicatorを無料で入手できます!***
クォンタム ブレイクアウト インジケーターは、トレンドの反転を特定するとアラートを発し、矢印を示し、3 つのテイクプロフィットレベルを提案します。
初心者トレーダーにもプロのトレーダーにも適しています。
量子EAチャネル: ここをクリック
MT5のバージョン: ここをクリック
推奨事項:
期間: すべての時間枠。最良の結果を得るには、M15、M30、H1 のタイム

ZonePro Supply Demand は、新しいゾーン、テストされたゾーン、壊れたゾーン、古いゾーン、およびネストされたゾーンを最大 3 つの高いタイムフレームまで描画し、ゾーンがタッチされた場合、エントリーされた場合、または壊れた場合、または反転ローソク足がゾーンから離れた場合にアラートを送信します。 再塗装は不要です。
ゾーン情報:
ピップサイズ ゾーンがより高いタイムフレームにネストされている場合 ゾーンがテストされるかどうか、およびその回数は トレンドパネル (左上) :
時間を表示します 次のキャンドルまでの時間 全体的な傾向 短期的なトレンドの方向性 トレンドが始まってからの距離 壊れたゾーンの数 アラート ボタンをオンにすると、トレンドが変化したときにアラートを受け取ります!(アラート ボタンはアラート パネルでオンになっている必要があります!)
アラートパネル (右下):
ポップアップ、メール、プッシュ通知、 選択するゾーン アラート タイプ より高いタイムフレームがオンになっている場合、情報ラベルのオンとオフを切り替えることができます。 重要
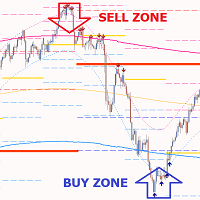
Gold PL MTF - これは優れた株式テクニカル指標です。指標アルゴリズムは、資産価格の動きを分析し、フィボナッチ法 (黄金比) を使用して、指定された時間枠 (TF) の重要なピボット レベルを自動的に反映します。
指標は、選択した時間枠 (日、週、月、年) の価格軌道を完全に表し、トレンドの開始と、逆のトレンドに発展する可能性のある修正の開始を決定します。
指標はまた、価格マグネットとして機能する、さまざまな時間枠の現在の未処理のピボット レベルを表示します。これにより、市場の状況をすばやく評価し、取引の開始または終了を決定できます。各取引の潜在的可能性は、平均 50 ~ 1000 ポイントです。
指標を使用すると、さまざまな時間枠での価格変動の可能性のある方向を評価でき、最も可能性の高いターゲットと価格変動の可能性も示します。
指標の利点: 1. 指標は、高精度で信号を生成します。 2. ピボット レベルは消えず、再描画されません。GVIバッファーの確認された矢印シグナルは、トレンドが強い場合にのみ再構築できます。 3. どのブローカーのMetaTrader 4取

このインジケーターは複数のインジケーターを使用して高勝率のシグナルトレードを生成します
V3 でのアラートとシグナルの改善
Live Testing
Metatrader 4 の TrendArrowsAlerts インジケーターは、チャート上に正確な売買矢印を印刷する完全な FX 取引システムです。
このインジケーターは、メインの MT4 チャート ウィンドウに緑と赤の色の矢印として表示されます。
単一のインジケーターによって生成されたシグナルを使用することは、取引中に危険を伴う可能性があります。 これは、取引に 1 つのインジケーターのみを使用すると、より多くの誤ったシグナルが発生する可能性があるためです。 したがって、多くの外国為替トレーダーは、適切な取引設定を除外するために 3 つ以上の指標を使用していました。
ただし、シグナルに複数のインジケーターを使用することは、複雑で混乱を招く可能性もあります。 これは、これらの指標が矛盾するシグナルを生成している場合に特に当てはまります。 ただし、TrendArrowsAlerts インジケーターは、複数のインジケータ

アカウントの残高とシンボルのスプレッドをリアルタイムで監視できる優れたユーティリティツール これにより、データを正確に特定する方法、たとえばプロップファームの口座を持っているかどうか、正しいラベレージやスプレッドが操作されているかどうかなどを知り、正確なロットを作成する方法がわかります。
レバレッジとスプレッドインジケーターの組み合わせ。 取引口座のレバレッジとスプレッドを自動チェックするためのツール。 すべてのブローカー外国為替株で働いています。 ブローカー外国為替のレバレッジ変更を監視したり、経済ニュースの発表中に拡散したりする場合に役立ちます。 現在のシンボルのリアルタイムスプレッドチェック。 取引口座のリアルタイムレバレッジチェック。 高速更新による分かりやすいデザイン 等
FREE
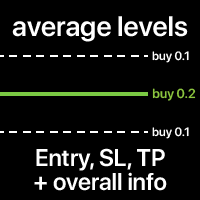
シンボルにおけるすべての取引の平均エントリ、SL、TPレベル。 レベルは一緒に計算するか、買いと売りの取引を別々に計算できます。 オプションで追加情報を表示可能:レベルの価格、総ロットサイズ、浮動損益。 レベルのスタイルと色はカスタマイズ可能です。 多機能ユーティリティ : 66以上の機能を含む | 質問があればご連絡ください | MT5バージョン インジケーターの設定で構成可能: 平均エントリレベル: オン/オフ; 平均SLレベル: オン/オフ; 平均TPレベル: オン/オフ; 買いと売りを別々に: ' false 'を選択した場合 - レベルは 買いと売りを合わせて計算されます。 保留注文を含む: オン/オフ; アクティブなポジションを含む: オン/オフ; 追加情報を表示: オン/オフ; 右端に情報を表示? もし ' false 'の場合: 追加情報は左端に表示されます; ラインとテキストの色: エントリ、SL、TP用; ラインのスタイル: エントリ、SL、TPレベル用; ラインのサイズ: エントリ、SL、TPレベル用; ' フ

取引の価格レベル別可視化。 計算期間を自由に設定可能:2本の垂直線間または固定時間間隔。 ヒストグラムのレベルは相対的:幅の広いバーは取引量が多いことを意味します。 分布の極値はサポートとレジスタンスレベルとして使用可能です。
すべてのスタイル、サイズ、色をカスタマイズ可能。 多機能ユーティリティ : 66以上の機能を含む | 質問があれば私に連絡 | MT5バージョン インジケーターの設定で調整可能: ヒストグラムのスタイル:
視覚モード: バー / ライン / アウトライン / 方向 (各レベルの価格の優勢な方向に依存するバーの色)。 ヒストグラムの位置: チャート境界 / 時間範囲内 / 時間範囲外 : 左/右。 2つのヒストグラム色。 ヒストグラム 幅。 ヒストグラムサイズ (% チャート 幅 )。 計算設定: 範囲境界のタイプ: チャート2ライン間 / 指定された最近の分 / 右境界前の指定分 。 範囲期間(タイプ2および3の場合、分数で)。 ボリュームデータソース: チャートバー (

デルタ フットプリント チャートと組み合わせると、市場ボリューム プロファイルの全体像がわかります。
https://www.mql5.com/en/market/product/9415 3 「オーダーブック」インジケーターは、買値と売値のクラスターを表すヒストグラムを価格チャートに表示します。
このインジケーターは過去の価格データを分析し、指定された数のバー内の各価格レベルの買値クラスターと売値クラスターを計算します。 買値クラスターは青色で表示され、売値クラスターは赤色で表示されます。
このインジケーターは、さまざまな価格レベルでの買値と売値の分布に関する情報を提供します。 トレーダーはこの情報を使用して、取引活動が活発な領域と潜在的なサポート/レジスタンスレベルを特定できます。 ヒストグラム バーは、各価格レベルでの買い値と売り値のクラスターの数を表し、市場の流動性を視覚的に表します。
ヒストグラム バーに加えて、インジケーターには、分析期間内の買い値と売り値のクラスターの合計数を示すテキスト ラベルも表示されます。 これらのラベルは、新しい価格データが利用可

Candle Binary Scalper - is a technical analysis product for forex and binary options.
Includes several technical indicators combined into a trading system.
Suitable for manual trading within a trend, for scalping and binary options. Works on all time frames and trading instruments.
Recommended Timeframes for trading M15, M30, H1 and H4, M5 and M1 should be used in case of high volatility. There are several types of alerts.
How to use the product
The optimal settings have already been selected

This version of the indicator works only in the tick data stream. In this way, we only see the current situation from the moment of launch. I recommend using the classic version Real-Time Currency Valuation . The indicator calculates currency strength of eight major and also can calculate strength of any other currency, metal or CFD.
Main Features It is able to display only the currencies that are currently necessary, thus not overloading you with unnecessary information and notifications. It
FREE

Candle confirmer is the indicator you need when you're waiting for the last candle to confirm to make an excellent order, this indicator will alert you if the current candle has had a higher or lower price compared to the previous candle. Stop trying to guess and start focusing on what really matters. You can activate or deactivate the alerts, chose the time-frame and even change the size, color and position of the indicator. Don't forget to leave your review and comments, it helps us improve

Introducing the Kangaroo Hunter - Your Ultimate Edge in Forex Trading ATTENTION Forex Traders! Are you in constant pursuit of high-probability trade setups? Or maybe you're a novice trader struggling to pinpoint precise entry and exit points? Our solution, the Kangaroo Hunter, is about to revolutionize your trading journey. This meticulously designed indicator simplifies and refines the art of identifying the often elusive Kangaroo Tail patterns in the Forex market, pushing your trading strateg

It is no secret that the movements of currency pairs for a certain part of the time occur in a certain price corridor, which is called a channel. The lower limit is considered the level of support, the upper one - resistance. Do not confuse with horizontal support and resistance levels! The distance between the support and resistance levels of a channel is called the range or channel width. The key difference between the Channel Mirosh indicator and other channel indicators (for example, from th

Optimized Version of the Pivot-Based Adaptive Support, Resistance, and Signal Line Indicator No Parameters, Simple and Easy to Use, Suitable for Daily and Lower Timeframes. Advantages: Applicable to all instruments. Suitable for all timeframes. The indicator automatically adjusts with changing data, providing more accurate signals. Instructions for Use: If the current price breaks above the signal line, the trend is bullish, with the initial target being the upper resistance line. If the price

The Strong Volume Trend MT4 indicator is a powerful tool designed to help traders identify and capitalize on significant volume trends in the financial markets. With its advanced algorithm, this indicator accurately detects the strength and direction of volume movements, allowing traders to make informed trading decisions. Features: Volume Strength Analysis: The indicator analyzes the volume data and identifies strong volume trends, helping traders spot potential market reversals, breakouts, or

Introducing the "Amusing Entry Arrows" signal indicator, a powerful tool designed to enhance your trading experience on the H1 chart. With its advanced features and customizable arrow settings, this indicator provides valuable insights and timely alerts to help you make informed trading decisions. Key Features: H1 Chart Compatibility: The "Amusing Entry Arrows" indicator is specifically designed to operate on the H1 timeframe, allowing you to analyze price movements effectively within this timef

Trusty Super Signal Indicator
The Trusty Super Signal Indicator is a powerful technical analysis tool designed to assist traders in making informed trading decisions in the financial markets. With its advanced algorithm and user-friendly interface, this indicator provides accurate and timely signals to help identify potential trading opportunities.
Features: 1. Reliable Signal Generation: The Trusty Super Signal Indicator uses a sophisticated algorithm to generate high-quality trading signal

Introducing the SmartZone Reversal Master, a powerful indicator designed to assist traders in identifying potential trade entry points. This indicator utilizes the SMC concepts of liquidity engineering and higher resolution trend analysis to help traders make informed decisions.
By identifying institutional key levels in the market and monitoring price movements in relation to them around certain times of the day (ICT killzones) when volatility is higher, the SmartZone Reversal Master enhances

Fibonacci retracement is an object or function that is often used by traders to determine values of fibonacci levels. When to open position, where is the breakout or limit point, stop loss position and take profit position can be determined based on fibonacci levels. But commonly, this object only can be used manually in Metatrader 4 (MT4). Therefore we need an indicator of fibonacci retracement. The use of indicator will make decision making easier, faster, and more consistence. We recommend t

Meet the Tweezer Hunter, an essential tool for every Forex trader looking to make accurate, trend-following trades. This powerful, intuitive indicator helps traders spot potential trend reversals before they happen, providing a significant advantage in the fast-paced world of Forex trading. The Tweezer Hunter is more than your average tweezer candle indicator; it's designed with a built-in trend identification feature that accurately detects whether the market is bearish or bullish. By integrat
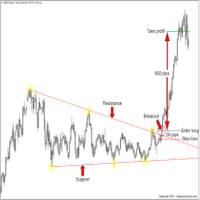
October OFFER: Free Ea with it This is valid till 30th of October. After purchase of indicator connect me on telegram @anabullbear or inbox in mql5 to get free Ea It's a Breakout Scalper On support and resistance and order blocks. Benefits of the indicator: does not redraw arrows. works on all currency pairs. high signal accuracy good for scalping Accuracy level is more than 95 percent. Best TF m15 for gold and major FX pairs Indicator settings: Default for M15,M30, H1 Best Pair -Gold and majo
This indicator uses candlesticks with large real bodies to predict possible market structure shift. Displacement is a very powerful move in price action resulting in strong selling or buying pressure. Generally speaking, displacement will appear as a single or a group of candles that are all positioned in the same direction. These candles typically have large real bodies and very short wicks, suggesting very little disagreement between buyers and sellers. Often, a displacement will occur just af

The Zigzag Value Indicator is a powerful technical analysis tool designed to assist traders and investors in identifying significant price movements and trends in financial markets. With its advanced algorithm, this indicator helps users determine key turning points and potential reversals, providing valuable insights for making informed trading decisions. To View Our Other Products Go to the link: Other Products
Features:
1. Zigzag Pattern Detection: The Zigzag Value Indicator detects and

Indicator of the price channel and breakpoint generator inside it. It gives an idea of the position of the price in relation to the period of use.
It contains smoothed trend bounce lines built along the channel borders and bounce points that determine entry and exit moments.
Works on various trading instruments and time frames.
How to work with the indicator
Follow the channel break line, the blue line is up inputs, the pink line is down inputs.
Entry points are generated on the current candle

既製の取引システム「Mr. Scalp」は、販売または購入の取引を開始する必要があるときに、トレーダーに既製のシグナルを表示します。 システムは、いつ、どの方向で注文をオープンする必要があるかを示します。 すべての通貨ペアとすべての時間枠で機能します。 このインジケーターは、市場が反転して反対方向に動く可能性が高い瞬間をチャート上の赤と青の点で視覚的に示します。 このシステムは、チャネルラインを使用して現在のトレンドの方向も示します。 携帯電話に信号を送ることができる!
氏との取引方法 頭皮(説明書): チャネルが下を向いていて、現在のバーに赤い点が表示されたら、売り取引を開始します。 通貨ペアと時間枠に応じて、TakeProfit サイズを 15 ~ 50 ポイント、StopLoss サイズを 100 ~ 300 ポイントに設定します。 これは、そのようなストップ サイズで、30 ~ 40:1 の比率でテイク プロフィットで取引を閉じるスキャルピング システムです。 つまり、TakeProfit で 30 ~ 40 件の取引、StopLoss で 1 件の取引を閉じることができま

" Scalping and dethatching " is a signal forex indicator for scalping, which visually shows the direction of the current trend on the chart. This indicator allows you to determine the direction of the current trend with an accuracy of up to 90% within 3 seconds after being added to the chart. The universality of the indicator lies in the fact that it works on all currency pairs. All currency pairs are subject to the same fundamental market laws, so the " Scalping and dethatching " indicator wor

With the help of the Fine Market Forex indicator algorithm, you can quickly understand what kind of trend is currently developing in the market. Fine Market is a combined indicator based on several instruments. Fine Market is based on classic basic technical indicators - MA, RSI, MACD, Bollinger Bands, Stochastic. A trader does not need to impose several lines on Forex charts and set up each indicator separately. Fine Market is already successfully combined and has simplified settings, convenie
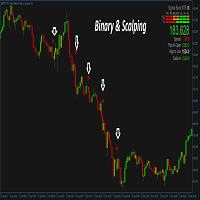
This is a trend following system for Binary options traders and forex scalpers. It is carefully crafted and recognizes periods of strong trends in the market and gives the trader the advantage and opportunity of riding with the momentum. It works on all timeframes and currency pairs especially high liquidity pairs. Avoid news events 15mins before and after. Always have your money management script or system in place. Tested on Deriv synthetics as well, please check screenshots. MT5 version can b

Do you know the spreads on which your trades are / will be opened. How well do you know about the spreads on which your trades are / will be opened.
The main task of the indicator. Help the user / trader to study the spreads in the trading terminal.
Get information about the minimum and maximum spread on each candle, from M1 and above. This information will help in the following cases: - Maximum trading spread EA --- If your broker has smaller spreads or average statistically higher and th

This indicator is great for trading on the pair and many more. The indicator itself uses augmented accuracy mathematical strategies, but so far they are optimized for some currency pairs. Many settings can be configured on the working panel. There are two panels on the chart, for visualization and settings. He displays his solution on the graph in the form of icons. There are only two types of icons. In the tester, it works fine by default in the settings. The second panel for counting the res

This indicator will help you identify the key zones needed for The Silver Bullet Strategy which are: The three time-windows the ICT mentioned in the strategy Window 1: 3 AM and 4 AM New York time Window 2: 10 AM and 11 AM New York Time Window 3: 2 PM to 3 PM New York Time Bullish and bearish supply and demand zones which will help you identify FVG inside those time windows T he previous day's high and low, draw on liquidity The indicator does not plot the FVGs to avoid cluttering the chart Exi

MACD - the Moving Averages Convergence/Divergence indicator displays information simultaneously from different periods in one subwindow of the chart.
Parameters Fast EMA — period for Fast average calculation. Slow EMA — period for Slow average calculation. MACD SMA — period for their difference averaging. Type of price — price used. Timeframes for MACD — list of periods, separated by a space or comma or semicolon. Number of bars for each period — the number of bars displayed for each period. So

The indicator allows for quick identification of price reversals by promptly reacting to price impulses and indicating the beginning of a price reversal. The histogram demonstrates the direction of movement and identifies favorable moments for opening positions. It is recommended for use in swing trading and can be applied to any currency pairs, metals, and cryptocurrencies. It is also suitable for binary options trading. Key Features Rapidly identifies changes in the local trend Works on all t

Fast Scalping is a new product that allows you to identify the current market phase (uptrend, downtrend or flat). Represents a typical investor strategy that usually indicates a trend change from bearish to bullish. A tool that allows you to determine the direction and strength of a trend. Unlike most indicators, Fast Scalping finds longer trends and gives fewer false signals.
This indicator displays arrows of different colors depending on the current state of the market and thus signals the u

The Game-Changing Engulfing Candle Hunter - Your Guide to Profitable Trend Trading
Step into the realm of trading possibilities with our revolutionary product - The Engulfing Hunter. Designed by traders for traders, this dynamic indicator combines the potency of engulfing candlestick patterns and the versatility of proprietary trend detection system, offering a trading edge unlike any other. Engulfing candlestick patterns have always been a revered tool in the arsenal of seasoned traders. Acting

Introduction RSI divergence is a main technique used to determine trend reversing when it’s time to sell or buy because prices are likely to drop or pick in the charts. The RSI Divergence indicator can help you locate the top and bottom of the market. This indicator finds Regular divergence for pullback the market and also finds hidden RSI Divergence to show continuing trend. This indicator shows divergence on the RSI that is a strong hint for an excellent entry point and finds immediately with
FREE

This is the Simple Indicator based on Trend and Break of Structure, so that i have combined the Moving Average and the Stochastic combination's for the Better results it will signal based on the Trend (MA) for the sharp entries.
Advantages of the System.
Purely Trend Based Strategy. BOS(Break of Structure on the trend Side Confirm's the Signal). Minimum 1:2 Ratio can be easily Achievable.

Smart Currency Strength is a powerful yet simple indicator that measures the strength of individual currencies.
It features a graphic panel that lists the main currencies and their strength in each timeframe, ranging from 0 (most oversold) to 100 (most overbought). The strength for all currencies in the current timeframe is also shown in a separate window as a multi-line graph, where each currency is represented with a different color, this allows you to monitor the evolution of strength tre

This indicator gives you the Moving Average based on Renko chart. A Renko chart is a type of chart that is built using price movement rather than both price and standardized time intervals like most charts are. A Moving Average based on Renko chart is considered less noisy since it is not based on the time and only based on price change. You can see my free enhanced Renko indicator here .
Inputs: Box Size: Renko box size based on market Points.
Period: Moving Average Period
Method: Moving
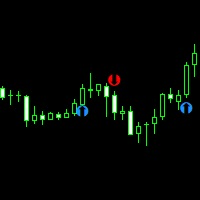
**Features:**
1. **Innovative Trend Tracking:** The UT BOT Simple Indicator leverages the power of the Average True Range (ATR), a renowned volatility measure, to calculate precise trailing stop values, providing unparalleled insights into market trends.
2. **Customizable Settings:** Flexibility is paramount in any trading strategy. With this in mind, our indicator allows you to adjust the ATR periods and other key parameters to tailor the tool to your trading style and strategy.
3. **Real-t
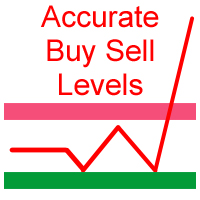
Accurate Buy sell Levels are the fully automated and purely work's on the basis of the Daily Opening weekly Opening and the Monthly Opening Prices. we don't want to do any analysis and other planning for Intraday or Swing we need to focus only when price approaches near the levels we can add other price action confluence's (Inside Bar's , Bullish / Bearish Engulfing pattern's , SND , Order Blocks ... and so on ) for strong Buy or Sell Confirmation's. Very simple and Easy to Follow system. We c

Title: Best Reversal Indicator - A Custom MQL4 Indicator for Trend Reversals Description: The "Best Reversal Indicator" is a custom MetaQuotes Language 4 (MQL4) indicator designed to identify potential trend reversals in financial markets. This indicator is intended to be used on MetaTrader 4 (MT4) trading platforms. Key Features: Non Repaint: Best Reversal Indicator is a non repaint indicator means It does not remove its signal after moving forward. Trend Reversal Detection: The indicator scan

これは、スキャルパー システムまたは非常に強い勢いに乗る戦略として、FX マニュアル トレーダー、バイナリー オプション トレーダー、または自動取引でユニバーサル EA によって使用される両方に適した多目的システムです。 これは、スキャルパー システムまたは非常に強い勢いに乗る戦略として、FX マニュアル トレーダー、バイナリー オプション トレーダー、または自動取引でユニバーサル EA によって使用される両方に適した多目的システムです。
Jeslyn は長年の研究に基づいた戦略であり、特定の価格アクション戦略に焦点を当てています。シンプルな矢印インジケーターのように見えるかもしれませんが、洗練された論理的なアルゴリズムが組み込まれています。他の指標から計算を引き出すのではなく、価格変動のみに基づいて計算します。トレンド、勢いとの違い、ダイバージェンスと出来高スプレッド分析の関係を解釈する方法を見つけました。勢いよくポジションが埋まるミニ供給ゾーンと需要ゾーンがあり、これらは開始時に私たちが希望する場所です。また、メタトレーダーでは実際の出来高を取得できないとも言われていますが

MT4インジケーター「イーグルアイ」でバイナリーオプション取引の可能性を引き出す MetaTrader 4(MT4)用の「イーグルアイインジケーター」を使って、バイナリーオプション取引の世界に革命を起こしましょう。この革新的なツールは、レーザーのような精度と比類のない収益性をもたらし、あなたのトレーディング体験を変える準備ができています。 ポテンシャルの境界が崩れ、利益が最大化される世界に飛び込んでください。イーグルアイインジケーターの比類のない精度と揺るぎない信頼性によって、市場の隠された秘密が明らかにされます。細部への緻密な注意を払って設計されたこの先進的なインジケーターは、先進的なアルゴリズム、入念なテクニカル分析、リアルタイムの市場データを組み合わせ、並外れたトレーディングの優位性を提供します。 イーグルアイインジケーターは市場のポイントを的確に把握し、迅速な意思決定をサポートします。直感的なインターフェースと使いやすいデザインにより、初心者のトレーダーでもバイナリーオプションの複雑な世界をスムーズにナビゲートし、その強力な力を最大限に活用することができます。 過去の推測や感情
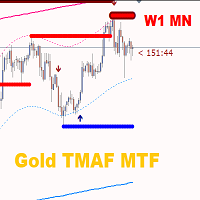
Gold TMAF MTF - これは最高の株式テクニカル指標です。指標のアルゴリズムは、資産の値動きを分析し、ボラティリティと潜在的なエントリーゾーンを反映しています。
最高の指標シグナル: 売りの場合 = TMA2の赤い上限がTMA1の赤い上限の上にある場合 + 上記の赤いフラクタル指標 + 同じ方向に黄色のSRシグナル矢印。 買いの場合 = TMA2の青い下限線がTMA1の青い下限線より下にある場合 + 下からの青いフラクタル指標 + 同じ方向の水色のSRシグナル矢印。 インジケーター(赤および/または青の W1 MN)は、快適で収益性の高い取引を行うための追加かつ不可欠な補助ツールです。 SR 矢印バッファには、快適で収益性の高い取引を実現するためのインジケーター設定 (UseFiltrSR = true;) に別の矢印フィルターがあります。
このインディケータの利点
1. このインディケータは、高精度のシグナルを生成します。 2. 確定した矢印シグナルは再描画されませんが、フラクタルシグナルは半周期再描画されます。 3. どのブローカーのMetaTrader 4

MRA Index インジケーター概要 ボーナス特典: インジケーターを購入すると、「MRA Index EA」を無料で入手できます。 最適化戦略: スキャルピングでは、過去12か月間のデータを基に設定を最適化し、次の1か月間使用します。この方法は非常に効果的であることが証明されています。 重要な注意点: デフォルト設定は視覚化のみを目的としており、収益性のために最適化されていません。適切な最適化手順は購入者のみに提供されます。 「MRA Index」インジケーターについて: 「MRA Index」は、多様な市場動向とエントリーポイントを特定するのに役立つ多機能なFXインジケーターです。専門的なチャネルと、その中を移動する動的なハイブリッドラインを備えており、売買シグナルを生成します。 主な特徴: 動的ハイブリッドライン: チャネル内を移動し、取引シグナルの基盤となります。 買い・売りシグナル: ハイブリッドラインとチャネルの特定の相互作用に基づいて生成され、市場の反転の可能性を示します。 カスタマイズ: さまざまな入力パラメーターを調整して、トレーダーの戦略に適応できます。 オプショ

このインジケーターは、最も適切なエントリーとエグジットポイントを表示します。また、取引をよりよく分析するために、すべてのシグナルの統計データを表示します。
このインジケーターを使うことで、市場をより深く理解することができるようになります。
トレンドの力が弱まり始めると(パネルに表示されます)、トレンドラインは水平位置に引き寄せられ、これは取引を終了するシグナルです。または、平均/中央の利益水準に達したときに終了することもできます。
このインジケーターは、2010年からの私の取引経験の結果です。 MT5用インジケーターバージョン
特徴 このインジケーターは再描画しません。ヒストリカルチャートに表示されているものは、リアルタイムでも表示されます。 暗号通貨、株式、金属、指数、商品、通貨など、あらゆる資産の取引に使用できる。 すべてのタイムフレームで動作します。 エントリーするためのシグナルは、新しいローソク足のオープニングで表示されます。 取引終了のシグナルは暫定的に表示され、より大きな利益で取引を終了できることが多いからです。 左上には、取引統計の詳細パネルがあり、最小化することが

移動平均通貨強さダッシュボードは、 複数のシンボルや時間枠にわたる通貨の勢いについての深い洞察を提供する強力かつ包括的な指標です。この強力なツールは、移動平均を利用して最新のクロスオーバー ポイントを特定し、現在の価格までの通貨の強さを効果的に追跡します。このダッシュボードは、直感的なデザインとユーザーフレンドリーなインターフェイスにより、情報に基づいた意思決定を求めるトレーダーに豊富な情報を提供します。
このダッシュボードの重要な機能の 1 つは、スキャナ モードで動作する機能であり、ユーザーは市場をスキャンして潜在的な機会を見つけることができます。このインジケーターの包括的なダッシュボードにはすべてのシグナルがボタンとして表示され、必要な情報に簡単にアクセスできます。ボタンをクリックするだけで、クロスオーバー ラインを含む新しいチャートが開き、シグナルがより詳細に表示されます。さらに、グループ モード機能を使用すると、シンボルをグループに分けて表示でき、通貨の関係を構造化して表示できます。
カスタマイズ可能なパラメータを備えた移動平均通貨強さダッシュボードは、個々の取引の好み

アカウントダッシュボードの統計
これは、アカウントの損益を把握するために集中的に表示するのに役立つツールであり、それを追跡することができ、また、得られるリスクを知るためのドローダウン分析も提供します。 アカウントにダウンロードしてアクティブ化した後、EURUSD H1 などの任意のシンボルに添付する必要があります。その後、この瞬間からツールが統計の監視を開始します。
パネルは完全に高度になっており、非表示にしたり、好きな場所に移動したりできます アカウント操作に基づく主な特徴は次のとおりです 毎日の期間(毎日の利益と損失は毎日更新されます) 毎週の期間 (毎週更新される週ごとの利益と損失) 毎月の期間(毎月の損益は毎月更新) 年間期間 (年間の損益は毎年更新) 最大ドローダウン(残高に基づいて最大リスクに達するのを毎秒監視して制御) たとえば、残高が 1000 米ドルで、引き出しが 10% をマークしている場合、ある時点でアカウントの合計リスクが 100 米ドルに達したことを意味します。
FREE
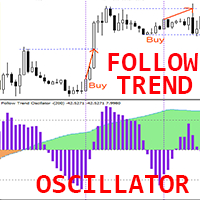
「Follow Trend Oscillator」は、高度なカスタム Crypto_Forex インジケーターであり、効率的な取引ツールです。
- ユーザー フレンドリーなインジケーターは、主要なトレンドの方向にスキャルピングする機会を提供します。 - 信号ヒスト部分を備えた、滑らかで調整可能なオシレーター。 - 上昇トレンドの場合はオシレーターの色が緑色、下降トレンドの場合は茶色。 - 売られすぎの値: -30 未満、買われすぎの値: 30 以上。 - このインジケーターを使用すると、標準戦略をアップグレードする機会が十分にあります。
// 素晴らしいトレーディングロボットとインジケーターはここから入手できます: https://www.mql5.com/en/users/def1380/seller これは、この MQL5 Web サイトでのみ提供されるオリジナル製品です。

An arrow indicator is an indicator that displays arrows on a chart to indicate the direction of the market. The red arrow indicates an implied down move, while the blue arrow indicates an implied up move. The indicator works on all timeframes and all currency pairs.
Trading strategy based on arrow indicator:
Position entry: When the red arrow appears, open a sell position (short). When the blue arrow appears, open a buy position (long). Entry is made at the opening of the next bar after the a

[ MT5 Version ] Are you tired of spending months on demo or live accounts to test your trading strategies? The Backtesting Simulator is the ultimate tool designed to elevate your backtesting experience to new heights. Utilizing Metatrader historical symbol information, it offers an unparalleled simulation of real market conditions. Take control of your testing speed, test ideas quickly or at a slower pace, and witness remarkable improvements in your testing performance. Forget about wasting time
Please thoroughly test demo the indicator in your preferred trading conditions before making a purchase decision.
Your satisfaction and confidence in its performance are paramount.
MT Magical : A sophisticated strategy combining swing trading, trend analysis and supply & demand signals. Expertly filtered for precision. Developed with rigorous effort, delivering value to serious investors. Indicator for traders who prefer manual trading. Request: PC high performance
TRADE: Forex
TIME FRA

We provide indicators tailored to better meet your trading requirements. >> MT Magical <<
MT Supply Demand :
It is an indicator created to find supply and demand, which will be important support and resistance levels for the price. Supply Zone is a zone where the price has reached, it is often resisted. In other words, when the price reaches this zone, there will be more selling power to push the price back down.
Demand Zone is a zone where the price has reached, it is ofte
FREE

This Rattling Signal Point indicator is designed for signal trading. This indicator generates trend signals.
It uses many algorithms and indicators to generate this signal. It tries to generate signals from the points with the highest trend potential.
This indicator is a complete trading product. This indicator does not need any additional indicators.
The indicator is never repainted. The point at which the signal is given does not change. When the signal comes the arrows are put back on

This Great Entry System indicator is designed for signal trading. This indicator generates trend signals.
It uses many algorithms and indicators to generate this signal. It tries to generate signals from the points with the highest trend potential.
This indicator is a complete trading product. This indicator does not need any additional indicators.
The indicator is never repainted. The point at which the signal is given does not change. When the signal comes the arrows are put back one ca
MetaTraderマーケットはMetaTraderプラットフォームのためのアプリを購入するための便利で安全な場所を提供します。エキスパートアドバイザーとインディケータをストラテジーテスターの中でテストするためにターミナルから無料のデモバージョンをダウンロードしてください。
パフォーマンスをモニターするためにいろいろなモードでアプリをテストし、MQL5.community支払いシステムを使ってお望みのプロダクトの支払いをしてください。
取引の機会を逃しています。
- 無料取引アプリ
- 8千を超えるシグナルをコピー
- 金融ニュースで金融マーケットを探索
新規登録
ログイン