YouTubeにあるマーケットチュートリアルビデオをご覧ください
ロボットや指標を購入する
仮想ホスティングで
EAを実行
EAを実行
ロボットや指標を購入前にテストする
マーケットで収入を得る
販売のためにプロダクトをプレゼンテーションする方法
MetaTrader 4のための新しいテクニカル指標 - 60
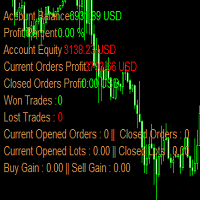
account_info_horizontal is a mt4 (MetaTrader 4) indicator and it can be used with any forex trading systems / strategies for additional confirmation of trading entries or exits.
Indicators add account information to chart. Profit, Balance, Equity, Free Margin, Margin and Margin Level %.
AccountInfo indicator can reveal all advanced features of MetaTrader 4 (above build 600). This indicator can clearly symbolize the main data of the current account (balance, equity, free margin, current Pro

Real Trend Zigzag shows the real trend of a market, u nlike the default Zigzag indicator. It calculates the trend in real time and shows green lines for upwards trends, red lines for downward trends and blue lines for no trends. Regarding the old slogan "the trend is your friend" it helps you to decide if should open a buy or sell position. MT5 Version can be found here: https://www.mql5.com/en/market/product/72065 If you are looking for a multi timeframe zigzag, take a look at the PRO vers

Real Trend Zigzag PRO shows the real trend of a market, u nlike the default Zigzag indicator. It calculates the trend in real time and shows green lines for upwards trends, red lines for downward trends and blue lines for no trends. Regarding the old slogan "the trend is your friend" it helps you to decide if should open a buy or sell position. The PRO version is a multi timeframe zigzag (MTF). Means, it shows the trend of the current timeframe as well as the trend of a higher or lower time.

What Is a Pivot Point? A pivot point is a technical analysis indicator, or calculations, used to determine the overall trend of the market over different time frames. The pivot point itself is simply the average of the intraday high and low, and the closing price from the previous trading day. On the subsequent day, trading above the pivot point is thought to indicate ongoing bullish sentiment, while trading below the pivot point indicates bearish sentimen
How to Use Pivot Points The very e

Super Trend Button Super Trend is a trading strategy according to which one should trade Forex or Stocks when its price trend goes up, and trend goes down, expecting price movements to continue. “The trend is your friend” agree? Features - Special Button : Quick hide/show Super Trend chart. ( Make your Chart more clean and clear easily) - Color : You have the option of customising your favourite colour of Up Trend or Down Trend . - Super Trend Periods : You have the option to c
YOU ARE PUCHASING A FOREX INDICATOR THAT WAS CUSTOM BUILT IN 2021 THIS INDICATOR WILL HELP YOU FIND PRECISE ENTRIES FOR TRADES. SO HOW DOES IT WORK? 1) It looks for engulfing candlestick pattern. (It can tell if there is a bullish or bearish engulfing pattern which is a typically a reversal signal) 2) It will also look to see if price is near a short term extreme by using Bollinger Bands. 3) It combines the engulfing candle stick pattern along with Bollinger Bands to give signal 4) If price has

NOTE: THIS IS A MULTICURRENCY INDICATOR AND AS SUCH MAY NOT BE COMPARTIBLE WITH MT4 BACKTESTING. EASIEST WAY TO TEST IT IS BY SIMPLY RUNNING IT IN REAL-TIME ON MT4.
Model Lelothoane is a forex trading system model packaged into an indicator executable on a PC running Metatrader 4. The model exploits the mean-reversion property of stationary processes. Stationarity is determined or confirmed by performing cointegration tests between two forex instruments. In the case that there is strong eviden

NOTE: THIS IS A MULTICURRENCY EXPERT ADVISOR AND AS SUCH MAY NOT BE COMPARTIBLE WITH MT4 BACKTESTING. EASIEST WAY TO TEST IT IS BY SIMPLY RUNNING IT IN REAL-TIME ON MT4.
Model Lelora is a forex trading system model packaged into an indicator executable on a PC running Metatrader 4. The model exploits the mean-reversion property of stationary processes. Stationarity is determined or confirmed by performing cointegration tests between three forex instruments that form a triangle (i.e have a prod
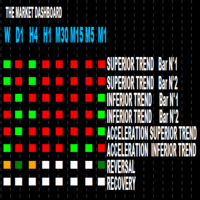
1. Access to all market in the same graphic You know exactly what happens in the market from the shortest timeframe(M1) to the biggest one (MONTH). You will see wether there is a reversal, recovery,acceleration, deceleration of the market. Therefore your decisions become more easy to take and as you are far from usual stress that traders are facing because of numerous analysis they have to do in order to enter or exit the market.
2. Features Every timeframe shows: SUPERIOR TREND B

このプロジェクトが好きなら、5つ星レビューを残してください。 インスタグラムでフォロー:borelatech ボリュームウェイト平均価格は、合計ボリュームに取引された値の比率です
特定の時間の地平線上に取引. 平均価格の尺度です。
株式が取引地平線上に取引されている. VWAPは、多くの場合、
投資家の取引ベンチマークは、可能な限り受動を目指す
実行。 このインジケータを使用すると、VWAPを以下のように描画できます。 現在の日。 現在の週。 現在の月。 現在の四半期。 現在の年。 または: 前の日。 前週。 前の月。 前の四半期。 年末年始
FREE

このプロジェクトが好きなら、5つ星レビューを残してください。 インスタグラムでフォロー:borelatech このインジケータは、指定されたためのオープン、ハイ、ロー、クローズ価格を描画します
特定のタイムゾーンの期間と調整が可能です。 これらは、多くの機関や専門家によって見られた重要なレベルです
トレーダーは、彼らがより多くのかもしれない場所を知るために有用であり、
アクティブ。 利用可能な期間は次のとおりです。 前の日。 前週。 前の月。 前の四半期。 前年。 または: 現在の日。 現在の週。 現在の月。 現在の四半期。 現年。
FREE

指標はフラクタルの価格構造を分析し、市場ダイナミクスの可能な反転ポイントを識別します。他のタイプのインジケーターと組み合わせて使用すると最適です。
利点:
すべての機器と時系列で動作し、 結果を再描画しません、 インジケーター要素のカスタマイズ可能な色、 トレンド戦略とうまく連携し、 フラクタルの強さを調整します。
MT5 version -> HERE / Our news -> HERE
Strategy:
AW Flexible Fractals is an indicator that indicates signals not instantly, but with a delay, due to the structure of the fractal.
To detect a signal in the " Number of candles on each side of the fractal " variable, you can adjust the number of bars on each side fr
FREE
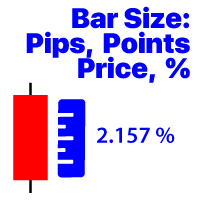
選択した時間枠の最後に閉じたバーの変更を表示します 価格価値; パーセンテージ値(%); ピップス; マーケットポイント; 私の#1アシスタント :36+機能が含まれています| ご質問がある場合は私に連絡してください プログラムファイルは" Indicators "ディレクトリに配置する必要があります。
インジケータの設定では、次の設定を行うことができます: フォントサイズ; テキストの色; チャート上の配置:左下または右下隅; お使いのコンピュータの現在の時刻の表示をオン/オフにします; 計算のための時間枠(あなたは現在を設定することができます:TFが変更されると値が変更されます); 計算タイプ:
1=価格値;
2=パーセンテージ値(%);
3=ピップ単位のサイズ;
4=ポイント単位のサイズ; 値の計算方法:
true:高-低の値が使用されます;
false:Open-Close値が使用されます;

"BUYUK SAVDOGAR" TM has developed this strategy to support anyone who trades binary options.
The "monoBAR" trading system is based on mathematical probability and consists of algorithms that can analyze the market situation with high accuracy.
This trading system consists of mathematical probability, which helps to determine the most accurate state of the price movement. The strategy algorithm helps to detect small impulse movements in a timely manner.
You can simultaneously analyze and r
Trend Second Derivative RSI is a forex indicator based on the usual RSI, based on the second derivative of the price function. On the chart itself, trend signals will be displayed by arrows, they are filtered by the algorithm and always alternate buy / sell. It also shows the number of profitable pips that the indicator can give at the specified interval (LimitCalcHistory). The indicator has a parameter (Spread), which deducts a part of the profit per spread for each signal.
Immediately notic

This tool scans the market looking for the correct entry. You can see and evaluate it yourself, perhaps it will suit you for a number of tasks related to forecasting price movements. It uses only price data and analytics to calculate entry points. Does not use auxiliary indicators. It has two parameters for customization.
Setting the indicator. Interval - price analysis interval. Subterfuge - analysis correction interval.
The Mockingbird indicator is more interesting on long trends. A filter is required to work in flat. The border of the trend / flat value is dynamic and depends on the indicator parameters. You yourself are able to adjust it. The indicator is easy to configure. Works on all timeframes and on all instruments.
Segment - Segment of the market for analysis. Length - The number of bars to be recalculated.

O melhor indicador para o mercado forex, binárias, commodities! Não repinta ( não alterna o sinal, ocultando as percas) 100% transparente e muito eficaz. Ótimo indicador mesmo no período de notícias! Sempre aprimorando para ser o indicador mais poderoso do mercado! Com atualizações mensais... próxima atualização dia 30 de setembro de 2021 CONFIRA!!!!

The General indicator helps to analyze the market on a selected time frame. He defines the mainstream. The Forex General trend indicator provides an opportunity to classify the direction of price movement by determining its strength. Solving this problem helps investors enter the market on time and make good profits.
It does not provide real-time signals, signals arrive late. But nevertheless, it is very effective. You need to read its signals as if it were a zigzag, the principle of receivin

The SPV Volatility indicator is one of the most effective filters. Volatility filter. Shows three volatility options. The so-called limit, real, and the last most effective filter for the filter is the percentage filter. Percentage display of folatility shows the ratio of limit to real volatility. And thus, if we trade in the middle of the channel, then it is necessary to set a condition that the percentage is less than a certain indicator value. If we trade on the channel breakout - following t

Description:
The Wall of Worry indicator allows you to assess market sentiment and possible reversals. The indicator represents three lines that are displayed in a separate window.
Black line (trend) - the amount of volumes in the candle body.
Red line (bears) - the amount of volumes in the upper shadow of the candlestick.
Blue line (bulls) - the amount of volumes in the lower shadow of the candle.
The idea is based on "Wall of Worry" - this is the periodic tendency of financial marke
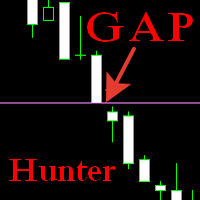
The indicator displays closed and unclosed gaps on a given timeframe and time range. By default, the display of closed gaps is disabled, the search timeframe is the current one. In the flat, it helps to track the direction of the position set by large market participants. In the trend, it shows the points of completion of the position by large market participants. Filters out false pivot points. Another point I wanted to explain, if the parameter Timeframe_for_Search is set to Current in the in

Fully featured Pivots and Levels indicator Pivots: Floor (normal), Woody, Camarilla, Fibonacci Levels: ATR, Historical Volatility with standard deviations, Close Price Volatility with standard deviations
Features: 4 +/- levels MTF, pivots/levels based on Daily, Weekly, 4hr or even 15min Hour and minute time offset
Texts with prices and pip distances to central pivot/level Inputs for Camarilla/Fibonacci/ATR/Volatility levels
Alerts, popup, push, email, sound, live or completed candles on leve

Its free now till Frebruary 15th GIVE ME A GOOD RATING! Helio indicator is a advance version of RSI indicator with more features .
It provides technical information about bullish and bearish price momentum , and is often plotted in “Existed pane below”. An asset is usually considered overbought when the Helio is above 70 and oversold when it is below 30. Add your additional chart analysis to filter the signals further . ITS FREE, GIVE ME A GOOD RATING!
Traders of all experience levels ca
Odyusa Pips is designed to visualize the direction of the trend. This indicator is deprived of delay and therefore very effective. Odyusa Pips determines the direction of the current trend using a cluster digital filter . ITS FREE, GIVE ME A GOOD RATING! Characteristics of the ODYUSA PIPS INDICATOR · Platform: Metatrader4 · Asset: Any available trading assets · Trading Time: Around the clock · Timeframe: Any · Recommended broker: InstaForex , XM , , Rules of trad

I just made it free till 14th February, GIVE ME A GOOD RATING! Pro Blaster is an advanced trading system based on two indicators, each of which in turn is based on the MACD indicator. The system provides signals to enter in the market, which will be understood even by novice traders. ITS FREE, GIVE ME A GOOD RATING! The strategy algorithm has a double trend confirmation and is capable of generating signals. Characteristics of the PRO BLASTER · Platform: Metatrader4 · Currency pair

You don't know what to trade? This is the one for you. Currency Strength (ROC Base) is the easiest way to identify strong and weak currencies. This indicator is a custom-made indicator you can use to determine the currency pairs that are currently trading strongly and the ones that are trading weakly.
This indicator shows the relative strength of 8 major currencies such as AUD, CAD, CHF, EUR, GBP, JPY, NZD, USD. I used a method call " Rate Of Change (ROC) " for calculate all currency in percen

Questo indicatore fractal ti invierà un messaggio telefonico (tramite app mt4) non è necessaria la configurazione dell'indicatore, basta impostare l'ID del tuo smartphone e potrai ricevere il messaggio BUY o SELL in tempo reale (affidabilità 80%)
per qualsiasi domanda o dubbio non esitate a contattarmi su mql5.com o telegram (link al gruppo disponibile in bio)
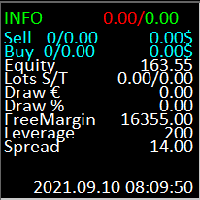
Индикатор информационная панель. 1 строка отображает текущий профит по счету(по всем валютным парам) весь заработанный профит по текущей валютной паре(где стоит индикатор). 2 строка отображает позиции на SELL ордера кол-во открытых ордеров/лотность открытых ордеров и текущий профит по ордерам SELL. 3 строка отображает позиции на BUY ордера кол-во открытых ордеров/лотность открытых ордеров и текущий профит по ордерам BUY/ 4 строка отображает EQUITY. 5 строка отображает лотность закрытых ордеров п
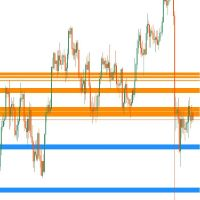
This MT4 indicator can show you Dynamic Support and Resistance Zone in current stage based on Current MA Price in 9 Timeframes, Price Lines or Price Zones for Multi (9) Timeframes according to the setting options as you need which you can set such as MA Period, MA Method, MA Shift, MA Price and you will see price lines all 9 timeframes or you can show Price Zones and also you can hide Minutes timeframes and several setting as you want and You can add several MA Periods in your chart such as 50,

This indicator call "ATR Trend" will display 2 lines on chart, make it easy to trade buy/sell. and also Stop Loss. This Indicator's formula base on standard ATR (Average True Range) function. and I combined it with "Dow Theory" concept. It has 4 parameters. - ATR : Period of ATR it self. - ATR Multiple : Multiple value to display on chart. - Price Mode : Used this price option for check on change to uptrend or downtrend [Open, High, Low, Close, High/Low, (High+Low) / 2, (High+Low+Close) / 3 ,

This support and resistance indicator gives u a)support level b)resistance level c)direction(trend) all in one.The indicator is based on the top 3 best levels there are!Red dots are sell direction and green dots are buy direction,if candles dont break these levels u get in after the 3rd dot,always use higher time frames from h1 up so its more clear where direction is going,also u can set the indicator to your time frame that u are lookin at.
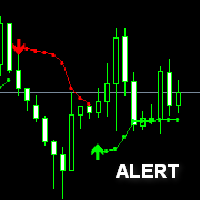
bollinger Stop Alert Indicator is one of the simplest trend-following indicators you may have ever experienced. Besides defining the market trends it also determines possible trend reversal points which are interpreted as trade signals. The bollinger stop can be applied to trade all kinds of forex currency pairs. bollinger Stop Alert Indicator suits all sorts of timeframe charts available within your forex MT4 trading platform thus supports both scalping and day trading. You can also easily cu

*Non-Repainting Indicator "Mercy" is an arrow indicator that shows possible bounce set ups. It's best to Use The M5 and M1 charts for indices. M15 and M5 for forex pairs. I recommend turnkeyforex.com as a great broker and the one I personally use Live signal based on this indicator: Hurican TK -Push notifications to phone or computer -Great For Scalping -Great For Swing Trading -Arrow Appears at The "Close Of The Candle" -Works On Any Timeframe -Works On Any Mt4 Pair -Perfect For New Trader

Forex Signal Generator is a cutting edge technology for Trend Trading, and filtering all inbuilt in one tool. The Signal Generator analysis the market like a Pro by using its smart algorithms to detect the trend, filter out market noise and display on your chart with the : ENTRY, STOPLOSS AND TARGET PROFIT
Advantages You Get
Access to the proven reliable trend indicator based
Easy and effective trend detection.
Gives you the ability to filter out 'NOISE' from the ma

ADX インジケーターは、トレンドとその強さを判断するために使用されます。価格の方向は +DI と -DI の値で示され、ADX 値はトレンドの強さを示します。+DI が -DI より上であれば、市場は上昇傾向にあり、反対であれば下降傾向にあります。ADX が 20 より下であれば、明確な方向性はありません。インジケーターがこのレベルを突破するとすぐに、中程度の強さのトレンドが始まります。40 を超える値は、強いトレンド (下降トレンドまたは上昇トレンド) を示します。
平均方向性指数 (ADX) インジケーターの複数通貨および複数時間枠の変更。パラメータで任意の通貨と時間枠を指定できます。また、インジケーターは、トレンドの強さのレベルが交差したとき、および +DI と -DI のラインが交差したときに通知を送信できます。ピリオドの付いたセルをクリックすると、このシンボルと期間が開きます。これが MTF スキャナーです。
通貨強度メーター (CSM) と同様に、ダッシュボードは、指定された通貨を含むペア、またはその通貨を基本通貨とするペアを自動的に選択できます。インジケーター

この指標は、他のチャート指標に関連するチャネルを作成します: 指標 + ATR および指標 - ATR .価格がベースラインから上がりすぎていないかどうかを知るのに役立ちます。 ATR レベルは乗数で調整できます。 このバージョンは、MT4 の制限の一部を回避するために、対応する MT5 よりも複雑です。ベースラインの name 、 パラメーター (コンマで区切られた文字列)、および buffer を導入する必要があります。ベースラインに必要なすべての値が 1 つ のバッファーのみに含まれていることを確認してください (または、複数のインスタンスを配置する必要がある場合があります)。
ベースラインの文字列パラメータ はサポート されていません。導入された値に関係なく、デフォルト値が常に使用されます。 列挙子の場合は、その位置を使用します (ほとんどの場合、0 から始まります)。たとえば、MA モードの場合: sma=0;絵馬=1;スマ=2; lwma=3
利点として、このインジケーターは元のベースラインも表示するため、3 つの線すべてが同じインジケーターに表示されます。特別
FREE

Description Better version of MACD indicator which offer a complete visual trading strategy and realize an auto-optimization
KEY LINKS: How to Install – Frequent Questions - All Products How is this indicator useful? NEVER repaints. Detect best parameters of MACD indicator, based on profit factor during the specified period. This indicator can be used as a visual strategy, following the recommendations of entry, stop, and targets. Indicator features It can be used as a complete trading s

This indicator finds technical analysis reversal patterns such as Double Bottom, Triple Bottom, Head & Shoulders and their opposite counterparts. The indicator shows them on the chart of a currency pair and can signal a trader if a pattern has been formed recently. This allows you to quickly detect a possible trend reversal or correction, it is enough to add an indicator to the chart, after that, you can change different timeframes to quickly find such patterns, if the patterns are not located

This is an original, agile, and excellent trending system. Whether you are a beginner trading novice or a professional trader, this set of indicators can help you quickly and timely track the latest changes in market trends. It has the following characteristics: The method of use is extremely simple, plug and play, and the display of all trend analysis results is clear at a glance; There is no need to configure any functional parameters, the trend tracking indicator will automatically analyze th
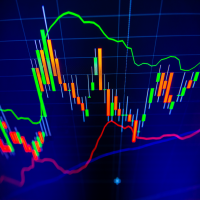
The indicator calculates reversal points based on the past trend and forms a channel (outer) on this basis. This elapsed time span from which the reversal points are determined can be specified in the settings.
An inner channel is also drawn in white. The trend continues in this channel, if there is a sideways trend. Here the upper / lower line form the possible turning point.
The indicator is suitable for all trading areas, whether forex, crypto, metals, indices or futures. All areas trade

Channels indicator does not repaint as its based on projecting the falling and raising channels. As a trader you need a path to be able to place your buy and sell trades such as: Supply and Demand , Falling & raising channels. Falling and raising channels can be in any time frame and also can be in all time frames at the same time and the price always flows within these channels. Experienced trades will draw the key levels and channels around the timeframes. But, they will not be able to draw
FREE

See RSI values turned into colored candles
This indicator provides both colored candles and a colored moving average. 6 drawaing styles are provided to allow customization of the color coding.
Applying coding to the chart may help in conceptualizing price trend and impulse movements defined through RSI values.
Features - optional colored candles - optional colored ma - 6 draw styles; RSI slope RSI above/below overbought/oversold levels RSI above/below level 50 RSI above/below it's moving aver
FREE

ToolBox 360 is the swiss knife of all indicators. It is full packed with useful tools to help you with your trading. It can be used to find best entry and exit points and help you to decide if you should open a trade or not. It shows market trends, candlestick formations outside / inside bars and you can sett time based allerts.
Main features:
Time based Fibonacci lines Choose a start and end time and the indicator shows you Fibonacci lines within the selected time range including range high

Toroid - The indicator reflects information in a visual form, it can be used both for pipsing on small periods and for long-term trading. It generates fairly frequent and accurate signals. The indicator can be used as the main one for determining the trend. The indicator can work both for entry points and as a filter. Uses two parameters for settings. The smart indicator algorithm detects the trend, filters out market noise and generates input signals. It is based on the signals of elementary in
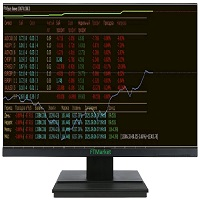
Are you looking for monitoring services to watch trading in the terminal?? You don't need it anymore!! Full monitoring is right in your terminal. There are a couple of strokes left and you can buy it both for real and for a demo test Параметры Parameters:
Max///Statistics Month///Statistics A week///Statistics Day///Statistics
For an open pair:
Symbol Number of orders To buy In villages Density separation Buy profit Sell profit Weekly profit Total profit Drawdown
There is also a built-i
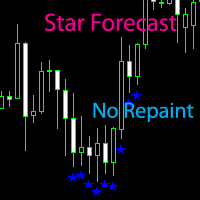
Star forecast is an analytical toolkit used to help currency traders with foreign exchange trading analysis through technical charts and indicators. Forex forecasting which help analysts and traders to determine appropriate and profitable entry and exit points for their forex trades. *Non-Repainting *For Desktop MT4 Only *Great For Intraday
*Great For Swing Trading *Star Appears at The "Close Of The Candle" *Attach On H1 Timeframe for see Daily Trend
*Works On Any Mt4 Pair *Perfect For New Tr
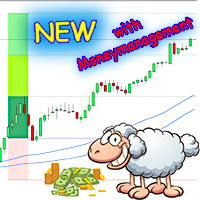
Bring the "sheep" into the dry.
The blue channel represents the river. The "sheep" have to be brought into the dry over this river so that they can graze on the pasture. Whereby the "sheep" are the candles and the "grazing" are the profit.
Entry for long trades is the high of the first candle, which closes completely above the channel. Reversed accordingly for shorts.
Stop Loss as you please. It is best to be below the last low. Take Profit can either be set according to CRV, according

Supply and Demand indicator does not repaint as it counts the number of tests/retests occurred in the past x number of times. As a trader you need a path to be able to place your buy and sell trades such as: Supply and Demand, Falling & raising channels . Experienced trades will draw the key levels and channels around the timeframes. But, they will not be able to draw them on the small time frames as the price changes too frequent. This indicator is based on Shved supply and demand indicator, b
FREE

Indicator support for only: Entry Point to Trend Pro Link indicator support : https://www.mql5.com/en/market/product/70867
Supports all currency pairs declared in the definition. Help investors do not need to open many charts. Notice the DEAL: multiple time frames confluence M15, H1, H4.
Entry Point to Trend Pro The indicator helps investors to identify the earliest and perfect reversal point. Easy to make decision to trade with the trend Price action trading. support resistance
FREE

a novel indicator by the maker of velvet.
FREE
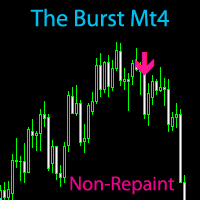
The Burst MT4 Hurry and Buy Before Price Doubles Tomorrow! *Non-Repainting Indicator "The Burst" is an indicator that shows precise Buy and Sell Trades. A great arsenal to add to any chart. It's Best to Use The D1,H4 or H1 chart "The Burst" is designed to alert BUY and SELLS. So Of course, For the best take The Arrows In a Uptrend or Downtrend Only For Confirmation
*Non-Repainting *For Desktop MT4 Only *Great For Scalping *Great For Intraday
*Great For Swing Trading *Arrow Appears at The "Clo
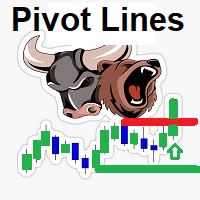
::: FREE FOR A LIMITED TIME !!!! the Smart Pivot Lines detection indicator It detects market direction By identifying super candles and major support resistance levels It detects the major breakout Candles amplified by the volume and Candle body size and shows it in a separate window to give a great indication of market power and direction Support resistance lines are detected by a unique strategy using tick volumes , bars patterns and bars size
- if Bears dominates :: Price will be below

Индикатор предназначен для переключения ТФ. Если у вас стоит советник который зависит от текущего ТФ, тогда это вещица вам необходима. Выставление ТФ происходит по количеству ордеров или по набранной лотности. К примеру, для ясности, если ваш советник начинает просаживаться, набирая сетку, то индикатор переключает ТФ автоматически, на увеличение ТФ и не даёт набирать лотность. Как только он закрыл сетку, происходит автопереключение на М1 и по новой. Так ваш советник торгует как скальпер и далее

このインディケータは、極値から3周期のセマフォと反転パターン123を構築する。シグナルは、2本目のローソク足の始点で発信されます。 このパターンは、さまざまな方法(テストポイント3、ブレイクアウト、その他)で取引することができます。チャネルの出口、またはトレンドラインのブレイクアウトは、エントリーポイントを見つけるための主なトリガーです。 アイコンはフィボナッチレベルに応じて色分けされています。黄色のアイコンは、シグナルが増幅されるレベルのテストを示します。 多通貨ダッシュボードを使用すると、123パターンがどの通貨ペアで発見され、何本のバーがそれに続いたかを追跡することができます。 フラクタル・ジグザグがベース。再描画可能。したがって、リンク先のブログでストラテジーを研究してください - 123 Fractal Trading With UPD1 。
入力パラメータ。
Bars Count – 表示する履歴。 Tooltip - オブジェクトの上にカーソルを置いたときにツールチップを表示するかどうか。 Show Semaphore - セマフォを有効、無効にします。
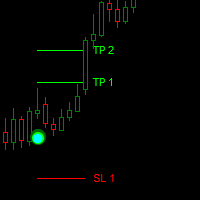
Dark Point is an Indicator for intraday trading. This Indicator is based on Trend Following strategy, also adopting the use of the atr to determine the right volatility. We can enter in good price with this Indicator, in order to follow the strong trend on the current instrument. If you love Dark Point, consider adding some power: Dark Power
Key benefits
Easily visible take profit/stop loss lines Intuitive directional points/arrows by colors Useful statistics , which indicate the win
FREE

スキャルピング動的システム-価格逆転を決定するための動的システム。インディケータはチャート上で価格反転ポイントを探し、これらの場所に矢印を置きます。インジケーターが青い矢印を描くと、価格が逆転する可能性が高くなります。インジケーターが赤い矢印を描くと、価格が下落する可能性が高くなります。取引プロセスでのこのインジケーターの使用は非常に簡単です。説明の下のビデオでは、このインジケーターを使用して取引する方法を詳しく示します。インジケーターは、チャート上に赤と青の十字も描画します。それらはチャートのトップとボトムを表示するように設計されています。これらは抵抗のポイントです。
インジケーターの利点: スキャルピング用に設計されています。 すべての時間枠で動作します。 すべての通貨ペアで機能します。 矢印を再描画しません。 EMAILおよびPUSH信号を送信します。 ロボットに統合することができます。 設定は非常に簡単です。 専門家と初心者の両方に適しています。 動的システムインジケーター設定のスキャルピング: 期間-指標期間。 バー-インジケーターが表示されるチャート上のろうそくの数。

3 strategies with RSI! Alerts! Signal freshness check! The indicator is based on the classic RSI. I recommend watching my advisor - Night Zen EA It includes 3 strategies: Entry of the RSI indicator into the overbought zone (for buy trades) / oversold (for sell trades) Exit of the RSI indicator from the overbought zone (for sell trades) / oversold (for buy trades) Touching the overbought limit (for sell trades) / oversold (for buy trades) The indicator provides alerts. To enable them in the s
FREE

Emergency trend technical indicator is used to analyze price movements in the Forex market. It is included in the so-called arrow indicators. And it is very practical in that it forms arrows in places where buy signals appear, or, conversely, sell signals.
Naturally, do not forget that any indicator is just an assistant, not a magical tool, by the will of which you will become fabulously rich.
Unfortunately, many novice traders forget about this, they see a potential grail in each indicator
Channel indicator Forex Signal Jurassic is designed for the fact that the price will continue to move within the channel, but not for a long time. The channel does not always intersect with the price, when the price goes beyond the channel boundaries, it can be closed with stops. The indicator assumes selling when the resistance level is reached and buying at the support level. Also, the required points are indicated by arrows, and the indicator uses a custom filter to limit some signals. Positi

Specifically speaking about this indicator (Truman), its signals are very accurate and there is no redrawing. At least this is not an unimportant factor. First of all, I want to note that this indicator is universal and is perfect for almost all underlying assets.
Let's talk in more detail about this indicator and see how to apply it in practice. Before us is a rather simple and unpretentious indicator-switchman. The indicator displays both a line of different colors and arrows to which you c

The Joker trend step indicator analyzes the state of the market, the phase of its movement and largely determines the success of a trader in his difficult work. Many newcomers who first enter the market are often more fortunate than a professional who has spent years learning. The reason for this phenomenon is the unconscious falling of newcomers into the trend, when, even without any indicators, it becomes clear where the market is heading. But the Joker indicator will give you stability if you

City Lights monitors the formation of the trend and helps the user to identify the entry points. Thanks to this data, the investor is able to predict the situation and form a strategy for the game. It is trend signals that allow clients of brokerage companies to achieve the efficiency of using trading instruments and achieve the best profitability.
Correct calculation of the current trend is the key to successful asset trading in the foreign exchange market. It is important to understand that
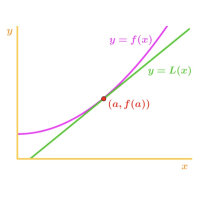
Second Derivative RSI is a forex indicator based on all familiar RSI, based on the second derivative of the price function.
Just a note on the use of the indicator. The indicator requires selection of settings not only for each currency pair but also for each timeframe. If there is no setting, then as a last resort, the indicator may not show signals! In order to pick up the settings, just use a bot that will help you do it.
The indicator combines the functionality of an oscillator and a tr

Trading with the Uniq Trend indicator is as simple as possible, if a blue arrow pointing up appears on the chart, a buy trade is opened. In the same case, if you see a red arrow pointing in the downward direction, open a sell order.
That is, everything is as simple as possible, positions are closed in the opposite way, that is, as soon as a signal is received to open an order in the direction opposite to your position. For example, you opened a long position (for sale), close it when a red ar

A flexible 2-Line MACD indicator The default MACD indicator inside MT4, limits you to using the MACD with a fast-EMA, slow-EMA, and signal-SMA. This MACD indicator allows you to set your own MA-Method choices for these 3 components, separately! You can select from SMA-EMA-SMMA-LWMA-DEMA-TEMA, and can even use a separate method for each 3 fast-slow-signal periods. On-chart colored candles, with drawing condition types is included, with a show/hide button too.
Features - MA Methods: SMA, EMA, S

Citizen Trend defines the mainstream of the market. Easy to set up and works on all pairs and all time frames. The Citizen Trend indicator provides an opportunity to classify the direction of price movement by determining its strength. It is easy to trade on it, watch how the line changes and act accordingly.
It is extremely important for any trader to correctly determine the direction and strength of the trend movement. Unfortunately, there is no single correct solution to this problem. Many

PSI tools delivers new special look aimed to bring Detailed Account Statement for all important statistics. The integrated MT4 is not accurate. It does not account correctly for Deposits, Withdrawals and completely ignores cases like hedged trades, break-even trades, other broker related credits, bonuses and so on events and as a result all statistics like draw-down, total trades, average win size, rate and so on are totally skewed. PSI corrects these mistakes. In the example below a demo accou

For anyone studying forex charts, the aim is to identify trends, and spot reversals. If you have years of experience it may be easy, but most of us need something to make the trend apparent. If you're familiar with the popular renko charting method, you know that it was developed for this purpose. But renko charting has a flaw; the trend is often broken by false reversals. So I developed my own version - the Kenko Trend Indicator. The kenko trend indicator draws renko style trend following blo

NEXT PRICE 99$ Alert Everything ToolBox divergence And Moving Cross: Buy "ALERT EVERYTHING" at 99$ and receive 1 EA for free (* for ONE trade accounts)
THIS EA IS GIFT : https://www.mql5.com/en/market/product/63710
1. 4 Moving Average Cross Alert. 2. MACD divergence Alert 3. Indicators Alerting( ICHIMUKO /RSI/CCI/MACD/STOCH) 4. Pattern Alert 5. Draw Daily Support / Resistance 6. Display Some information on chart.
If you need help :
My WhatsUp Number: +989020473963 : if you want to
MetaTraderマーケットは、開発者がトレーディングアプリを販売するシンプルで便利なサイトです。
プロダクトを投稿するのをお手伝いし、マーケットのためにプロダクト記載を準備する方法を説明します。マーケットのすべてのアプリは暗号化によって守られ、購入者のコンピュータでしか動作しません。違法なコピーは不可能です。
取引の機会を逃しています。
- 無料取引アプリ
- 8千を超えるシグナルをコピー
- 金融ニュースで金融マーケットを探索
新規登録
ログイン