YouTubeにあるマーケットチュートリアルビデオをご覧ください
ロボットや指標を購入する
仮想ホスティングで
EAを実行
EAを実行
ロボットや指標を購入前にテストする
マーケットで収入を得る
販売のためにプロダクトをプレゼンテーションする方法
MetaTrader 4のための新しいテクニカル指標 - 4
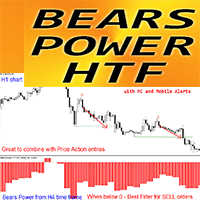
MT4 用 Forex インジケーター Bears Power HTF
Bears Power HTF オシレーターは、「売り」エントリーに最適なフィルターです。HTF は Higher Time Frame を意味します Bulls および Bears Power インジケーターは、トレーディングで対応するトレンドの強さを測定するために使用されます Bears Power は、売り手のポジションの強さを測定します Bears Power HTF インジケーターは、プライス アクション エントリーを使用するか、他のインジケーターと組み合わせて使用するマルチタイム フレーム トレーディング システムに最適です。 このインジケーターを使用すると、Higher Time Frame の Bears Power を現在のチャートに添付できます。 インジケーターには、0 レベル クロスのモバイルおよび PC アラートが組み込まれています
// より優れたエキスパート アドバイザーとインジケーターは、こちらで入手できます: https://www.mql5.com/en/users/
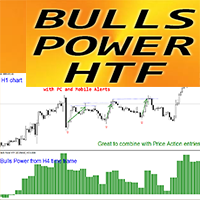
MT4 用 Forex インジケーター Bulls Power HTF
Bulls Power HTF オシレーターは、「買い」エントリーに最適なフィルターです。HTF は Higher Time Frame を意味します Bulls Power インジケーターと Bears Power インジケーターは、トレーディングで対応するトレンドの強さを測定するために使用されます Bulls Power は、買い手のポジションの強さを測定します。 Bulls Power HTF インジケーターは、プライス アクション エントリーを使用するか、他のインジケーターと組み合わせて使用するマルチタイム フレーム トレーディング システムに最適です。 このインジケーターを使用すると、Higher Time Frame の Bulls Power を現在のチャートに添付できます。 インジケーターには、0 レベル クロスのモバイルおよび PC アラートが組み込まれています
// より優れたエキスパート アドバイザーとインジケーターは、こちらで入手できます: https://www.mql5.c
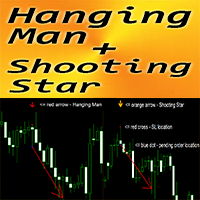
MT4 用 Forex インジケーター「ハンギング マンとシューティング スター パターン」
インジケーター「ハンギング マンとシューティング スター パターン」は、プライス アクション トレーディングに非常に強力なインジケーターです。再描画や遅延はありません。 インジケーターは、チャート上で弱気のハンギングマンとシューティングスターパターンを検出します: 弱気のハンギングマン - チャート上の赤い矢印シグナル (画像を参照) 弱気のシューティングスター - チャート上のオレンジ色の矢印シグナル (画像を参照) PC、モバイル、および電子メールアラートが含まれています インジケーター「ハンギングマンとシューティングスター」は、サポート/レジスタンスレベルと組み合わせるのに最適です: https://www.mql5.com/en/market/product/100903
// より優れたエキスパートアドバイザーとインジケーターは、こちらで入手できます: https://www.mql5.com/en/users/def1380/seller // また、収益性が高く、安定的
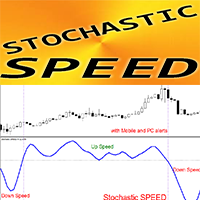
MT4 向け Forex インジケーター「Stochastic Speed」 - 優れた予測ツールです!
このインジケーターの計算は物理学の方程式に基づいています。ストキャスティクス スピードは、ストキャスティクス自体の 1 次導関数です。 ストキャスティクス スピードは、ストキャスティクスが売られ過ぎ/買われ過ぎゾーンにあり、スピードがリバウンド フックを形成しているときに、スキャルピング エントリに最適です (画像を参照)。 モメンタム トレーディング戦略には、ストキャスティクス スピード インジケーターの使用をお勧めします。 ストキャスティクス スピードが 0 を超える場合 - これは正の速度です: 価格のモメンタムが上昇します。 ストキャスティクス スピードが 0 を下回る場合 - これは負の速度です: 価格のモメンタムが下降します。 ストキャスティクス スピード インジケーターは、ストキャスティクス自体が方向を変える速度を示します - 非常に敏感です。 インジケーターには、モバイルおよび PC アラートが組み込まれています。
// より優れたエキスパート アドバイザ
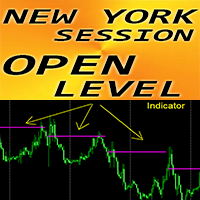
MT4 用 Forex インジケーター「ニューヨーク セッション オープン レベル」
インジケーター「ニューヨーク セッション オープン レベル」は、日中取引に非常に役立つ補助インジケーターです セッション オープン価格レベルは、日中に価格がそのエリアに戻ることが多いため、非常に重要です。 インジケーターは、各日の NY セッション オープン価格レベルを毎日表示します また、インジケーターは月曜日に週オープン レベルを表示します 日中取引を行うトレーダーがターゲットを設定したり、サポート/レジスタンス エリアとして使用したりするのに役立ちます。
// より優れたエキスパート アドバイザーとインジケーターは、こちらで入手できます: https://www.mql5.com/en/users/def1380/seller // また、収益性が高く、安定的で信頼性の高いシグナルに参加することもできます https://www.mql5.com/en/signals/1887493 これは、この MQL5 Web サイトでのみ提供されるオリジナル製品です。

FREE UNLIMITED PM : https://linktr.ee/ARFXAUTOTRADE?utm_source=linktree_admin_share
Trend Line is very useful for trader friends, both for mapping following trends and counter trends, here I am sharing an auto trend line indicator I made that you can use to make it easier for you to see the market.
How to use trend line:
01. Follow our trend, wait for the trend line to return and touch our trend line and form a continuation pattern on the candle stick 02. Counter Trend We wait for 1 ca
FREE
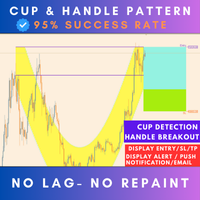
Live Trading Results MT5 Version Contact for Manual Guide Next Price $125 Free Scanner Dashboard (Contact me) Strategy - Breakout / Retest / Aggressive Hello Everyone, We are excited to introduce one of the most reliable and high win rate patterns in trading: the Cup and Handle . This is the first time we are releasing this meticulously crafted indicator, boasting an impressive 95% success rate . It is versatile and effective across all types of pairs, stocks, indices,

FREE UNLIMITED PM : https://linktr.ee/ARFXAUTOTRADE?utm_source=linktree_admin_share
Fibo Musang Break ReeTes is used as confirmation and mapping when making an entry, and generally this indicator will form when the candle makes a breakout (Mother candle or Snr). To make this indicator easier, I created an auto draw Fibo and I added a multi time frame function to the awesome oscillator indicator to make it easier to read trend verification using multi time monitoring.
The following are the
FREE
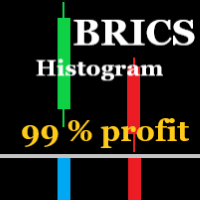
BRICS HISTOGRAMĂ Bun venit ! Cumpăra din bara albă a histogramei. Vindeți la bara galbenă a histogramei. Acest indicator este indicatorul săgeților BRICS transformat într-un indicator histogramă. Pe AUDCHF, GBPUSD, AUDJPY, NZDUSD, USDJPY funcționează foarte bine. Eu recomand – GBPUSD, M15, SL = 0 sâmburi, TP = 10 sâmburi minim. El funcționează în mod constant cu rezultate foarte bune. Alt Perechile pot da semnale mai rare sau pot avea unele pierderi sau nu funcționează. Indicatoare

"Trend Finder" is a trend trading strategy that combines market noise filtration and all necessary functions in one tool! The system automatically displays entry and exit points using arrows. Only one parameter is sufficient for configuration. It offers simple, intuitively understandable, and effective trend detection. The intelligent algorithm of the "Trend Finder" indicator identifies potential market reversal points. Often, a good trend can be visually observed on the price chart. However, a

The Tin indicator is designed to visually display the current trend in the market. One of the key aspects of foreign exchange market analysis is to determine the trend, which is the sustainable direction of price movement. To do this, the Tin indicator uses algorithms that smooth out sharp fluctuations that do not have a significant impact on the overall trend.
A trend can be either upward (bullish) or downward (bearish). Typically, a trend persists for a long time before abruptly changing di

Liquidity Pro The Liquidity Pro pin points liquidity zones in any financial instrument, including currency pairs, cryptocurrencies, commodities, equities and indices. The Liquidity Pro shows previous and current liquidity zones, down to the present minute, providing essential information about your chosen trading pair, when conducting chart analysis or initiating trades. Remember each trading pair requires a different price separation value for M5, M15 and M30 Tally, to provide accurate data. Y

The indicator calculates delta, the difference in tick volumes between buyers and sellers.
Displays the imbalance of market purchases and sales.
Delta imbalance is a special style of presentation based on the ratio of supply and demand volumes
Using the indicator in real trading mode, you can observe the behavior of the mood of large market participants, thereby you can visually see who currently controls the price and maintains further control.
You can also see the absence of large v

Chart Clarity Dashboard The Chart Clarity Dashboard provides clear insights into price movements for various financial instruments like currency pairs, cryptocurrencies, equities, commodities, and indices. This dashboard displays detailed price information in real-time, making it easier for traders to make decisions quickly. It shows price movements down to the second, giving you essential data before you trade or analyze charts. Chart Clarity Dashboard allows you to monitor price changes acros

Backtest with good trend detection results from January 2023
EURUSD Time frame: m15, m30, H1
AUDUSD Time frame: m15, m30 NASDAQ Time frame: m15 S&P 500 Time frame: m15, m30 XAUUSD Time frame: m30 BTCUSD Time frame: H4
These are just some of the assets tested (Please note that past results are no guarantee of future results). Note that this is not a complete strategy, you can use this indicator as an entry trigger after your analysis by setting stop loss and take profit values that you d
Cumpără Vinde semnal M15
Bine ați revenit pe pagina noastră.
Cumpărați semnalul de vânzare Indicatorul M15 funcționează cel mai bine pe M15. Pe intervale mai lungi de timp, semnalele sunt mai rare.
Este un indicator de tip oscilator.
Aș recomanda o țintă de profit de 10 sâmburi sau la primul nivel de suport sau rezistență etc.
Poate fi folosit cu succes pe M5.
Feriți-vă de stop-loss. Ar trebui plasat astfel încât să nu fie lovit de mișcări aleatorii ale prețurilor.
Noroc!

Volume Clarity Pro The Volume Clarity Pro provides clarity in the movement of price for any financial instrument, including currency pairs, cryptocurrencies, equities, commodities and indices. The Volume Clarity Pro maps out where price is consolidating, retracing, resisting or settled in areas of support. The Volume Clarity Pro accurately displays the month's price action, offering crucial data about your selected trading pair for chart analysis and trade initiation. The Volume Clarity Pro is

The Your Honor trend indicator is based on price divergence and is designed to analyze and determine market entry points. It can also be used as a filter in trading. The indicator has only two parameters: Period and Level. The Level parameter helps eliminate unnecessary signals. For example, for EURUSD the Level can be set, for example, to 0.0001. Your Honor can be used to both identify entry points and filter signals. The indicator displays information in a clear manner. It is important to reme
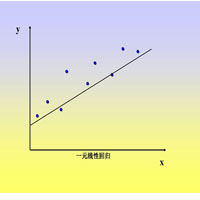
This index is used to calculate the linear regression slope of the K line in a period of time. The algorithm adopts the least square method.
1. Suitable for each cycle chart.
2. Can be used to calculate opening price, closing price, high price, low price, middle price.
3. Specify the start time and end time in the parameters.
Note that the start time and end time cannot be weekends, select the calculated price, pay attention to capital letters.
FREE
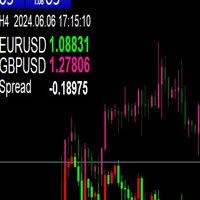
This indicator can be used to add a candle chart of another variety to the chart of the current variety.
1. The chart height will be adjusted automatically
2. If you switch the current icon period, the K of another variety will also switch to the corresponding period
3. In the upper left corner of the chart, the current cycle, the current time, and the current price and spread of the two targets will be displayed.
4. When switching cycle, due to a large number of data retrieval, it wi
FREE

The indicator is a set of parameters for setting three moving averages (fast, medium and slow), which can be used to analyze the market.
This indicator provides the ability to analyze market trends and make trading decisions based on the intersections of various moving averages. It also supports audio alerts for timely notification of trading signals.
LengthFaster: Sets the number of candles used to calculate the faster moving average. A value of 5 means using price data from the last 5 can
This indicator implements the following idea: if the current closing price (or the current average price) overcomes the smoothed value of the minimum/maximum prices for the selected period, this indicates a change in trend. The indicator effectively follows price movements in trending areas of the market and clearly demonstrates areas of sideways price movement. The product can be useful for both beginners and experienced traders as it is easy to use and intuitive. The indicator allows you to se

RSI With Alert
Relative strength index (RSI) indicator is a popular technical indicator in the family of oscillators.
RSI oscillates between 0 and 100 and traders use it to spot overbought and oversold states in the market.
Typically, a value above 70 means that the instrument is overbought and due to a retracement. A value below 30 means that the trading instrument is oversold.
RSI indicator strategies
This indicator allows you to get notifications when some conditions trigger. You c
FREE
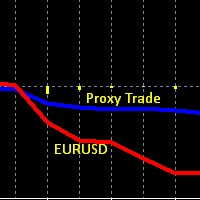
This is an obscure Hedge Fund like strategy, based one of our early indicators on EURUSD originally intended for day trading, while developing and testing the indicator we found out that the data used in this indicator (set of 4 currency pairs) follows EURUSD in a very peculiar way. On one hand these two are correlated, but the 4 currency proxy set tends to lag behind EURUSD, it lags on a day to day basis, and then catches up eventually after several days. And therefore can be used as a proxy

YK-Fibo Pivot Indicator: Trade Smarter with Fibonacci Pivot Points The YK-Fibo Pivot Indicator is a powerful technical analysis tool that combines the precision of Fibonacci retracements with the insights of Pivot Points. Whether you're a novice or seasoned trader, this indicator empowers you to spot profitable opportunities in the market with ease. Why Choose YK-Fibo Pivot? Pinpoint Support & Resistance: By calculating Fibonacci levels based on the previous day's high, low, and close prices, y

Introducing Smart Gold Pro, a versatile trading indicator suitable for all experience levels. It provides precise buy and sell signals for the gold market, adaptable to any timeframe. Powered by advanced algorithms, Smart Gold Pro accurately analyzes price movements and volume dynamics. What sets Smart Gold Pro apart is its reliability—it doesn't repaint past signals, ensuring dependable insights into potential market reversals. Its user-friendly visual interface on the chart, along with audible
Description of Using the Dynamic HL Breakouts Indicator The Dynamic HL Breakouts indicator is a technical tool designed for trading trend-following assets. Its main purpose is to help traders identify key entry and exit points during strong trending periods of an asset. Components of the Dynamic HL Breakouts Indicator Highs and Lows This indicator calculates and displays the High and Low values for a specified period (e.g., the past 20 days) to create a price movement range for the asset. These

* Pivot Points Magic : Effortlessly Plot Pivot Levels on Any Chart**
Pivot Points Magic simplifies the process of identifying critical pivot levels on any chart, across all timeframes. With just a few clicks, traders can instantly visualize pivot points, enabling them to make more informed trading decisions.
We value your feedback! Share your experience with Pivot Points Magic and help us improve. Your reviews and suggestions are essential for shaping future updates and enhancements to the

The RPO (Relative Price Oscillator) is a technical analysis indicator used in Forex trading to measure the momentum and trend strength of a currency pair. It is derived from the Relative Strength Index (RSI) but focuses on the difference between two moving averages of price, usually the closing price, over different periods. The RPO is similar to the MACD (Moving Average Convergence Divergence) but uses relative price levels instead of absolute price levels. Key Components: Short-Term Moving Ave

Description of Fibonacci Levels for Support and Resistance (SNR) with a Statistical Model Fibonacci levels are widely used in technical analysis to identify potential support and resistance levels in financial markets. These levels are derived from the Fibonacci sequence, a mathematical sequence where each number is the sum of the two preceding ones. The key Fibonacci retracement levels are 23.6%, 38.2%, 50%, 61.8%, and 100%.
この強力なツールは、トレンドラインを自動的に識別し、取引戦略を合理化し、より多くの情報に基づいた決定を下すのに役立ちます。 mt5バージョン
重要な機能 自動トレンドライン検出 :「基本的なトレンドライン」インジケーターは、潜在的なトレンドラインの市場をスキャンし、チャートに即座に表示します。これにより、貴重な時間を節約し、重要な傾向を見逃すことはありません。 ユーザーフレンドリーパネル :私たちのインジケータには、さまざまなトレンドラインを簡単に描画できる美しく直感的なパネルが付属しています。パネルは、すべてのエクスペリエンスレベルのトレーダー向けに設計されているため、数回クリックしてトレンドラインを追加、編集、または削除できます。 お気に入りのトレンドラインを保存して管理 :あなたにとって最も重要なトレンドラインを追跡します。私たちのインジケータを使用すると、好みのトレンドラインを保存し、チャートを再訪するたびに常に利用できるようにします。 汎用アプリケーション :外国為替、株、または暗号通貨を取引しているかどうかにかかわらず、「基本的なトレンドライン」インジケーターはさまざま
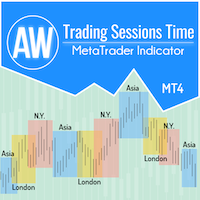
トレーダーが市場のパフォーマンスに関するデータを取得し、より適切な取引戦略を立てる際の利便性のために、当社は取引セッションインジケーターを開発しました。さまざまな取引所の営業時間は、市場活動や取引量に影響を与えるため、取引に影響します。これらの要因によって、さまざまな商品のボラティリティと取引機会が決まります。 AW トレーディング セッション インジケーターは、アジア、ロンドン、ニューヨーク市場の取引時間を表示します。トレーダーは、より良い体験のために、さまざまなタイム ゾーンを表示または非表示にすることができます。チャートでは、セッションの終了までの時間と、取引セッションのサイズを確認できます。チャート上のデータの表示には、さまざまなスタイルの取引チャートに適した柔軟なグラフィック調整機能があります。
その他の製品 -> こちら
利点:
アジア、ロンドン、ニューヨークの取引セッションを表示します。 必要に応じてセッションサイズを数字で表示します。 オンにすると、取引セッションの終了までの時間が表示されます。 取引セッションは個別に無効にすることができます。 チャート上の
FREE
WONNFX iN M5 - Arrow indicator for Forex and Binary Options. Reliable signal algorithm. Indicator not repaint. Indicator working hours: 21:55-23:00. GMT+2. Average winrate = 60-70%.
Recommendations: Timeframe: M5. Expiration: 2-3 candles (1 candle = 5 minutes) Symbol: EURUSD, USDJPY, EURAUD, GBPAUD, EURJPY, AUDUSD, USDCAD, NZDUSD, AUDCAD, AUDCHF, AUDJPY, AUDNZD, CADJPY, EURCAD, EURGBP, GBPUSD, GBPCAD, NZDJPY, CADJPY, XAUUSD
FREE


Introducing our exciting new Price Retest indicator! Get instant alerts when the price retests, giving you a powerful edge in your trading strategy. Remember to do your own analysis before making any moves in the market. MT5 Version - https://www.mql5.com/en/market/product/118159/ Here’s a detailed explanation of how the Price Retest indicator works, its components, and how you can incorporate it into your trading strategy: The Price Retest indicator is designed to notify traders when the pric
FREE

Renko Masterx は、練行チャートで取引するために設計された mt4 矢印タイプのインジケーターです。このインジケーターには、勝率や獲得ポイントなどの役立つ情報をトレーダーに提供するバックテスト パネルがあり、ATR x 乗算の tp と sl も提供します。この O O インジケーターオープンバーまたはイントラバーでシグナルを提供し、シグナルが与えられた場所の正確な価格を示す白いマーカーを備えています。このインジケーターの使用方法は、インジケーターが示す矢印に従って買いまたは売りを開始することです。また、インジケーターが示すように TP と SL を確立します。
パラメーター:
マスター期間:信号期間
TP ATR: 利益価値を利用してあらゆるシグナルを活用します
SL ATR: 各信号を活用するためのストップロス値
ATR PERIOD: tp/sl 値は、この ATR 値を乗算して生成されます
TIME FILTER – 使用すると、インジケーターはこのフィルター内の日付によって提供されるシグナルに基づいて損益統計を提供します。
MISC:

スパイダー練行矢印は、バーオープン/バー内でシグナルを与え、シグナルをプロットするために2つの戦略を使用する練行ベースの矢印インジケーターです。 このインジケーターは、設定でより高い期間で使用した場合、1 バー TP のスキャルピングまたはスイングトレードに使用できます。 このインジケーターは再ペイントやバックペイントを行うことはありません。 ================================================= ======= パラメーター : エントリー期間 : メイン信号期間 Filter Period : 信号フィルター周期 アラート ================================================= =======
使い方 :
矢印が表示されたのと同じ瞬間に取引を開始し、オープンバーで発生するシグナルを受け取る方がよい (シグナルの 90% がそうである)
購入後にお送りするフィルターを使用して、トレンドの方向をフィルターします。
逆シグナルまたは自分の好みの出口メンタリティで市場から退場することも

バイナリATMは、2つの部分に基づいているバイナリーオプションシグナルインジケータであり、最初のものは、トレンドの方向を伝え、買いのみで売りを指示する色付きの線の形にあり、2番目のものは、BAR OPENに来て、決して再描画されず、遅延しないドットの形をしたエントリーシグナルです。
使い方 :
前のバーが売りラインの色を持っていた場合、売りを開くよりも売りドットが開いているバーに表示されるのを待ちます、有効期限は同じローソク足の終値です
前のバーが買いラインの色を持っていた場合、買いを開くよりもバーのオープンに買いドットが表示されるのを待つと、有効期限は同じローソク足のクローズになります
==============================
パラメーター:
エントリーシグナル期間
フィルタ行期間
フィルタライン乗数
アラート
色
==============================

We have combined all of our beloved indicators the likes of: Key level order block , Key level supply and demand , Key level liquidity grab and Key level wedge into one single indicator and dashboard.
Whats new Dashboard : There is an easy access dashboard for all your needs. Multi-timeframe button : There is now a multi-timeframe option for Order Blocks and Supply and demand zones, making it easy to see higher timeframe zones easily on the current timeframe by just clicking the desired timefr
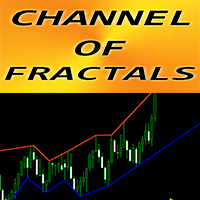
MT4 向け Forex インジケーター「CHANNEL of FRACTALS」
このインジケーターは、フラクタルの高値/安値に基づいて実際のローカル トレンド ラインを表示します
グラフィカル分析を使用するトレーダーに最適 レジスタンス ローカル トレンド ライン - 赤色 サポート ローカル トレンド ライン - 青色 フラクタルの数、トレンド ラインの色、幅を決定するパラメーターはいくつかあります
// より優れたエキスパート アドバイザーとインジケーターは、こちらで入手できます: https://www.mql5.com/en/users/def1380/seller // また、収益性が高く、安定的で信頼性の高いシグナルへの参加も歓迎します https://www.mql5.com/en/signals/1887493 これは、この MQL5 Web サイトでのみ提供されるオリジナル製品です。

MT4 用 Forex インジケーター「ハンギング マン パターン」
インジケーター「ハンギング マン パターン」は、プライス アクション トレーディングに非常に強力なインジケーターです。再描画なし、遅延なし。 インジケーターはチャート上で弱気なハンギング マン パターンを検出します。チャート上の赤い矢印信号 (画像を参照)
PC、モバイル、および電子メール アラートが含まれています インジケーター「ハンギング マン パターン」は、サポート/レジスタンス レベルと組み合わせるのに最適です。 https://www.mql5.com/en/market/product/100903
// より優れたエキスパート アドバイザーとインジケーターは、こちらで入手できます。 https://www.mql5.com/en/users/def1380/seller // また、収益性が高く、安定的で信頼性の高いシグナルに参加することもできます。 https://www.mql5.com/en/signals/1887493 これは、この MQL5 Web サイトでのみ提供されるオリジ
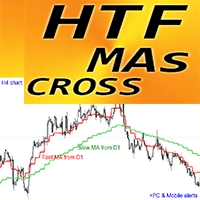
MT4 用 Forex インジケーター「HTF 移動平均クロス」
MT4 用の強力な HTF 移動平均クロス インジケーターで、取引方法をアップグレードしてください。HTF は、より高い時間枠を意味します。このインジケーターは、価格アクション エントリを使用するトレンド トレーダーに最適です。 これにより、より高い時間枠の高速移動平均と低速移動平均を現在のチャートに添付できます --> これはプロフェッショナルな方法です。 HTF MAs CROSS には、モバイルおよび PC アラートが組み込まれています。 このインジケーターは、低リスクでまともな利益を得る機会を提供します。
// より優れたエキスパート アドバイザーとインジケーターは、こちらで入手できます: https://www.mql5.com/en/users/def1380/seller // また、収益性が高く、安定していて信頼性の高いシグナルに参加することもできます https://www.mql5.com/en/signals/1887493 これは、この MQL5 Web サイトでのみ提供されるオリジナル
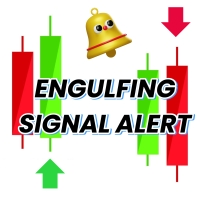
Engulfing Candle Signal Alert: Elevate Your Trading Strategy Unlock the full potential of your trading with the Engulfing Candle Signal Alert, the ultimate tool for identifying market reversals and enhancing your trading precision. Designed specifically for traders who value accuracy and timely alerts, this powerful indicator detects engulfing candle patterns, a key signal in technical analysis that often indicates a potential shift in market direction. What is an Engulfing Candle? An engu
FREE

Advantages of the Tick Volume Indicator: Identifying Market Sentiment : A predominance of green bars on the histogram may indicate an uptrend or strong buying pressure, useful for determining entry points for long positions. A predominance of red bars indicates a downtrend or strong selling pressure, useful for determining entry points for short positions. Analyzing Market Activity : The indicator helps identify periods of high activity, when significant changes are occurring in the market, and
FREE UNLIMITED PM : https://linktr.ee/ARFXAUTOTRADE?utm_source=linktree_admin_share
This BBMA FULL SETUP Scanner indicator is based on Multi Time Frame Monitoring and can be used for direct entry when a signal appears. Rules for Using Indicators: 1. Wait for Full Setup BBMA / EMA 50 Cross Mid BB 20 2. Wait for Reentry / Reetes CANDLE when CSAK / CSM occurs 3. Stop Loss Candle CSAK / CSM is formed 4. Take Profit = 2-5 x Stop Loss Distance If you want to use this indicator for free and unlimit
FREE
Elegant RSI indicator can generate RSI divergence with the availability of user defined filters. It can generate voice alerts for RSI oversold and RSI Overbought situations. Moreover it can also generate voice alerts for RSI Divergneces as well as when price breaks above or breaks below the support and resistances created upon divergence ouccurence. The voice alerts are generated in a way that you will know which market has reached the oversold and overbought conditions as well as the rsi Dive
Async Charts is an indicator to synchronize charts and display a customized crosshair (cursor) on all selected charts. This is a useful utility for traders using multiple timeframes of analyzing multiple symbols for trade entry or exit.
Main Features : Real time Crosshair Synchronization on All Selected Charts
Supports Multiple Timeframes and Multiple Symbols at the same time
Auto Scroll Option
Graphical Adjustment of Color, Font, Size, ...
Locking All or Locking Specific Charts
More and

FREE UNLIMITED PM : https://linktr.ee/ARFXAUTOTRADE?utm_source=linktree_admin_share
Bagaimana Cara membaca market melalui FMCBR-W - Didalam dunia trading ini pelbagai cara digunakan oleh trader dan penganalisa market membaca dan memahami trend. - Dari sudut FMCBR permulaan trend atau permulaan pullback dikenali melalui CB1. Apa pun dari sudut FMCBR-W trend didefinasikan melalui 3 combinasi yang saya akan kupas di muka surat seterusnya nanti. - Saya amat berharap agar pengunaan FMCBR-W nanti
FREE

Sync Cursor MT4 Sync Cursor MT5 https://www.mql5.com/en/market/product/118259 MT4 Tool will It make the Horizontal Line + Vertical Line in the Screen That it is always present on the screen and that it moves along with the candle (with the price). I am sure that something so simple will be a Treasure in the hands of many people. Some of my personal trades are posted voluntary and free of charge in this Public channel https://t.me/FXScalpingPro Contact: https://t.me/TuanNguyenTrader
FREE

The Awesome ATR Indicator is a technical analysis tool developed for the MetaTrader 4 (MT4) platform. This indicator is designed to assist traders in determining stop loss and take profit levels based on the average value of the Average True Range (ATR). By leveraging the market volatility data provided by ATR, this indicator offers more accurate and dynamic guidance in setting these crucial trading levels. Key Features: Dynamic Stop Loss Determination: Calculates stop loss levels based on the A
FREE
ダイバージェンス はオシレーター系のテクニカル指標が、実際の相場とは逆方向に向かって動いている状態のことを指し、その後のトレンド転換の可能性を示す戦略として有効です。
このインディケータは特に有効性の高いMACDのダイバージェンスを利用した 裁量トレード用サインツールです。
高頻度かつ高い 勝率で サインを発信しますが、各種の強力なフィルターにより、さらに精度の高いサインに絞ることが出来ます。また、通常のダイバージェンスに加えリバーサル( 隠れダイバージェンス) によるサイン発信も可能です。
全通貨ペア、全タイムフレームで利用できます。勝敗判定機能により、このインディケータの直近の相場環境に対する有効性を確認できます。
設定項目は以下の通りです。 Enable Divergence...MACDのDivergenceによるサインの発信を有効にします。ピンクの矢印が表示されます Enable Reversal...MACDのReversal(Hidden Divergence)によるサインの発信を有効にします 。ブルーの矢印が表示されます Fast EMA Pe

Using this indicator, you can see the moving average of 7 time frames in (one time frame) the same time frame you are.
You can also set orders to enter buy or sell positions automatically when the price hits Moving.
You can also set orders to risk free or close existing positions when the price hits Moving.
Also, receive a notification on your mobile phone when the price hits Moving.or position will be risk free or close .

PTW NON REPAINT TRADING SYSTEM + HISTOGRAM Non-Repainting , Non-Redrawing and Non-Lagging Trading System.
Does the following: - Gives Accurate Entry and Exit Points - Scalping, Day and Swing Trading - 95% Accuracy - Targets, where to take profits. - Shows Trends, Support and resistance levels - Works on All Brokers - Works on All Currencies, CFDs and Stocks - It does not place trades for you, it only shows you what trades to place. - It works on All Timeframes - It is for Trend or ra

POWER TO GET WEALTHY TRADING SYSTEMS.
NON REPAINT REVERSAL ARROW AND CHANNEL Intra-Day trading and Scalping Strategy: Designed for fast and accurate day trading and short-term trades.
Day and Swing Trading Strategy: Can be used as a reliable tool for day and swing traders who aim for the big moves of the price.
Multi Currencies and Markets: Works on different instruments and markets with its reliable precision.
Multi Timeframes: Can be used on multiple timeframes with good perfor

Trading Dashboard is a useful tool for your multiple trades. It contain information such as : - Breakeven point(price) of your multiple trades, - Loss point(price) of your trades, - Current Trading Day and Session, - Current Time and time left of candles, - Total Lot Buy & Sell, and sum of it - Spread and ATR of current time frame and symbol - Profit-Loss in percentage of your open trade

Manual guide: Click here WEEK SALE PROMO: $59 ONLY! -- Next price is $120 .
This indicator is unstoppable when combined with our other indicator called Support & Resistance . After purchase, send us a message and you will get it for FREE as a BONUS! I like to use Trend Punch on XAUUSD on the M1 timeframe & higher ones! Introducing Trend Punch , the revolutionary forex trend indicator that will transform the way you trade! Trend Punch is uniquely designed to provide pre

Fractals Dynamic Fractals Dynamic – これで、フラクタルダイナミックインジケーターに基づく、またはそれに基づくすべての取引戦略に追加のシグナルが表示されます。 さらに、フラクタルはサポートレベルと抵抗レベルとして機能することができます。 そして、いくつかの取引戦略では、流動性レベルを示しています。 この目的のために、このバージョンのマルチフラクタルおよびマルチフレームインジケータ MultiFractal Levels でレベルが導入されました。 あなたは、この指標は、より有益な視覚的かつ任意の価格チャート上のあなたの取引のアシスタントとして有用であることがわかります。 あなたの取引システムへの追加として Fractals Dynamic 指標を使用してください
また、市場で私の他の製品を試してみてください https://www.mql5.com/ru/users/capitalplus/seller
取引であなたのための大きな利益!
FREE
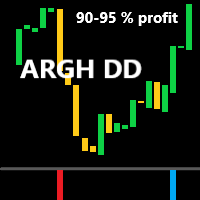
ARGH DD買い売りインジケーター
このインジケーターはヒストグラムインジケーターです。
これは、誤検知がほとんどない、強力で正確なインジケーターです。
これらが引き起こす取引は、数日または数週間にわたる取引です。
しかし、それらは非常に安定した取引です。
もちろん、エントリールールは非常にシンプルです。
️ 青いヒストグラム バーは、買いポジションの開始を示します。
️ 赤いヒストグラム バーは、売りポジションの開始を示します。
取引開始後、しばらく市場が逆方向に動く可能性があることに驚くべきではありません。
90% 以上の場合、意図したとおりに戻ります。
取引には H4 および D1 期間が推奨されます。
インジケーターをチャートにアタッチするときは、[最小値を 0 に固定] ボックスをオンにします (画像を参照)。
例:
2023 年の初めから現在まで、EURUSD ペアでは、この指標は 14 回の取引の開始を示してきました。
これら 14 回の取引のうち、損失は 1 回だけで、他の取引はすべて非常にうまくいきました

Market Noise マーケットノイズは、価格チャート上の市場の局面を決定する指標であり、また、蓄積または分配局面が発生したときに、明確で滑らかなトレンドの動きとノイズの多い平坦な動きを区別します。 各フェーズは、独自のタイプの取引に適しています。トレンド追跡システムにはトレンド、積極的なシステムにはフラットです。 市場のノイズが始まったら、取引を終了することを決定できます。 同様に、またその逆も同様で、騒音が止んだらすぐに、積極的な取引システムをオフにする必要があります。 一方からもう一方に切り替えて、両方のタイプの取引戦略を取引することができます。 したがって、この指標は取引決定の分野で優れたアシスタントの役割を果たします。 すべての価格変動は、選択した期間の一般的な価格変動と、この期間内の価格変動の形でのノイズという 2 つの要素に分けることができます。 同時に、異なる期間の異なる市場では、ノイズ成分とトレンド成分の間の幅広い相互関係を示すことができます (図 1)。 価格変動のノイズレベルが高くなるほど、基礎的なトレンドの方向性と強さを識別することが難しくなります。 した

LEVELSSインディケータが示す:
- 日足の強気ゾーンと弱気ゾーン。毎日00:00から23:59まで表示。 - 週足の強気・弱気ゾーン。毎週月曜日0:00から金曜日23:59まで表示されます。 - 特定のタイムフレームから特別に計算されたチャネルで、他のすべてのタイムフレームに表示されます。デフォルトでは、これは4時間のタイムフレームで、取引したい他のタイムフレームに変更することができます。これはノンストップで計算されます。
画面の左上には、ゾーンとチャネルが強気、弱気、中立のいずれであるかが表示されています。この3つすべてが強気の場合、現在のローソク足に緑の点が表示されます。3つとも弱気の場合、ピンクの点が表示されます。 このインディケータに制限はありません。

Basic Support and Resistance インジケータは、テクニカル分析を強化するために必要なソリューションです。このインジケータを使用すると、チャートにサポートレベルとレジスタンスレベルを投影できます/ mt5バージョン
機能
フィボナッチレベルの統合: サポートと抵抗レベルとともにフィボナッチレベルを表示するオプションを使用すると、私たちの指標は市場行動と逆転領域の可能性についてさらに深い洞察を提供します。
パフォーマンスの最適化: 各バーの開口部のみで拡張ラインを更新するオプションを使用すると、インジケータは、サポートレベルと抵抗レベルの精度を犠牲にすることなく最適なパフォーマンスを保証します。
入力 メイン設定 Timeframe: この入力を通じて、より高い時間枠のサポートラインとレジスタンスラインをチャート上に表示することを選択できます。 Support/Resistance Strength [Number of Bars]: この入力を使用して、サポートと抵抗の強度を決定できます。数が高いほど、サポート/抵抗がより強くなります。 Pri
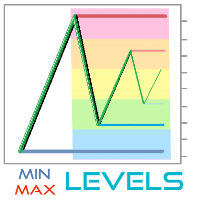
MinMax Levels MinMax Levels – は、重要な取引期間 (日、週、月) の最高値、最低値、始値レベルを示す指標です。
各外国為替市場参加者は、取引システムのレベルを使用します。 それらは、トランザクションを行うための主なシグナルであることも、分析ツールとして機能する追加のシグナルであることもできます。 この指標では、大規模な市場参加者の主要な取引期間であるため、日、週、月が重要な期間として選択されました。 ご存知のとおり、価格はレベルからレベルへと移動するため、重要なレベルに対する価格の位置を把握しておくと、取引の意思決定を行う際に有利になります。 また、便宜上、両方のレベル自体を有効または無効にするためのボタンが追加されており、ボタンを折りたたんで価格チャートの作業ウィンドウのスペースを空けることができます。
各外国為替市場参加者は、取引システムのレベルを使用します。 それらは、トランザクションを行うための主なシグナルであることも、分析ツールとして機能する追加のシグナルであることもできます。 この指標では、大規模な市場参加者の主要な取引期

BMW M5はスキャルピングのために設計された高速インジケーターで、どのタイムフレームでも、特に最小のM1やM5のタイムフレームで、価格の方向転換を非常に正確かつ迅速に示します。すべての通貨ペアで動作し、トレーダーが日中スキャルピングトレードシステムを使用して市場を分析することを可能にします。M1およびM5のタイムフレームで操作し、毎日数十のエントリーシグナルをトレーダーに提供します。 使用推奨: インジケーターが赤いラインから青いラインに変わるときは、買いポジションを開く最適なタイミングです。小さなテイクプロフィットを設定し、その作動を待ちます。インジケーターの逆方向のシグナルでポジションを閉じます。 インジケーターが青いラインから赤いラインに変わるときは、売りポジションを開く最適なタイミングです。小さなテイクプロフィットを設定し、その作動を待ちます。インジケーターの逆方向のシグナルでポジションを閉じます。 インジケーターの設定(設定を変更せず、デフォルト設定を使用することを推奨します): periodIndicator : インジケーターシグナルの期間。 shift : チャート上
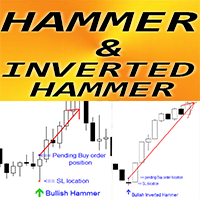
MT4用外国為替インジケーター「ハンマーと逆ハンマーパターン」
インジケーター「ハンマーと逆ハンマーパターン」は、プライスアクション取引にとって非常に強力なインジケーターです。再描画や遅延はありません。 インジケーターはチャート上で強気の逆ハンマーとハンマー パターンを検出します。 強気の逆ハンマー - チャート上の青い矢印シグナル (写真を参照) 強気ハンマー - チャート上の緑色の矢印シグナル (写真を参照) PC、モバイル、電子メールのアラートが含まれています インジケーター「ハンマーおよび逆ハンマーパターン」は、サポート/レジスタンスレベルと組み合わせるのに最適です: https://www.mql5.com/en/market/product/100903
// さらに優れたエキスパートアドバイザーとインジケーターはここから入手できます: https://www.mql5.com/en/users/def1380/seller // また、収益性が高く、安定していて信頼性の高いシグナル https://www.mql5.com/en/signals/1887493
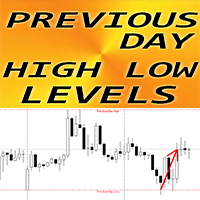
MT4用FXインジケーター「前日高値安値レベル」
「前日高値安値レベル」という指標はとても便利な補助指標です 昨日の高値と安値は価格がそこから反発することが非常に多いため、非常に重要です。 これらのレベルは信頼できるサポートとレジスタンスと見なすことができます - 価格はそれらを非常に尊重します リバーサル取引手法やスキャルピングを使用する日中トレーダーにとって便利な指標です。 プライスアクションとの組み合わせも非常に良い
// さらに優れたエキスパートアドバイザーとインジケーターはここから入手できます: https://www.mql5.com/en/users/def1380/seller // また、収益性が高く、安定していて信頼性の高いシグナル https://www.mql5.com/en/signals/1887493 に参加することも歓迎します。 当MQL5サイトのみでご提供しているオリジナル商品です。

MT4用FXインジケーター「ATRトレーリングストップ」
MT4 用の優れた補助 ATR トレーリング ストップ インジケーターを使用して、取引方法をアップグレードします。 このインジケーターはトレーリングストップの目的に最適です ATRトレーリングストップは市場のボラティリティに自動的に適応します 遅延がなく、セットアップも簡単 このインジケーターは、メイントレンドの方向への価格アクションエントリーと組み合わせるのに最適です。
// さらに優れたエキスパートアドバイザーとインジケーターはここから入手できます: https://www.mql5.com/en/users/def1380/seller // また、収益性が高く、安定していて信頼性の高いシグナル https://www.mql5.com/en/signals/1887493 に参加することも歓迎します。 当MQL5サイトのみで提供しているオリジナル商品です。
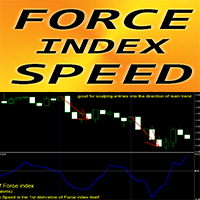
MT4 用 Forex インジケーター「Force index Speed」
このインジケーターの計算は、物理学の方程式に基づいています。Force index Speed は、Force index 自体の 1 次導関数です。 Force index は、価格とボリュームのデータを 1 つの値に組み合わせるトップ インジケーターの 1 つです。 Force index Speed は、メイン トレンドの方向にスキャルピング エントリするのに適しています。適切なトレンド インジケーターと組み合わせて使用します。 Force index Speed インジケーターは、Force index 自体が方向を変える速度を示します。非常に敏感です。 Force index Speed インジケーターの値が < 0 の場合: 速度は負です。フォース インデックス インジケーターの値が 0 より大きい場合: 速度は正 インジケーターにはモバイルおよび PC アラートが組み込まれています
// より優れたエキスパート アドバイザーとインジケーターは、こちらで入手できます: https:/

Channel Scalper Pro インジケーターは、価格チャネルとシグナル矢印に基づく高度な市場分析ツールです。このインジケーターは MetaTrader 4 (MT4) プラットフォーム用に設計されています。チャネルと視覚的なシグナルの組み合わせを使用して、市場でのエントリーポイントとエグジットポイントを非常に正確に提供します。以下に、インジケーターの詳細な説明、その機能、および使用戦略を示します。 技術的な説明 チャネル: インジケーターが表示するチャネルは、価格範囲の上限と下限を示します。これらの限界は、トレーダーがサポートレベルとレジスタンスレベルを特定するのに役立ちます。 チャネルの上限は青色で示され、価格が通常上回らないレジスタンスレベルを表します。 チャネルの下限は赤色で示され、価格が通常下回らないサポートレベルを表します。 シグナル矢印: インジケーターには、市場への潜在的なエントリーポイントを示すシグナル矢印も含まれています。 下向きの赤い矢印は売り(ショートポジション)の可能性を示し、価格がチャネルの上限に達しており、下方への反転が予想されることを示します。

Interceptor - an arrow indicator shows potential market entry points in the form of arrows of the corresponding color: up arrows (blue) suggest opening a buy, down arrows (red) suggest selling. The appearance of arrows may be accompanied by sound signals if the sound option is enabled. It is assumed to enter on the next bar after the indicator, but there may be non-standard recommendations for each strategy. Interceptor visually “unloads” the price chart and saves analysis time: no signal - no d

GAP DETECTOR
FVG in trading refers to "Fair Value Gap", . It is a concept used in technical analysis to identify areas on a price chart where there is a discrepancy or gap between supply and demand. These gaps can occur due to rapid movements in price, usually as a result of important news or economic events, and are usually filled later as the market stabilizes. The GAP DETECTOR indicator is designed to identify fair value gaps (FVG) on the price chart and filter them using volatility to det
FREE
MetaTraderプラットフォームのためのアプリのストアであるMetaTraderアプリストアで自動売買ロボットを購入する方法をご覧ください。
MQL5.community支払いシステムでは、PayPalや銀行カードおよび人気の支払いシステムを通してトランザクションをすることができます。ご満足いただけるように購入前に自動売買ロボットをテストすることを強くお勧めします。
取引の機会を逃しています。
- 無料取引アプリ
- 8千を超えるシグナルをコピー
- 金融ニュースで金融マーケットを探索
新規登録
ログイン