YouTubeにあるマーケットチュートリアルビデオをご覧ください
ロボットや指標を購入する
仮想ホスティングで
EAを実行
EAを実行
ロボットや指標を購入前にテストする
マーケットで収入を得る
販売のためにプロダクトをプレゼンテーションする方法
MetaTrader 4のための新しいテクニカル指標 - 5
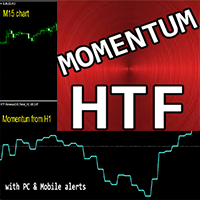
Crypto_Forex MT4 用インジケーター「HTF Momentum」
- HTF Momentum は、価格変動率を測定する主要なインジケーターの 1 つです。HTF は、Higher Time Frame を意味します。 - このインジケーターはトレンドの方向を示し、現在の値と過去の値を比較して価格変動のペースを測定します。 - HTF Momentum インジケーターは、スキャルピング エントリを使用するか、他のインジケーターと組み合わせて使用するマルチタイム フレーム トレーディング システムに最適です。 - このインジケーターを使用すると、より高いタイム フレームの Momentum を現在のチャートに添付できます。 - インジケーターには、モバイルおよび PC アラートが組み込まれています。
// 優れたトレーディング ロボットとインジケーターは、 https://www.mql5.com/en/users/def1380/seller から入手できます。 これは、この MQL5 Web サイトでのみ提供されるオリジナル製品です。
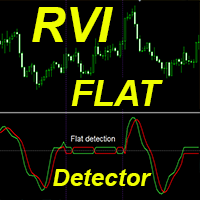
Crypto_Forex インジケーター RVI FLAT 検出器は、取引の効率的な補助ツールです。再描画はありません。 この MT4 用の優れたインジケーターを使用して、取引方法をアップグレードすることをお勧めします。
- インジケーターは、チャート上の価格のフラット領域を表示します。フラット検出を担当する「フラット感度」パラメーターがあります。 - RVI FLAT 検出器は、価格アクション エントリの確認、または売られすぎ (-0.23 未満) / 買われすぎ (0.23 以上) ゾーンからの取引に使用できます。 - トレンド フォロー システムでフラット ゾーンを検出し、そこでの取引を回避するために使用できます。 - リバーサル スキャルピングに使用して、フラット ボーダーからのリバーサルを取引できます。 - 標準の RVI オシレーターの代わりに RVI FLAT 検出器を使用する機会はたくさんあります。 - Relative_Vigor_Index (RVI) 自体は、トレンド市場で非常に役立つテクニカル モメンタム インジケーターです。
// 素晴らしいトレーディン

Just Trade Indicator – 正確でストレスフリーなトレードのための最強の味方!
Just Trade Indicator は、MetaTrader 5 向けに設計された究極のインジケーターで、市場の明確なエントリーおよびエグジットポイントを特定するのに役立ちます。高度なアルゴリズムを活用し、直感的な視覚シグナルを提供することで、簡単かつ効率的なトレードを実現します。 Just Trade Indicator を選ぶ理由
明確で正確なシグナル – 買い・売りシグナルを直感的な矢印でチャートに直接表示し、解釈の曖昧さを排除。
マルチタイムフレーム & マルチアセット対応 – 通貨ペア、株式、指数、仮想通貨など、すべての市場で使用可能。M1 から月足まで対応。
リペイントなし – 生成されたシグナルは変更されたり消えたりせず、長期的な信頼性を保証。
どんなトレードスタイルにも対応 – スキャルピング、デイトレード、スイングトレード、どの手法にも最適。
統計情報を表示 – シグナルの成功率をチャート上で直接確認可能。 使い方
Just T

This indicator utilizes advanced market analysis algorithms, combining adaptive volatility , moving averages , and trend analysis to identify potential price reversal points. The algorithm is based on ATR, EMA, and ADX , allowing it to dynamically adjust to current market conditions and filter out false signals.
The indicator is suitable for various trading strategies, including scalping, intraday trading, and long-term trend strategies . With flexible settings, it can be adapted to any market

General Information This indicator for MetaTrader 4 is a tool designed to generate buy and sell signals based on a combination of a stochastic oscillator and a moving average. Signals are displayed on the chart as arrows: green for buy signals and red for sell signals. It is built to provide a higher number of trading opportunities while considering market conditions.
How It Works The indicator processes market data using two components: the stochastic oscillator assesses the current market st
Supply and Demand is a well-known concept in trading any financial instrument. It helps identify key levels where buyers and sellers are likely to enter the market. This indicator highlights potential pivot points where institutional traders may place buy or sell orders. The indicator scans the last 50 candles to detect potential buy or sell zones. Dots on the candles mark where a supply or demand zone has formed, and a colored rectangular box extends from the zone’s origin to the current time.
FREE

Special offer! https://www.mql5.com/ru/users/bossik2810
Smart Level Pro is a very powerful indicator based on the concept of order blocks and set entries with the right fvg and breakouts to create a very good entry level like a professional trader. Very easy to use interface and easy to enter on buy and sell signals. The indicator does not repaint and does not change its data! Works best on M5-M15 timeframe for gold, bitcoin and currency pairs. 4-5 deals daily for each pair. Trading with this
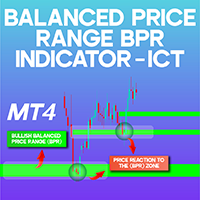
Balanced Price Range BPR Indicator ICT MT4 The Balanced Price Range (BPR) indicator is an ICT-based tool for MetaTrader 4 , designed to pinpoint the intersection of two Fair Value Gap (FVG) zones moving in opposite directions. By analyzing these gaps, the indicator highlights the shared region with colored boxes on the chart. This key area is often seen as a critical point for price movements, liquidity shifts, and possible trend reversals. Balanced Price Range Indicator Specifications Below i
FREE
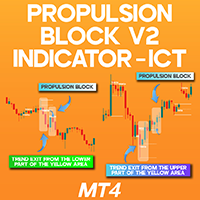
Propulsion Block V2 Indicator ICT MT4 The Propulsion Block V2 is an advanced yet lesser-known concept within the ICT trading framework, widely utilized by experienced traders to pinpoint high-probability trade entries and exits. These zones typically emerge where institutional investors or large market participants initiate or expand their positions.
This MetaTrader 4 indicator, in its second version, automatically detects Propulsion Blocks (Propulsion Block V2) —which are otherwise challenging
FREE
Unlock Institutional Trading Insights with Our Advanced Supply & Demand Zone Indicator Harness the power of institutional trading strategies with our cutting-edge Supply & Demand Zone Indicator —a game-changing tool designed to pinpoint high-probability entry and exit points in any financial market. By identifying where institutional buyers and sellers are positioned, this indicator gives you the edge to trade alongside the pros and capitalize on major market reversals. Why This Indicator Is
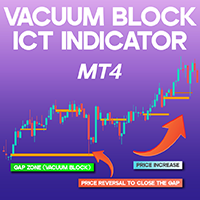
Vacuum Block ICT Indicator MT4 The Vacuum Block ICT indicator MT4 is designed to detect and analyze price gaps within the ICT (Inner Circle Trader) trading methodology. These gaps often emerge during high-impact events such as FOMC statements, NFP releases, or significant geopolitical incidents.
Since these voids represent areas with limited liquidity and unfilled orders, the price naturally gravitates toward filling them before resuming its prevailing trend. Indicator Table Category ICT - Liq
FREE
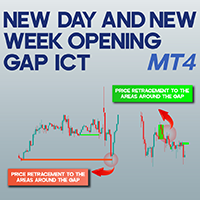
New Day and New Week Opening Gap ICT NWOG NDOG MT4 The New Day and New Week Opening Gap ICT NWOG NDOG MT4 indicator is an effective tool for traders of all experience levels in MetaTrader 4. This indicator detects price gaps that form at the beginning of each new trading day and week, highlighting them on the chart. When the market reopens after a daily or weekly close, the opening price often differs from the previous closing price, forming a noticeable gap. The indicator visually represents th
FREE
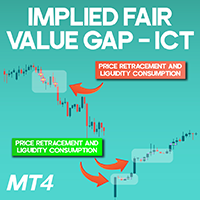
Implied Fair Value Gap ICT Indicator MT4 The Implied Fair Value Gap ICT Indicator MT4 for MetaTrader 4 is designed to detect price gaps that may not be immediately visible on the chart. This indicator calculates two theoretical levels at the midpoint of the wicks of neighboring candles surrounding a middle candle. The region between these levels represents an implied fair value gap. If one wick fully engulfs the other, no such gap is identified. «Indicator Installation & User Guide»
MT4 Indicat
FREE

L'indicatore Go Trend è un indicatore personalizzato per MetaTrader 4 (MT4) basato su una logica di ZigZag con tre livelli di periodi diversi.
Questo indicatore è progettato per identificare i punti di inversione del prezzo (massimi e minimi) su diversi timeframe, aiutando i trader a individuare potenziali trend e punti di ingresso/uscita nel mercato.
Funzionalità Principali Identificazione dei Punti di Inversione (ZigZag) L'indicatore utilizza una logica di ZigZag per tracciare linee che coll
FREE
The "Volume POC WVAP" Indicator is a revolutionary tool for traders seeking in-depth analysis across various financial markets. This unique indicator, based on tick volumes in the MT4 terminal, provides indispensable information for making informed trading decisions in the following markets: Forex, binary options, cryptocurrency, spot, futures, and indices. Key Features: WVAP Line: Weighted Volume Average Price: The WVAP calculates the weighted volume average price on the selected timeframe, all
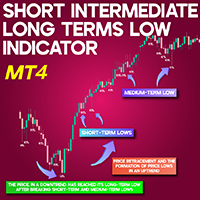
Short Intermediate Long Terms Low Indicator MT4 The STL, ITL, and LTL Indicator for MetaTrader 4 is a valuable tool for traders looking to pinpoint short-term lows (STL), intermediate-term lows (ITL), and long-term lows (LTL). Built on the ICT (Inner Circle Trader) methodology, this indicator assists in identifying critical points where market reversals are likely to occur. Indicator Table Category ICT - Liquidity - Trend Strength Platform MetaTrader 4 Skill Level Intermediate Indicator Type T
FREE

Special offer! https://www.mql5.com/ru/users/bossik2810
Accurate entry points for trades for currencies, crypto, metals, stocks, indices! The indicator 100% does not repaint!!! How to use the indicator! If a signal appears, it no longer disappears! Unlike indicators with redrawing, which lead to loss of deposit, because they can show a signal and then remove it. Trading with this indicator is very easy. We wait for the signal from the indicator and enter the transaction according to the arr

Premium and Discount PDA ICT Indicator MT4 The Premium and Discount Indicator employs a zigzag pattern to track minor trend movements and determine premium and discount areas. Designed using the ICT trading methodology , this MetaTrader 4 tool assists traders in pinpointing optimal trade entries while efficiently managing Take Profit (TP) and Stop Loss (SL) levels. Unlike MetaTrader 4’s built-in premium and discount indicators, this version specifically focuses on minor trend formations. The "D"

free only until the end of the week
The following indicator must be used and contextualized according to your trading methodologies. It provides excellent trading insights and identifies rejection zones on the drawn lines. Several parameters can be customized. The indicator will plot three levels above and below the opening price on D1, W1, and MN1. It will provide the daily ADR and display two additional daily sessions (EUROPE session and USA session). The colors of the various lines can be cu
FREE
Introduzione
L’indicatore Grid Option Strike è progettato per MetaTrader 4 e si basa sui livelli di strike delle opzioni sui future , fornendo una struttura chiara dei movimenti del prezzo su coppie di valute come EUR/USD, GBP/USD e AUD/USD . Questo strumento aiuta i trader a identificare aree di supporto e resistenza dinamiche basate sugli intervalli di 25 pip e 50 pip , frequentemente utilizzati dai trader istituzionali e nei mercati delle opzioni.
Lascia un commento per potere migliorare l'
FREE

The Master Trend Analyzer is a powerful and flexible MetaTrader 4 (MT4) indicator designed to help traders analyze trends across multiple timeframes simultaneously. By combining multiple Moving Averages (MAs) from different timeframes into one chart, this tool provides a clear and comprehensive view of market trends, making it easier to identify key support/resistance levels, confirm trends, and make informed trading decisions. Advantages of Multi-Timeframe MA Master Multi-Timeframe Analysis
FREE
This MT4-exclusive indicator highlights Wide Range Bars (WRBs) directly on your chart, this indicator focuses on helping traders identify significant price movements and volatility shifts. Customizable settings allow users to adjust sensitivity, colors, and bar criteria.
Exclusive for members of my community. Any any assistance with the indicator DM me on discord.
FREE

Multi-Timeframe Support & Resistance Indicator for MT4.
Professional Tool for Technical Traders.
Key Advantages Multi-Timeframe Analysis - View critical levels from different timeframes simultaneously Real-Time Alerts - Instant notifications when key levels change Customizable Display - Adjust colors, line styles, and timeframes to match your strategy User-Friendly - Easy setup with clear visual labels for all levels
Core Features Multi-Chart Integration : Track S/R from up to 4 t

Last High and Low Indicator
Features
Dynamic High/Low Lines : Automatically plots horizontal lines showing the highest high and lowest low over a selected number of past bars. Customizable Lookback Period : Adjust how many bars the indicator analyzes to find highs/lows. Visual Customization : Choose line colors (red for high, blue for low). Adjust line style (dashed, solid, etc.) and thickness. Price Labels : Displays the exact price and bar count for clarity (e.g., "High (10 bars): 1.1200").

Smart Market Structure Simple is a powerful indicator that helps traders identify market structure based on the Smart Money Concept (SMC) . This indicator automatically detects Break of Structure (BOS), Change of Character (CHoCH), Fair Value Gaps (FVG), Order Blocks (OB), Liquidity Zones (LQZ), and key swing points Higher High (HH), Higher Low (HL), Lower High (LH), Lower Low (LL) . Main Objective: Assist traders in tracking institutional flow ( Smart Money ) and finding high-p
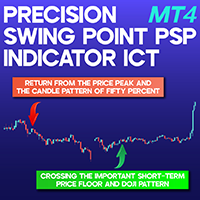
Precision Swing Point Indicator PSP ICT Quarterly Theory MT4 The Precision Swing Point Indicator PSP ICT Quarterly Theory MT4 integrates three key market indices—Dow Jones Index, Nasdaq 100 Index, and S&P 500—alongside three well-established candlestick formations: Doji, 50% body candles, and Shooting Star. This tool is designed to help traders pinpoint both trend continuations and reversals with greater accuracy. Precision Swing Point Indicator Specifications Table Category Pivot Point and Fr
FREE
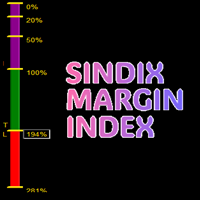
this indicator will help you see the following :
first , price levels that shows : 1. breakeven level for all open positions ( BEA shown in blue line ) 2. breakeven level for all open buy positions ( BEB shown in green line ) 3. breakeven level for all open sell positions ( BES shown in red line ) 4. draw a line at Margin level 100% ( violet color line ) 5. draw a line at Margin call level ( violet color line ) 6. draw a line at StopOut ( violet color line )
second , to the left : 1. it will s

这是一个双均线指标,使用历史数据,通过较为严格且大众化的计算公式,计算得出主要均线的数值,然后再将其均线化,从而最大可能的避免了在走势不确定的情况下,均线发出错误的交易信号。最重要的是,可以结合您自己的交易专家,实现最大化的交易利润。 手工交易参与者也可以使用本指标,结合MACD 等其他指标也可获得比较高的准确率
建议使用默认参数。本指标适合各种周期,交易品种适合黄金、比特币等波动较大的交易品种。目前我并未设置可以改变交易指标的颜色、线的大小的选项,我认为此这些都是不重要的,重要的指标的准确率以及帮助交易者能够更改好的获取利润。如果有认为需要改变颜色或者线大小的选项?可以私信我,我单独为您定制你需要的设置。

After purchase, please contact me to get your trading tips + more information for a great bonus!
Lux Trend is a professional strategy based on using Higher Highs and Lower Highs to identify and draw Trendline Breakouts! Lux Trend utilizes two Moving Averages to confirm the overall trend direction before scanning the market for high-quality breakout opportunities, ensuring more accurate and reliable trade signals. This is a proven trading system used by real traders worldwide, demonstrating
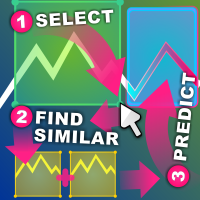
類似価格アクション インジケーター 類似価格アクションは、選択したチャートの領域に可能な限り類似するローソク足パターンの過去のシーケンスを検索します。
インジケーターは、選択した価格アクション領域の最初のローソク足の直前から、チャートの一番古い最初のバーまで検索を実行します。
2 つのシーケンス間の類似性を評価するための基準がいくつかあります: シーケンスの長さは同じである必要があります。選択した領域が 20 本のローソク足の幅である場合、一致する結果も 20 本のローソク足の幅である必要があります。ローソク足は好きなだけ選択できます。 シーケンスは、高値から安値までのサイズで視覚的に比較されます シーケンスは、始値から終値までのサイズと方向で視覚的に比較されます。ローソク足バーが一方のシーケンスでは強気で、もう一方のシーケンスでは弱気である場合、スコアは 0.0 に設定されます。 シーケンスには、デルタで比較される高速移動平均と低速移動平均のセットがあります。デルタは、その領域内で相対的に比較することも、資産全体で絶対的に比較することもできます (相対モードと絶対モード)。 シ

「Binary Smart Eye」MT4インジケーターは、バイナリーオプションと外国為替市場の両方で取引シグナルを提供するために設計されており、M1からW1までの広範囲な時間枠で動作します。トレンドレベル、インテリジェントな移動平均、最適化された取引期間を組み合わせた独自の戦略を採用し、潜在的なエントリーポイントを特定します。 主な機能の内訳は以下のとおりです。 マルチタイムフレーム分析: インジケーターの多様性により、トレーダーはさまざまな時間枠で利用でき、M1でのスキャルピングからW1での長期トレンドフォローまで、さまざまな取引スタイルに対応します。 独自の戦略: 「Binary Smart Eye」の核となるのは、以下を利用する独自の戦略です。 トレンドレベル: これらのレベルは、優勢な市場トレンドと潜在的な反転ポイントを特定するのに役立ちます。 インテリジェントな移動平均: 市場のボラティリティに適応し、正確なトレンド方向を提供するカスタマイズされた移動平均です。 スマート取引期間: インジケーターは、特定の時間期間に基づいてシグナル生成を最適化し、最適な市場状況を捉えること

"OFFER" AT JUST 100 VALID FOR 22ND APRIL GRAB YOUR COPY SOON Smart Set up leve l is a very powerful indicator based on the concept of order blocks and set up entries with proper fvg and breakouts to make a very nice level to enter like a pro trader. Very easy to use interface and friendly to enter on buy and sell signals. Works Best on M15 Time frame on Gold, Bitcoin and Fx pairs. Daily 4-5 trades on each pair Works great on gold like a pro on M15 It is non repainting nor lagging It is very pow
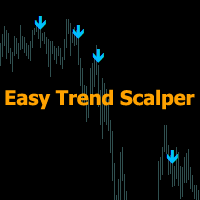
「 Easy Trend Scalper 」インジケーターは、トレンド方向内でのスキャルピング取引用に設計されています。
インジケーターの動作原理。
この指標は、市場がどの方向に動いているかを判断します。
赤い大きな矢印は強気方向を示します。
青い大きな矢印 - 弱気方向。
強気または弱気のトレンドでは、小さな矢印の形でスキャルピングのシグナルを生成するアルゴリズムがあります。
オレンジ色の矢印は購入を促すシグナルです。
青 - 販売の合図。
あらゆる取引商品とあらゆる時間枠で使用できます。 トレンドの方向やエントリーシグナルを変更するために、シグナルが表示されたときにいくつかの種類のアラートを提供します。 再描画なしで動作し、2〜5 本のローソク足の価格方向を予測できます。 矢印形成モードは、現在のローソク足またはローソク足の終値で手動で変更できます。 2 つのケースでは、次のローソク足が開いている場合、前のローソク足の矢印は再描画されません。
目的のツールに対して設定する必要があるパラメータも手動で変更できます。
「 Channel Width 」 - トレンドを決定するた
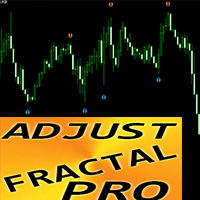
「Adjustable Fractals Pro」はフラクタルインジケーターの高度なバージョンで、非常に便利なトレーディングツールです。
- ご存知のとおり、標準フラクタル MT4 インジケーターには設定がまったくありません。これはトレーダーにとって非常に不便です。 - Adjustable Fractals Pro はその問題を解決しました。必要な設定がすべて揃っています: - インジケーターの調整可能な期間 (推奨値 - 7 以上)。 - 価格の高値/安値からの距離を調整可能。 - フラクタル矢印のデザインを調整可能。 - Info Spread Swap Display があり、接続された外国為替ペアの現在のスプレッドとスワップを表示します。 - ディスプレイには、口座残高、エクイティ、マージンも表示されます。 - Info Spread Swap Display はチャートのどのコーナーにも配置できます: 0 - 左上コーナー、1 - 右上、2 - 左下、3 - 右下。 - インジケーターにはモバイルおよび PC アラートが組み込まれています。 // 素晴らしいトレーディン
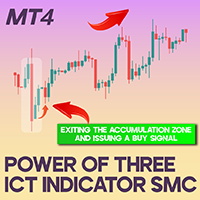
Power of Three ICT Indicator in Smart Money Concept MT4 The Power of Three Indicator is built upon three fundamental principles from Smart Money Concept: Accumulation, Manipulation, and Distribution. Each of these phases plays a key role in price stability, market liquidity, and trend identification. This indicator assists traders in recognizing ideal trade setups that align with the dominant trend of Smart Money strategies. In the price chart, the blue zones indicate the accumulation phase, whi
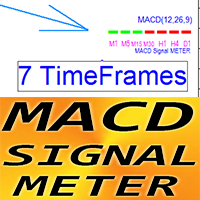
Crypto_Forex インジケーター MACD シグナル メーター (MT4 用)。
- 非常に便利な MACD シグナル メーター インジケーターは、7 つのタイムフレームの現在の MACD 値 (シグナルの上/下) を同時に表示します。 - 緑の四角形 - MACD はシグナルの上です。 - 赤い四角形 - MACD はシグナルの下です。 - Forex インジケーター MACD シグナル メーターは、マルチ タイム フレーム取引の取引エントリ フィルターとして使用できます。
// 優れた取引ロボットとインジケーターは、 https://www.mql5.com/en/users/def1380/seller から入手できます。 これは、この MQL5 Web サイトでのみ提供されるオリジナル製品です。
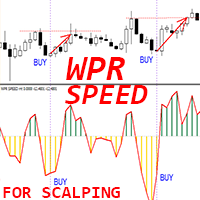
Crypto_Forex MT4 用インジケーター「WPR SPEED」 - 優れた予測ツール、リペイントなし。
- このインジケーターの計算は、物理学の方程式に基づいています。WPR SPEED は、WPR オシレーター自体の 1 次導関数です。 - WPR SPEED は、横ばいおよびフラット市場でのスキャルピング エントリに適しています。 - WPR SPEED インジケーターは、WPR 自体が方向を変える速度を示します。非常に敏感です。 - モメンタム スキャルピング トレーディング戦略には、WPR SPEED インジケーターの使用をお勧めします。インジケーターの大きなピークを見つけます - 反対方向にスキャルピング トレードを開始します (画像のように)。 - インジケーターには、モバイルおよび PC アラートが組み込まれています。
// 優れたトレーディング ロボットとインジケーターは、こちらで入手できます: https://www.mql5.com/en/users/def1380/seller これは、この MQL5 Web サイトでのみ提供されるオリジナル製品で
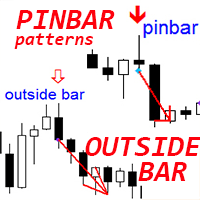
Crypto_Forex インジケーター「ピンバーとアウトサイドバーパターン」MT4用。
- インジケーター「ピンバーとアウトサイドバーパターン」は、プライスアクション取引に非常に強力です。 - インジケーターは、チャート上のピンバーとアウトサイドバーパターンを検出します: - 強気パターン - チャート上の青い矢印信号 (画像を参照)。 - 弱気パターン - チャート上の赤い矢印信号 (画像を参照)。 - 再描画なし、遅延なし。 - PC、モバイル、および電子メールアラート付き。 - インジケーター「ピンバーとアウトサイドバーパターン」は、サポート/レジスタンスレベルと組み合わせるのに最適です。
// 優れたトレーディングロボットとインジケーターは、 https://www.mql5.com/en/users/def1380/seller から入手できます。 これは、この MQL5 ウェブサイトでのみ提供されるオリジナル製品です。
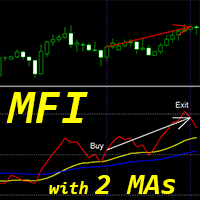
Crypto_Forex インジケーター「MFI と 2 つの移動平均」MT4 用、リペイントなし。
- マネーフローインデックス (MFI) は、価格とボリュームデータを使用して売られすぎと買われすぎのゾーンを識別するテクニカルオシレーターです。 - 「MFI と 2 つの移動平均」インジケーターを使用すると、MFI オシレーターの高速移動平均と低速移動平均を確認できます。 - このインジケーターを使用すると、トレンドの変化を非常に早く確認できます。 - パラメーターを使用してこのインジケーターを設定するのは非常に簡単で、どの時間枠でも使用できます。 - 画像で買いと売りのエントリー条件を確認できます。 - 買いシグナルの条件: (1)-高速 MA が低速 MA を上向きに交差、(2)-赤い MFI ラインが高速 MA を上回り、(3)-赤いラインが黄色のラインに接近、 (4)-赤いラインが黄色のラインから上向きに反発、(5)-買いフックがちょうど形成された - ここで取引を開始、(6)-重要: MA が交差した後は最初のフックのみを使用する。 (7)売り取引の場合はその逆 (画
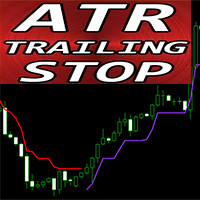
Crypto_Forex インジケーター「ATR トレーリング ストップ」、MT4 用、リペイントなし。
- MT4 用の優れた補助 ATR トレーリング ストップ インジケーターで取引方法をアップグレードします。 - このインジケーターはトレーリング ストップの目的に最適です。 - ATR トレーリング ストップは、市場のボラティリティに自動的に適応します。 - 遅延がなく、セットアップが簡単です。 - このインジケーターは、主要なトレンドの方向への価格アクション エントリと組み合わせるのに最適です。
// 優れたトレーディング ロボットとインジケーターは、こちらで入手できます: https://www.mql5.com/en/users/def1380/seller これは、この MQL5 Web サイトでのみ提供されるオリジナル製品です。
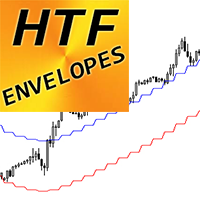
Crypto_Forex インジケーター「HTF エンベロープ」MT4 用。
- MT4 用のプロフェッショナル HTF エンベロープを使用して、取引方法をアップグレードします。HTF は、Higher Time Frame を意味します。 - エンベロープは、市場で最高のトレンド インジケーターの 1 つであり、取引に最適なツールです。 - トレーダーが極端な買われすぎや売られすぎの状態、および取引範囲を識別するのに役立ちます。 - HTF エンベロープ インジケーターは、プライス アクション エントリを使用するマルチタイムフレーム取引システム、または他のインジケーターとの組み合わせに最適です。 - このインジケーターを使用すると、Higher Timeframe のエンベロープを現在のチャートに添付できます。
// 優れた取引ロボットとインジケーターは、 https://www.mql5.com/en/users/def1380/seller から入手できます。 これは、この MQL5 Web サイトでのみ提供されるオリジナル製品です。

Crypto_Forex インジケーター STOCHASTIC FLAT Detector は、取引の効率的な補助ツールです。再描画はありません。 この MT4 用の優れたインジケーターを使用して、取引方法をアップグレードすることをお勧めします。
- インジケーターは、チャート上の価格のフラット領域を表示します。フラット検出を担当する「フラット感度」パラメーターがあります。 - STOCHASTIC FLAT Detector は、価格アクション エントリの確認、ダイバージェンス、または売られすぎ/買われすぎのシグナルに使用できます。 - トレンド フォロー システムで使用して、フラット ゾーンを検出し、そこでの取引を回避できます。 - リバーサル スキャルピングに使用して、フラット ボーダーからのリバーサルを取引できます。 - 標準の Stochastic の代わりに STOCHASTIC FLAT Detector を使用する機会はたくさんあります。 - Stochastic 自体は、市場で最高のオシレーターの 1 つであり、多くのトレーダーに最適なツールです。
// 素晴ら
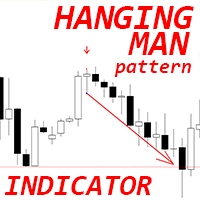
Crypto_Forex MT4 用インジケーター「ハンギングマンパターン」
- インジケーター「ハンギングマンパターン」は、プライスアクション取引に非常に強力なインジケーターです。再描画なし、遅延なし。 - インジケーターはチャート上で弱気なハンギングマンパターンを検出します。チャート上の赤い矢印信号 (画像を参照)。 - PC、モバイル、および電子メールアラート付き。 - インジケーター「ハンギングマンパターン」は、サポート/レジスタンスレベルと組み合わせるのに最適です。
// 優れたトレーディングロボットとインジケーターは、こちらで入手できます: https://www.mql5.com/en/users/def1380/seller これは、この MQL5 ウェブサイトでのみ提供されるオリジナル製品です。
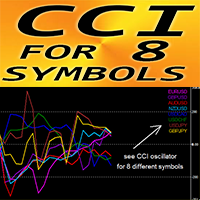
MT4 用 Forex インジケーター「8 シンボルの CCI」、リペイントなし。
- CCI は、取引で最も人気のあるオシレーターの 1 つです。 - コモディティ チャネル インデックス (CCI) は、現在の価格と過去の平均価格の差を測定します。 - 重要なレベル: +/-200。 - +200 ゾーンより上のゾーンから売りエントリーを取り、-200 より下のゾーンから買いエントリーを取るのに最適です。 - 「8 シンボルの CCI」を使用すると、1 つのチャートで最大 8 つの異なるシンボルの CCI 値を制御できます。 - このインジケーターは、プライス アクション エントリーと組み合わせるのにも最適です。
// 優れたトレーディング ロボットとインジケーターは、こちらで入手できます: https://www.mql5.com/en/users/def1380/seller これは、この MQL5 Web サイトでのみ提供されるオリジナル製品です。
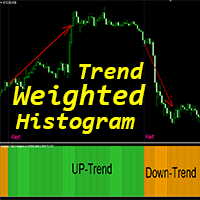
Crypto_Forex インジケーター「加重トレンドヒストグラム」MT4 用、再描画なし。
- 加重トレンドヒストグラムインジケーターは、標準的な移動平均クロスよりもはるかに効率的です。 - トレンド戦略を好むトレーダー向けです。 - インジケーターには 2 つの色があります。黄色は弱気下降トレンド、緑は強気上昇トレンドです (色は設定で変更できます)。 - モバイルおよび PC アラート付き。 - このインジケーターを他の取引方法と組み合わせるのは素晴らしいアイデアです。価格アクション、スキャルピング、モメンタム取引、その他のインジケーター。
// 優れた取引ロボットとインジケーターは、 https://www.mql5.com/en/users/def1380/seller から入手できます。 これは、この MQL5 Web サイトでのみ提供されるオリジナル製品です。

同期クロスヘア & 極値ライン インジケーター シンプルな説明(すべてのトレーダー向け) このインジケーターは、 同じ銘柄の複数のチャートでクロスヘアを同期 し、異なる時間軸の価格動向を同時に追跡できる便利なツールです。 主な機能: 同期クロスヘア: 1つのチャートでクロスヘアを動かすと、 他の同じ銘柄のチャートでも自動的に更新 されます。
ショートカットキーで簡単操作: "F" – クロスヘアの表示/非表示を切り替え。 "R" – 最高値/最安値に極値ラインを追加・削除。 "T" – 選択したバーに垂直ラインを追加・削除。
完全カスタマイズ可能: カラー、ラインスタイル、幅などを自由に調整可能。 このツールは、 手動でチャートを調整する手間を省き、マルチタイムフレーム分析をスムーズに行うのに最適 です。 詳細な説明(経験豊富なトレーダー & プログラマー向け) 同期クロスヘア & 極値ライン インジケーター は、 複数のチャートを同期する高度なツール で、テクニカル分析の精度を向上させます。
このインジケーターを使うことで、異なる時間軸のチャートにおいて

No Repaint Bext は完全な取引システムです。エントリーとエグジットのタイミング、そして取引の方向を示します。 緑の矢印 が表示されるたびに、 買い注文 を開きます。 赤い矢印 が表示されたら、すべての買い注文を閉じます。
同様に、 赤い矢印 が表示されたら、 売り注文 を開き、 緑の矢印 が表示されたらすべての売り注文を閉じます。
取引には M5(1分足) を使用し、 どの通貨ペアでも取引可能 です。 このインジケーターは 再描画されず 、ほとんど遅延しません。ただし、 ローソク足が確定するまで待つ という自然な条件はあります。 RSI フィルター と**2 つのクラシックな反転パターン(エンゴルフィング、ピンバー)**を使用し、反転の瞬間をほぼリアルタイムで捉えます。 インジケーターの効果的な使い方 どの通貨ペアでも使用可能 (テスト済み: GBPUSD, EURUSD ) 時間足:M5(1分足) 初期資金:500ドル以上 取引ロット:0.01 緑の矢印 が表示されたら、買い注文を開く。 赤い矢印 が表示されたら、すべての買い注文を閉じる。 赤い矢印 が表示されたら、売

フィボナッチ・トレンド・マーカー (Fibonacci Trend Marker) は、現在のローソク足が過去のローソク足の高値-安値(High-Low、HL)範囲に対してどのように振る舞うかを、フィボナッチ・リトレースメントレベルを用いて分析するトレンド指標です。トレンドの強さを視覚的に追跡し、ローソク足の色の変化を通じてトレンドの弱まりや反転の可能性を示します。
特徴: トレンド重視のトレーダーのために設計されており、フィボナッチレベルに基づいてトレンドの変化を素早く検出します。 市場のボラティリティが十分で、3~5本のローソク足が明確な動きを形成する場合、あらゆる時間枠で有効です。 ローソク足のサイズはチャートのスケールに自動的に適応し、ズーム時にも正確な表示を保証します。 現在のローソク足をリアルタイムで分析することでトレンド変化に高い感度を持ち、M1やM5の時間枠でのスキャルピングに最適です。
取引方法: エントリー: 前の閉じたローソク足の色が変化した後にポジションを開きます。例えば、赤いローソク足の後に青で閉じた場合、上昇トレンドのシグナルとなり、買い(Buy)の取引
FREE
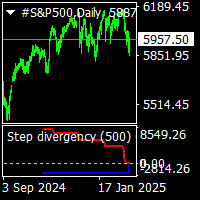
step divergency indicator is a buy sell divergency indicator.include sinus wave indicator. it work all timeframes and all pairs. red line gives step divergency sell formations. blue line gives step divergency buy formations. suitable for experienced and beginners. when prices is moving up and red lines step down ..this is sell divergecy formation and if prices moving down but blue line moving step up this is buy divergency formation. increased cnt value show more back side. gold line is sinus w
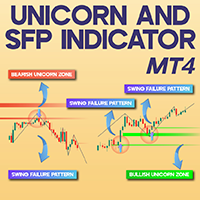
Unicorn + SFP Indicator for MT4 The Unicorn + SFP Indicator is an advanced trading tool integrating liquidity principles with ICT methodology. A Unicorn Zone emerges where a Breaker Block and a Fair Value Gap (FVG) overlap, marking areas with a high probability of price reversal. The Swing Failure Pattern (SFP) occurs when the price falsely breaches a level, indicating potential liquidity grabs and a possible market shift. Features of the Unicorn + SFP Indicator A summary of the indicator's spec
FREE
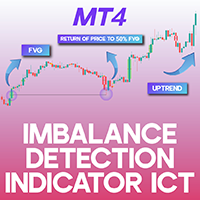
Imbalance Detection Indicator ICT MT4 The Imbalance Detection Indicator ICT MT4 for MetaTrader 4 is designed to identify key market inefficiencies, including Volume Imbalances (VI), Opening Gaps (OG), and Fair Value Gaps (FVG). This tool visually represents bullish imbalances in green and bearish imbalances in red. Market imbalances occur when supply and demand levels are out of sync, often signaling potential price targets. Indicator Specifications Table Category ICT - Liquidity - Supply and
FREE

Intraday Pulse – Indicatore per il Prezzo Medio Intraday Intraday Pulse è un indicatore progettato per determinare il prezzo medio intraday alla chiusura giornaliera del grafico. Grazie al suo algoritmo avanzato, traccia automaticamente il livello di riferimento, fornendo un supporto essenziale per strategie di trading efficaci. Nota bene: il grafico giornaliero e' ideale per utilizzare l'indicatore (D1). Aggiorna il time frame alla fine della sessione giornaliera.
L'indicatore è versatile e ut
FREE
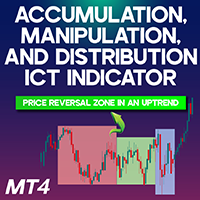
Accumulation, Manipulation, and Distribution ICT indicator MT4 The Accumulation, Manipulation, and Distribution (AMD) indicator for MetaTrader 4 serves as a powerful trend analysis tool. This indicator examines price movements and trading volume across specific sessions, categorizing price action into three phases: Accumulation, Manipulation, and Distribution. Within the indicator, accumulation appears in pink, manipulation is highlighted in green, and distribution is marked in blue. The AMD in
FREE

This is a mini version(One pair) of Advanced Detector of Trend Reversal and Continuance known as TrueTrendStarM(TTSm25). It is a sensitive and Predictive indicator of Price Trends for Professional traders. ( WEEKEND DISCOUNT OFF !! )( ATTENTION BUYERS:- PLEASE CONTACT ME FOR HOW BEST TO USE THE INDICATOR FOR MAXIMUM PROFITS )
It detects high odds changes in Price Trend direction long before other indicator detects it. I have been working on it since 2019. This is possible due to fracta
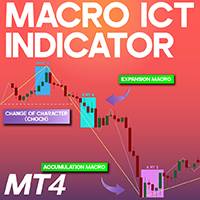
Macro ICT Indicator MT4 The term "Macro" in trading refers to a set of programmed instructions that are automatically triggered by an algorithm at specific time intervals, influencing price fluctuations in financial markets. The Macro ICT Indicator MT4 enables traders to capitalize on price shifts across different levels and multiple timeframes. It is particularly effective for traders employing ICT methodology, Smart Money concepts, and liquidity-driven strategies. Indicator Specifications Ta
FREE
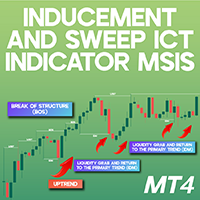
Inducement and Sweep ICT Indicator MT4 (MSIS) The "Inducement and Sweep ICT Indicator MT4 (MSIS)" for MetaTrader 4 is a cutting-edge tool designed to help traders analyze market structure and key liquidity areas, improving their decision-making process. This indicator accurately detects Change of Character (CHoCH), Break of Structure (BOS), Inducement (IDM), and Liquidity Zones , offering a clear perspective on price action and market dynamics. Indicator Overview Category ICT - Smart Money - Liq
FREE
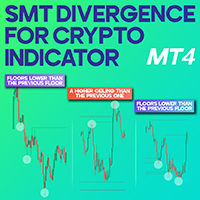
Smart Money Technique Divergence for Crypto Indicator MT4 The Smart Money Technique (SMT) Divergence Indicator for MetaTrader 4 is crafted based on divergence analysis and Smart Money principles. It identifies divergence patterns when three or more correlated financial instruments, including currency pairs, indices, or digital assets, exhibit varying price behaviors. Such discrepancies often indicate shifts in institutional money flow, hinting at potential trend reversals or diminishing momentum
FREE
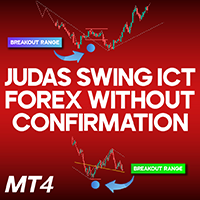
Judas Swing ICT Forex without confirmation MT4
The Judas Swing ICT Forex without confirmation Indicator serves as a strategic tool in technical analysis, widely used in financial markets, especially within the ICT trading framework. It helps identify deceptive price moves that mislead traders before the market shifts back to its actual trend. This approach is crucial for recognizing market traps and making informed trading decisions in volatile conditions.
Judas Swing ICT Forex without confirm
FREE
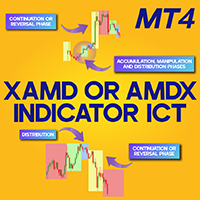
XAMD/AMDX Indicator ICT MT4
The XAMD/AMDX ICT indicator is a specialized tool for MetaTrader 4, designed to highlight possible market trend shifts. It segments price movement into three distinct phases—Accumulation (red), Distribution (blue), and Manipulation (green)—using a color-coded box system. Unlike the traditional AMD ICT indicator, this version introduces an additional "X" phase, which serves as a marker for either trend continuation or reversal.
XAMD/AMDX Indicator Specifications
Bel
FREE
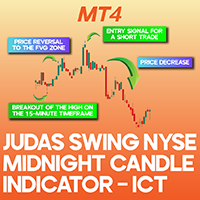
Judas Swing Indicator ICT MT4 The Judas Swing Indicator for MetaTrader 4 is a technical analysis tool designed to detect price reversals. It assists traders in pinpointing ideal trade entries and exits by identifying misleading price movements that often precede significant market shifts. Indicator Overview Category ICT - Smart Money - Liquidity Platform MetaTrader 4 Skill Level Advanced Indicator Type Continuation - Reversal Timeframe 1 Minute - 15 Minutes Trading Style Fast Scalping - Scalping
FREE
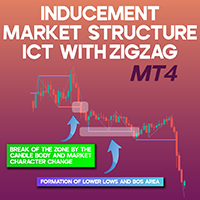
ICT Market Structure Indicator with Inducements MT4 The ICT-style Market Structure Indicator for MetaTrader 4 provides traders with a detailed analysis of Smart Money market dynamics. This tool integrates essential elements such as Change of Character (CHoCH), Break of Structure (BOS), and Inducement Detection (IDM) to give a precise representation of price movement. On the price chart, red lines highlight CHoCH levels, blue lines represent structural breaks, and gray lines indicate inducement z

Bitcoin Trader Pro Indicator is an advanced tool specifically designed for analyzing the cryptocurrency market, with a focus on BTCUSD. This indicator combines multiple technical analysis methods to generate precise and reliable trading signals. Perfect for both beginner and experienced traders, the Bitcoin Trader Pro Indicator provides everything you need to make informed trading decisions.
**Key Features:**
1. **Multi-Timeframe Analysis** - Supports six timeframes: M15, M30, H1, H4, D1,
FREE

It is the main indicator of Turtle Trading Strategy. It provides an excellent advantage for following the trend. It gives a signal to enter the transaction in channel breaks. A sell position is opened when the 20-period lower channel breaks, and a buy position is opened when the upper channel breaks. 2 ATR should be used as the stoploss level. The R-R ratio should be at least 1/2. You can reach the maximum profit opportunity by following the 10-period middle level. Recommended INPUT: 20 Period
FREE
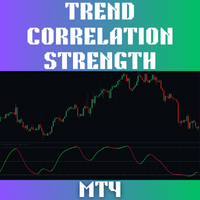
The Trend Correlation Strength (TCS) Indicator is a powerful new tool designed to measure trend strength in a unique and effective way, outperforming traditional indicators like the Average Directional Index (ADX). Instead of relying on directional movement (+DI and -DI), TCS calculates the correlation between closing prices and a linear time series, giving forex traders a distinctive method for identifying strong trends. Key Benefits of TCS Detect Trends Like a Pro : TCS doesn’t rely on lagging

Aroon Cross Signal Indicator - Trading Companion V1.21 Important Note: This indicator is provided as a raw trading tool designed for traders who enjoy customization and optimization. It is NOT a plug-and-play solution and requires your personal trading expertise to maximize its potential. Indicator Overview: The Aroon Cross Signal Indicator is a sophisticated technical analysis tool built to identify potential trend reversals and momentum shifts in financial markets. Leveraging the powerful Aro
Price Grid Navigator Indicator The Price Grid Navigator is a powerful and intuitive trading tool designed to help traders identify key support and resistance levels dynamically. Based on a structured grid system, this indicator divides the price range into eighths (8/8) and extends beyond to include overshoot levels (up to +2/8 and -2/8). It provides clear visual cues for potential entry points , exit points , and reversal zones , making it an essential tool for traders of

ATR Navigator A professional-grade volatility analysis tool that combines Average True Range (ATR) channels with a real-time dashboard, providing traders with instant market volatility insights.
KEY FEATURES: Dynamic ATR Channels (80%, 100%, 130%) - Individually adjustable Real-time Volatility Dashboard Multi-timeframe Analysis Clear Visual Labels Customizable Settings
WHAT YOU GET: • Six ATR-based volatility channels showing potential support/resistance zones • Professional dashboa

Secret Liquidity Zones Indicator User Manual Introduction Unlock the power of hidden market opportunities with the Secret Liquidity Zones Indicator . This cutting‐edge tool is designed to reveal critical price levels where market momentum may shift. With its dynamic adaptability and sleek gold visuals, it offers clear and elegant insights into key trading opportunities—making it the perfect secret weapon for traders who demand precision and clarity. Key Features Dynamic Timeframe Adaptation:
A

A powerful indicator for precise market analysis, according to the Smart Money Concepts methodology. Determines key liquidity levels, supply and demand zones. Unusual coloring of candles, as well as levels. Smartmoney has repeatedly won first places in various competitions. Multi-timeframe is suitable for both forex pairs and metals and cryptocurrency.

ガン理論に基づいた修正ゾーンの手動構築用インジケーター。ゾーンは、M1 から始まり D1 で終わるさまざまな時間枠の特別な係数を使用した数学的計算によって決定されます。このインジケーターは通貨ペアや金属だけでなく、暗号通貨や株式でも機能します。
このインジケーターを使用すると、市場サイクルに基づいて購入/販売のサポートゾーンを簡単に構築し、これらのゾーンに近づいたときに取引の決定を下すことができます。
これにより、買い/売りサポートゾーンからの価格変動の方向を理解できるようになります。
また、このインジケーターの助けを借りて、上昇/下降サイクルのブレークを決定し、エントリ ポイントを決定することができます。
スキャルピング、短期および中期取引に適しています。それはすべてあなたの取引スタイルに依存します。
とても使いやすいです。ゾーンの構築には 4 つのキーのみが使用されます。
ゾーンは、チャート上で目立つ高値/安値から手動で構築されます。
購入のサポート ゾーンを構築するには、明確に定義された高値にマウス カーソルを置き、「2」キーを押す必要があります。チャートにインジ
MetaTraderマーケットは自動売買ロボットとテクニカル指標を販売するための最もいい場所です。
魅力的なデザインと説明を備えたMetaTraderプラットフォーム用アプリを開発するだけでいいのです。マーケットでプロダクトをパブリッシュして何百万ものMetaTraderユーザーに提供する方法をご覧ください。
取引の機会を逃しています。
- 無料取引アプリ
- 8千を超えるシグナルをコピー
- 金融ニュースで金融マーケットを探索
新規登録
ログイン