YouTubeにあるマーケットチュートリアルビデオをご覧ください
ロボットや指標を購入する
仮想ホスティングで
EAを実行
EAを実行
ロボットや指標を購入前にテストする
マーケットで収入を得る
販売のためにプロダクトをプレゼンテーションする方法
MetaTrader 4のための新しいテクニカル指標

Hello fellow trader, I have built this indicator by combining trend and entry mechanisms i have used for years. This is one of my high probability strategies. All calculations are done based on pure price action-based market structure. Multiple confluences are used to validate and filter entries. All calculations are done behind the scenes, and you are given only buy sell signals. Accuracy becomes higher and higher as you trade higher timeframes, also based on my experience with the technique,
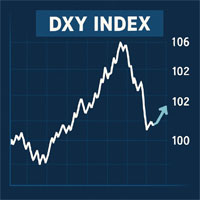
DXY Index indicator to help predict USD effect to your trade. DXY Index will help to see the power of USD.
For example if you trade XAUUSD and the DXY Index weaker, it could be the XAU will be bullish.
The same if DXY Index getting stronger, it could be that XAU will be bearish. I hope this indicator will help many trader to have better position to trade. Use this indicator wisely.

SMCセッションインジケーターは 、ICTコンセプト、流動性ハント、 セッションベースの戦略 に頼る スマートマネートレーダー 向けに作られた高精度ツールです。機関投資家レベルのトレーダーが使用する最も実績のある人気のコンセプトを使用して、重要なセッションベースの取引ゾーンをシームレスにマッピングします。このオールインワンセッションインジケーターは、 ICTアジアレンジ、ロンドンブレイクアウト、ニューヨークレンジ、ICTロンドンオープンキルゾーン、ICTニューヨークオープンキルゾーン、オープニングレンジブレイクアウト(ORB) ( ロンドン、ニューヨーク、東京を カバー)、強力な ミッドナイトオープニングレンジ など、最も効果的で確率の高いレンジ戦略をチャートにオーバーレイします。また、 シドニー、東京、ロンドン、 ニューヨーク などの 主要な外国為替取引セッション も強調表示します。各レンジは 、タイムボックス手法を使用して最高の精度で描画され、 主要な FVG(フェアバリューギャップ)、レンジスイープ、セッションの高値/安値、 および潜在的な マーケットメーカーの操作ゾーン
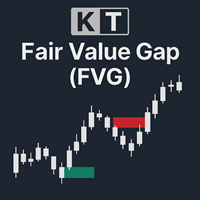
KT Fair Value Gap(FVG)は、市場における一時的な価格の不均衡ゾーンを特定し、視覚的に強調表示します。これらのギャップは、価格が継続する可能性のあるエリアとして機能するほか、時には反転ポイント(逆FVGとも呼ばれる)となる場合もあります。 強気のFVG: 緑色のボックスで表示され、上昇の勢いが再開される可能性のあるサポートゾーンとして機能します。価格がこのゾーンを埋めた後には、反転のきっかけとなることもあります。 弱気のFVG: 赤色のボックスで表示され、下降が継続される可能性のあるレジスタンスゾーンとなります。強気FVGと同様に、埋められた後に価格の反転が起こることがあります。
特徴 シンプルで見やすい設計: FVGゾーンを明確に表示するために一から設計されており、チャートの視認性を高め、トレーダーが集中しやすくなっています。 インサイトダッシュボード: 画面上のコンパクトなパネルにより、未処理(未補完)および処理済みのFVGの割合を一目で確認できます。 完全にカスタマイズ可能: FVGの閾値、処理済み/未処理のギャップの表示、色や線の太さまで自由に調整できます。

ロンドンセッションブレイクアウト戦略インジケーター は 、ICT(Inner Circle Trader) と Smart Money Concepts(SMC) を実践するトレーダー向けに設計されており、ロンドンセッション中のセッションベースの 流動性ハンティング、キルゾーン、 マーケットメーカーの行動 に焦点を当てています。このツールは、 GMT 午前0時 から午前7時までの価格高値と安値(一般的に ロンドンキルゾーン または マーケットメーカーレンジ と呼ばれます)を捕捉します。トレーダーは、機関投資家の活動とボラティリティの急上昇が最も多い潜在的なブレイクアウトゾーンを特定するのに役立ちます。
このインジケーター は、セッションタイムボックス、価格レンジ、フェアバリューギャップ(FVG)、 ブレイクアウトレベル を、鮮明なグラフィックで視覚的に強調表示します。ロンドンセッションにおける主要な動きである 、流動性スイープ、レンジコンソリデーション、 そして 急激な価格上昇 の分析をサポートします。流動性ゾーンと市場構造の変化を反映することで、トレーダーは価格が上昇または反
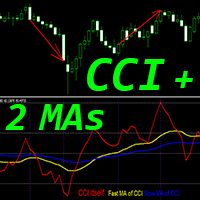
Crypto_Forex MT4用インジケーター「CCIと2つの移動平均線」、リペイントなし。
- Commodity_Channel_Index (CCI) は、トレンド方向へのモメンタムトレードに最適です。 - 「CCIと2つの移動平均線」インジケーターを使用すると、CCIインジケーターの高速移動平均線と低速移動平均線を確認できます。 - 上昇トレンド - 高速移動平均線が低速移動平均線より上。下降トレンド - 高速移動平均線が低速移動平均線より下。 - CCIは、取引で最も人気のあるオシレーターの1つで、現在の価格と過去の平均価格の差を測定します。 - オプション1 - 50から-50の値の中心領域からトレンド方向に取引を開始し、インジケーターがそれぞれ200/-200の領域に到達したら決済します。 - 重要なレベル:+/-200、オプション2 - +200以上のゾーンで売りエントリー、-200以下のゾーンで買いエントリーをトレンド方向に行います。 - インジケーターは、トレンドの変化を早期に把握する機会を提供します。
// 優れたトレーディングロボットとインジケーターは、
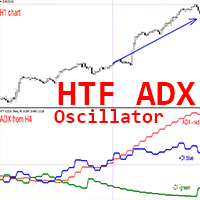
Crypto_Forex MT4用インジケーター HTF ADX
- MT4対応のプロフェッショナルHTF ADXインジケーターで、トレード手法をアップグレードしましょう。HTFはHigher Time Frame(高時間枠)の略です。 - ADX(赤線)はトレンドの強さを測るために使用されます。ADX値が20以上で上向きの形状であれば、トレンドは強いと判断されます。 - +DMI(青線)が-DMI(緑線)を上回っている場合:価格は上昇傾向にあり、ADXは上昇トレンドの強さを測ります。 - - DMI(緑線)が+DMI(青線)を上回っている場合:価格は下降傾向にあり、ADXは下降トレンドの強さを測ります。 - このインジケーターは、マルチタイムフレームのトレンドトレードに最適です。高時間枠のADXを現在のチャートに表示できます。
// 優れたトレーディングロボットとインジケーターは、こちらから入手できます: https://www.mql5.com/en/users/def1380/seller これは、このMQL5ウェブサイトでのみ提供されるオリジナル製品です。

Crypto_Forex MT4用インジケーター Heiken Ashi Histo Filter は、優れた効率的な補助取引ツールです!リペイント不要!
- 高度な新しい計算方法を採用 - パラメーター「計算価格」には10種類のオプションがあります。 - プライスアクションパターンとの組み合わせに最適: - 緑色のヒストグラム - 強気パターンを探します。 - マゼンタ色のヒストグラム - 弱気パターンを探します。 - このインジケーターを使用すれば、標準的な戦略であってもアップグレードできる機会が豊富にあります。 - モバイル、PC、メールアラート機能を搭載しています。
// 優れたトレーディングロボットとインジケーターは、こちらから入手できます: https://www.mql5.com/en/users/def1380/seller これは、このMQL5ウェブサイトでのみ提供されるオリジナル製品です。
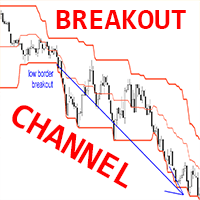
Crypto_Forex MT4用インジケーター「ブレイクアウトチャネル」、リペイント機能なし。
- このインジケーターは、高値/安値のブレイクアウトに基づく完全なトレーディングシステムとして使用できます。 - パラメーターは「ヒストリーデプス」1つだけで、インジケーターが考慮するローソク足の数を表します。 - パラメーター「ヒストリーデプス」の推奨値:時間枠 D1 - 20(1か月)、H4 - 30(1週間)、H1 - 24(1日)。 - ブレイクアウトチャネルは3つのラインで構成されています。ハイボーダー - 過去N本(ヒストリーデプスパラメータ)のローソク足の最高価格、ローボーダー - 過去N本(ヒストリーデプスパラメータ)のローソク足の最低価格、ミドルライン。 - このインジケーターは、他のインジケーターやプライスアクションパターンと組み合わせて使用できます。 - ブレイクアウトチャネルインジケーターの使用例は、画像をご覧ください。
// 優れたトレーディングロボットとインジケーターは、こちらから入手できます: https://www.mql5.com/en/user
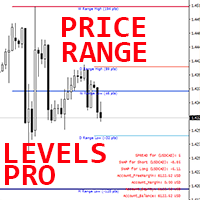
MT4用FXインジケーター「Price Range Levels Pro」
- インジケーター「Price Range Levels Pro」は、非常に便利なプロ仕様の補助取引ツールです。 - 価格(価格帯レベル)によって到達可能な日次、週次、月次における最も可能性の高い水準を表示します。 - 日次レンジはデイトレーダーに便利です。 - 週次と月次レンジはスイングトレーダーや長期トレーダーに便利です。 - このインジケーターは、テイクプロフィットの目標設定やストップロスの設定に最適です。 - スプレッド・スワップ情報表示機能を搭載しており、接続されたFXペアの現在のスプレッドとスワップを表示します。 - 画面には、口座残高、エクイティ、マージンも表示されます。 - スプレッド・スワップ情報表示機能は、チャートの任意の場所に配置できます。 0 - 左上隅、1 - 右上隅、2 - 左下隅、3 - 右下隅。
// 優れたトレーディングロボットとインジケーターは、こちらから入手できます: https://www.mql5.com/en/users/def1380/seller これは、こ

Crypto_Forex MT4用インジケーター「 RSI SPEED 」は、優れた予測ツールで、リペイント機能はありません。
- このインジケーターの計算は物理学の方程式に基づいています。RSI SPEEDはRSI自体の1次導関数です。 - RSI SPEEDは、主要トレンドの方向にスキャルピングエントリーするのに適しています。 - 適切なトレンドインジケーター(例えばHTF MA(画像参照)など)と組み合わせて使用してください。 - RSI SPEEDインジケーターは、RSI自体がどれだけ速く方向転換するかを示します。非常に敏感です。 - モメンタムトレード戦略にはRSI SPEEDインジケーターの使用をお勧めします。RSI SPEEDインジケーターの値が0未満の場合は価格モメンタムが下降し、RSI SPEEDインジケーターの値が0を超える場合は価格モメンタムが上昇します。 - インジケーターにはモバイルとPCのアラートが組み込まれています。
// 優れたトレーディングロボットとインジケーターは、こちらから入手できます: https://www.mql5.com/en
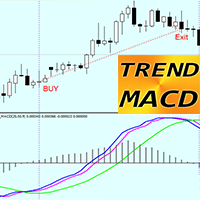
MT4用 TREND MACD インジケーターは、優れた効率的な取引ツールです!
- このインジケーターは、大きな値動きを捉えることに重点を置くトレンドトレーダーに最適です。 - TREND MACDは3本の線で構成されています。緑の線は主要なトレンド方向を示し、青とマゼンタの線はエントリーとエグジットを示します。 - このインジケーターは利益を最大化するのに役立ちます。利益が出た取引から早期にエグジットしないよう保護します。 - モバイルとPCの両方でアラート通知が可能です。
買い取引におけるインジケーターの使用方法(画像参照): 1) 青とマゼンタの線が両方とも緑の線より上にあることを確認します。 2) 青の線がマゼンタの線より上にある場合は、買い注文を出します。 3) 青の線がマゼンタの線より下にある場合は、取引をエグジットします。 4) 売り取引の場合は逆の手順となります。
// 優れたトレーディングロボットとインジケーターは、こちらから入手できます: https://www.mql5.com/en/users/def1380/seller これは、このMQL5ウェブサ
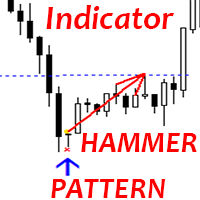
Crypto_Forex MT4用インジケーター「ハンマーパターン」
- インジケーター「ハンマーパターン」は、プライスアクション取引に非常に強力なインジケーターです。リペイントや遅延はありません。 - インジケーターはチャート上で強気のハンマーパターンを検出します。チャート上に青い矢印シグナルが表示されます(画像参照)。 - PC、モバイル、メールでアラート通知が可能です。 - インジケーター「ハンマーパターン」は、サポート/レジスタンスレベルと組み合わせるのに最適です。
// 優れたトレードロボットとインジケーターは、こちらから入手できます: https://www.mql5.com/en/users/def1380/seller これは、このMQL5ウェブサイトでのみ提供されるオリジナル製品です。
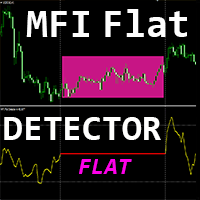
Crypto_Forexインジケーター「 MFI FLAT Detector 」は、取引における効率的な補助ツールです!リペイント不要。 このMT4対応の優れたインジケーターで、あなたの取引手法をアップグレードしましょう。
- このインジケーターは、チャート上の価格がフラットな領域を表示します。「フラット感度」パラメータが搭載されており、フラットな領域を検出します。 - 「MFI FLAT Detector」はダイバージェンス検出に非常に有効で、プライスアクションと組み合わせるのも効果的です。 - トレンドフォローシステムでフラットゾーンを検出し、そこでの取引を回避するために使用できます。 - リバーサルスキャルピングで使用でき、フラットな境界線からの反転を狙って取引できます。 - 標準的なMFIオシレーターの代わりに「MFI FLAT Detector」を使用する機会は数多くあります。 - マネーフローインデックス(MFI)自体は、価格と出来高データを使用して売られ過ぎと買われ過ぎの領域を特定するテクニカルオシレーターです。 - MFIが80を超える場合は買われ過ぎから売りエント

ニューヨークレンジインジケーターは 、ICT(インナーサークルトレーダー) コンセプト、スマートマネー取引、 機関投資家向けのプライスアクション手法 を適用するトレーダー向けに開発されたセッションベースの分析ツールです。ニューヨークセッション向けに特別に設計されたこのインジケーターは、 ロンドン終値 と ニューヨーク始値 に重なる重要な時間帯である、 GMT 12:00 から14:00の価格帯を捕捉します。 セッションの高値と安値 を特定し、 フェアバリューギャップ(FVG) を検出し、潜在的な 流動性スイープゾーンを 強調表示することで、トレーダーが マーケットメーカーの行動、セッションレンジのブレイク 、 リトレースメントの機会 を正確に分析するのに役立ちます。
この戦略は 、ニューヨーク・キルゾーン と ロンドン・ニューヨーク・セッションの 重なり合い 中に発生する 市場構造の変化 と 蓄積・分配パターン を理解することに重点を置いています。このインジケーターは 、構造のブレイク(BOS)、市場構造の変化(MSS)、変位キャンドル、不均衡ゾーン、 流動性ボイド といった
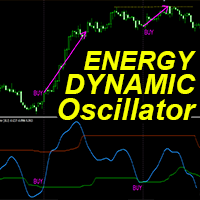
「ダイナミック・エナジー・オシレーター」は、MT4向けの高度なカスタムCrypto_Forexインジケーターです。効率的な取引ツールです!
- 新世代のオシレーターです。使い方は画像をご覧ください。 - ダイナミック・エナジー・オシレーターは、適応型の売られ過ぎ/買われ過ぎゾーンを備えています。 - トレンド相場で非常に有用なテクニカルモメンタムインジケーターです。 - オシレーターは、売られ過ぎ/買われ過ぎエリアから正確なエントリーポイントを見つけるための補助ツールです。 - 売られ過ぎ値:グリーンラインより下、買われ過ぎ値:オレンジラインより上。 - 標準的なオシレーターよりもはるかに正確です。対応時間足:M30、H1、H4、D1、W1。 - PCとモバイルのアラート機能付き。
// 優れたトレードロボットとインジケーターは、こちらから入手できます: https://www.mql5.com/en/users/def1380/seller これは、このMQL5ウェブサイトでのみ提供されるオリジナル製品です。
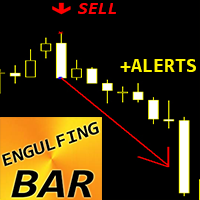
Crypto_Forex MT4用インジケーター ENGULFINGバーパターン
- インジケーター「ENGULFINGバー」は、プライスアクション取引に非常に強力なインジケーターです。リペイントや遅延はありません。 - インジケーターはチャート上のエングルフィングバーパターンを検出します。 - 強気エングルフィングバー - チャート上の青い矢印シグナル(画像参照)。 - 弱気エングルフィングバー - チャート上の赤い矢印シグナル(画像参照)。 - PC、モバイル、メールアラート対応。 - インジケーター「ENGULFINGバーパターン」は、サポート/レジスタンスレベルと組み合わせるのに最適です。
// 優れたトレードロボットとインジケーターは、こちらから入手できます: https://www.mql5.com/en/users/def1380/seller これは、このMQL5ウェブサイトでのみ提供されるオリジナル製品です。

このインジケーターは、 アグレッシブなスキャルピング や バイナリーオプションでの素早いエントリー のために設計されています 。 毎ローソク足 ごとにシグナルを生成し、常に何が起きているかを正確に把握できます。
ライブ取引をご覧ください: https://youtu.be/QR5F_9uIb6k チャンネルに参加しよう: https://www.mql5.com/en/channels/forexnewadvisor
リペイントなし :現在のローソク足のシグナルは リアルタイム で生成され、まだ形成中の間は、前のローソク足の終値を上下に超えるかどうかで色が変わる可能性があります。
しかし、ローソク足が 確定 すると、シグナルの色は 完全に固定されます 。変更されず、消えず、動きません。 見たままがそのまま残ります。
なぜこのように設計されているのか? 多くのスキャルパーは、 ブレイクアウトや急激な価格変動 が発生した瞬間にすぐにシグナルを受け取りたいと考えているため、迅速に反応できるよう設計されています。
一方で、 ローソク足が確定してからのエントリー
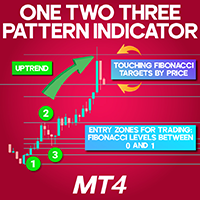
1-2-3 Pattern Indicator for MetaTrader 4
The 1-2-3 Pattern Indicator for MetaTrader 4 is a sophisticated technical tool designed to identify potential market reversals. It highlights three significant turning points, connecting them with a ZigZag pattern to visually map the price trajectory. Once the formation is complete, the indicator automatically generates Fibonacci retracement levels between the first two points to assist with trade planning. «Indicator Installation & User Guide»
MT4 Indi
FREE

Core Drift Index: Your Reliable Guide in the World of Trading Core Drift Index is an innovative trend indicator designed for precise detection of market directions and reversal points . This powerful tool enables traders to optimize their investments , minimize risk, and maximize profit. Key Features and Benefits Intuitive Trend Detection Core Drift Index clearly shows trend direction, helping traders make timely entry and exit decisions. High Probability of Success With its high accuracy
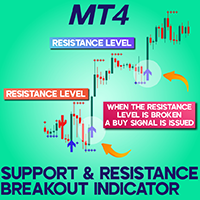
Support Resistance Breakout Indicator (SRBAI) download for MetaTrader 4
The Support Resistance Breakout Indicator (SRBAI) available for MetaTrader 4 (MT4) is designed to highlight significant pivot zones by mapping support and resistance levels on the price chart. Blue dashed lines represent support zones, while red dashed lines indicate resistance levels. Once the price breaks through a support area, the indicator generates a sell alert with a red downward-pointing arrow. Conversely, a resista
FREE

Average Daily Range (ADR) Indicator for MetaTrader 4 The Average Daily Range (ADR) Indicator for MetaTrader 4 is a vital technical analysis tool used to assess the typical price movement range an asset experience during a trading day.
By analyzing the average distance between daily highs and lows over a specified number of days, this indicator defines the ADR High (upper boundary) and ADR Low (lower boundary), helping traders identify possible support and resistance zones. «Indicator Installatio
FREE
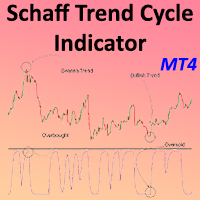
Schaff Trend Cycle Indicator for MetaTrader4 The Schaff Trend Cycle Indicator for MetaTrader4 merges the core functionalities of two widely used indicators—MACD (Moving Average Convergence Divergence) and the Stochastic Oscillator. This tool is engineered to identify trend reversals and momentum extremes with enhanced sensitivity. Readings below 25 often signal an oversold market, while values above 75 highlight overbought conditions. This makes the STC highly reliable for early trend recognitio
FREE
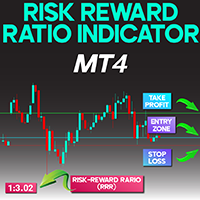
Risk Reward Indicator for MetaTrader 4
The Risk Reward Indicator for MetaTrader 4 is developed to assist traders in determining the potential risk and return of a trading position. It calculates the Risk-to-Reward Ratio (RRR) using three key levels: Entry Price (EP), Stop Loss (SL), and Take Profit (TP).
This tool graphically presents the RRR at the top-left corner of the chart and highlights the trade levels with three distinct horizontal lines:
• Green Line – Indicates the Take Profit level
•
FREE
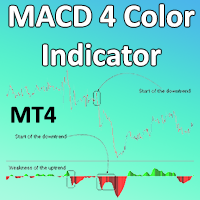
MACD 4 Color Indicator for MetaTrader 4
The MACD 4 Color Indicator for MetaTrader 4 (MACD 4C) is a refined upgrade of the traditional MACD, designed to not only indicate trend direction but also visualize the strength of the trend using four distinct color codes. These color variations are derived from the gradient of the moving average lines. It is particularly effective for identifying when a trend begins or starts to fade. The tool also incorporates divergence and convergence principles, mak
FREE
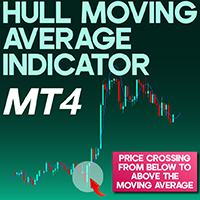
Hull Moving Average Indicator MetaTrader 4
The Hull Moving Average (Hull MA) indicator, developed by Alan Hull, is designed to minimize delay in standard moving averages and enhance responsiveness in trend evaluation. Available on the MetaTrader 4 platform, this indicator allows traders to spot short-term directional moves with greater clarity. It serves as an effective tool for identifying optimized trade entry and exit points. «Indicator Installation & User Guide»
MT4 Indicator Installation
FREE
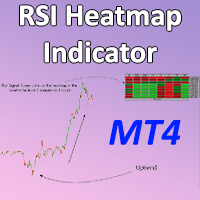
RSI Heatmap Indicator for MetaTrader4 The RSI Heatmap Indicator is a powerful technical tool in MetaTrader 4 that allows traders to assess the relative strength conditions of different currency pairs via a color-coded heatmap. By merging the Relative Strength Index (RSI) with a visual heatmap approach, this indicator simplifies market analysis by displaying strength and directional bias of multiple instruments at a glance. This indicator produces a heatmap based on calculated RSI levels across v
FREE
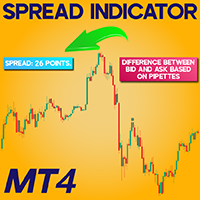
Spread Indicator download For Meta Trader 4
The Spread Indicator on MetaTrader 4 (MT4) serves to reveal the real-time gap between the Bid and Ask values. This variance, calculated in points (pipettes), appears clearly at the upper-left section of the chart window. «Indicator Installation & User Guide»
MT4 Indicator Installation | Spread Indicator Download for MT5 | ALL Products By TradingFinderLab | Best MT4 Indicator: Refined Order Block Indicator for MT4 | Best MT4 Utility: Trade
FREE
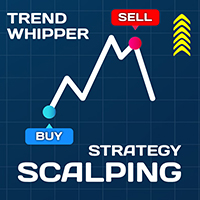
Trend detection is one of the basic challenges of every trader. Finding a way to tell when to enter a trade is very important, timing is a game changer, not too early and not too late. Sometimes, due to not knowing the market conditions, the trader closes his positions with a small profit or allows the losses to grow, these are the mistakes that novice traders make. Indicator Trend Whipper is a complete trading strategy and can improve the trader's trading process. The trend detection algorithm

Indicator defines the buy and sell arrows with high performance and consistent results . Automatic analysis of market opportunities ; Identifies a direction of a trend; Suitable for trend trading or following the trend;
This is FREE demo version of the indicator and works only on "EURUSD M5".
Forex Trend Commander full version: All details about the indicator here : Works in all symbols + free Multi Currency Scanner + free SPECIAL BONUS .
FREE
Warp Range Sensor: The Color of Your Trend Warp Range Sensor is a trend direction indicator that visually displays the current market condition by coloring bars red and blue based on trend direction. What Does Warp Range Sensor Do? Identifies the Current Trend Direction Blue bars indicate an uptrend Red bars signal a downtrend Universal Application
Compatible with all currency pairs and timeframes , from short-term scalping to long-term trading. Powered by Market Context & Historical Data
W

Rocket pro is a powerful indicator for MetaTrader 4, designed to identify the most relevant trends in the financial market. If you are looking for a tool that accurately predicts movements, Rocket pro is your ally.
Live signal: https://www.mql5.com/en/signals/2303662 How it works: This indicator combines three different methods - volume analysis, candlestick closing and symmetrical trend - to detect and signal buying and selling opportunities. Rocket pro is like a "rocket" when it detects a bu

Divergence Divergence refers to when the price of a currency pair moves in one direction while the trend indicator is moving in the opposite direction. With divergence, there can be positive and negative signals. Divergences in Forex trading are quite common signals of technical analysis. These are basic early Forex signals indicating the trend reversal and filter false signals. Application of this indicator It is usually not easy to detect divergences by the trader and it may be time-consuming
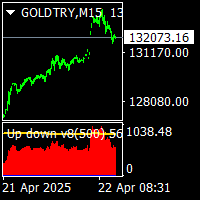
Up down v8 indicator is no repaint counter trend indicator . it try to find market up down points. it works all timeframes and all pairs. suitable for beginner and experienced trader. there is wave and c values to set defaults. minimum processed value cnt can be equal to wave value. traders can change them suitable up down points on different time frames. indicator use moving averages histograms and volatilty trigger. when red histogram is over volatility level that is tops. . when blue histogr
ICT Fair Value Gaps MTF Indicator Unlock the power of Fair Value Gaps (FVGs) across multiple timeframes using the ICT Fair Value Gaps Multi - Timeframe Indicator —a precision tool built for traders who follow the Smart Money Concept (SMC) . Key Features : Multi-Timeframe FVG Detection : Automatically identifies Fair Value Gaps from higher timeframes (M15, H1, H4, etc.) and plots them on your active chart for immediate insight. Break of Structure (BOS) & Change of Character (CHoCH

Convenient Dashboard for Moving Average Crossover Trading Strategy . On the panel, numbers display how many candles ago a signal occurred. The number 0 means the signal is on the current candle (it may disappear if the crossover does not hold). The number 1 means the signal was on the previous candle (arrows remain, as moving averages have confirmed the crossover). Moving averages can optionally be added, but the indicator works without them. Advantages of the indicator : Automa

Price Change Indicator Introduction The Price Change Indicator is a powerful tool designed to help traders identify significant price movements over a specified period. By calculating and visualizing percentage changes between current and historical prices, it allows traders to quickly spot potential trading opportunities when markets show unusual volatility or momentum. Features Real-time monitoring of price changes Visual histogram display when changes exceed threshold Text display showing cur
FREE
As the suggested, with this indicator you are able to switch from one symbol or timeframe to another in the same single chart. So forget about opening tons of chart on your screen! It's not designed for ICT or SMC trader, but if you are that kind of trader you still can use it. Imagine you have a strategy containing various indicators and settings, on a single chart you can screen the entry opportunity then move to the next symbol or timeframe.
FREE
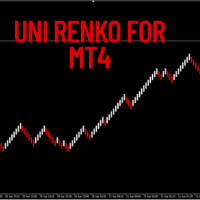
This versatile tool lets you create various Renko-style charts, including Median Renko, Mean Renko, and Traditional Renko with wicks . It offers a wide range of chart options to suit the needs of day traders, scalpers, and long-term investors.
Indicator Settings Starting Price. Box Size (in pips). Shift Percent. Timeframe Name. Show Wicks (On or Off). Amount of Bars.
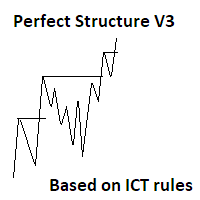
Here is the V3 of perfect structure. Whats new? (Please check added screenshots for better understanding.) 1. Coded based on ICT rules. 2. No more trend confusions...-- Added labels to show current trend 3. No more timeframe juggling and missing out important points, -- Now You can add indicator multiple times to mark multi timeframe structure on the same chart window( 1D structure on 4H or may be 4H structure on 15 min timeframe and more.....) 4. No more waiting in large range as sometimes mark
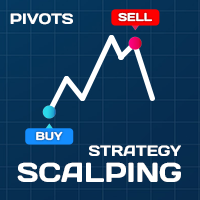
Scalping Strategy BUY SELL
Having a strategy in the market is one of the main conditions for trading. The presence of various and complicated indicators and tools sometimes makes trading difficult, and the user gets confused after trying various methods and gets stuck in a loss cycle, the result of which is usually clear. This indicator is a simple strategy based on the detection of pivots and short-term trends, which helps you to easily trade in trends. Sometimes a simple but efficient st

MACD Indicator The Moving Average Convergence and Divergence (MACD) is a trend following momentum indicator which shows the relationship between two moving averages that we chose and configure them on the indicator. The MACD is calculated by subtracting the 26-period exponential moving average and the 12 period D.A.M. These are the default parameters when you put the MACD indicator on the charts, and the period is usually 9 which means the last 9 candles. DT-Oscillator This is Robert C. Miner's
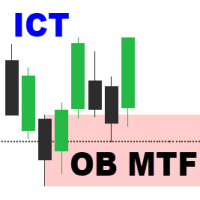
Order Block Multi Timeframe The Order Block Multi Timeframe is a powerful tool for Smart Money Concept (SMC) traders, combining high-accuracy Order Block detection with real-time Break of Structure (BOS) and Change of Character (CHoCH) analysis across multiple timeframes. Smart Money Insight, Multi-Timeframe Precision This indicator automatically identifies institutional Order Blocks —key price zones where large players have entered the market—and plots them directly on your ch

CHoCH & EQH/EQL: Market Structure and Liquidity Zones Indicator Overview: This versatile indicator is designed to help traders identify potential shifts in market structure and pinpoint key liquidity zones directly on their MetaTrader 5 charts. It automatically detects and visualizes two crucial price action concepts: Change of Character (CHoCH) for potential reversals, and Equal Highs/Lows (EQH/EQL) for significant support/resistance levels. Key Features: Change of Character (CHoCH) Detection:

H4 scalper
The H4 scalper indicator is built specifically for the H4 timeframe and works on all currency pairs.
The H4 scalper indicator is very good for scalping.
BUY and SELL signals are given by the white and yellow circles, respectively.
Take Profit can start from a minimum of 5, 10 pips.
For this indicator to work, you need to download two indicators, Trend envelopes v2 and DSS of momentum + arrows + alerts _ mtf nmc, which you can find in the first comment.
These two indicators are

Hello fellow trader, I have built this indicator by combining trend and entry mechanisms i have used for years. This is one of my high probability strategies. All calculations are done based on pure price action-based market structure. Multiple confluences are used to validate and filter entries. All calculations are done behind the scenes, and you are given only buy sell signals. Accuracy becomes higher and higher as you trade higher timeframes, also based on my experience with the technique,

The Neural Adaptive MACD is a customized MACD indicator for MT4 that visually represents momentum strength using four color-coded histogram bars: strong bullish, bullish, strong bearish, and bearish.
It features neural adaptive signal smoothing and integrates optional real-time alerts, notifying traders of new momentum shifts along with the symbol and timeframe.
This tool enhances decision-making by highlighting trend strength and change dynamics.
Can be used any forex, crypto....
Any timefr

Simple. Informative. Instantly Visible on Your Chart. Alwinson Active Trades Info (MT4 Version) is a lightweight custom indicator that displays a real-time summary of your currently open trades —right on your chart. No more switching tabs just to see what pairs are active and how much lot size is in play.
Alwinson Active Trades Info is also available for the MetaTrader 5 (MT5) version .
Key Features: Displays a list of all symbols with open positions in your trading account. Shows th

Arrow Indicator (Buy/Sell Alerts) – Simple Yet Powerful Tool! Product Version: 1.01 Indicator Type: Trend Reversal Signals Timeframes Supported: All (Recommended: H1, H4, D1) Key Features: Buy Signal : Green upward arrow () appears below the candle Sell Signal : Red downward arrow () appears above the candle Accurate Trend Reversal Detection – Based on tried and tested SMA strategy. ️ Clean Chart View – Minimalist, non-intrusive arrow signals for easy trading. Work
FREE

Z Score Pair Trade Indicator for MT4 is a powerful statistical tool designed to help traders identify mean-reversion opportunities and overbought/oversold market conditions with precision. Based on standard deviation and mean analysis, this indicator calculates the Z-score of a selected spread, price series, or custom input to determine how far the current value deviates from its historical average.
Unlock powerful market insights with the Z Score Pair Trade Indicator — a must-have tool for tr

CDS SR Fractal Level: Enhance Your Trading Accuracy with Automatic Fractal-Based Support and Resistance Levels The CDS SR Fractal Level indicator is an advanced trading tool designed by CDS to automatically identify and visualize key Support and Resistance (SR) levels. This indicator utilizes the concept of fractals to present relevant SR levels for your trading decisions. Key Features: Automatic Fractal Level Identification: The indicator dynamically marks fractal levels as they form on the pri

The Great Oracle – Your Guide to Consistent Trend Trading Success
The Great Oracle is a powerful trend-following indicator designed for traders who seek precision in their entries and exits. Whether you’re navigating trending markets or spotting opportunities in ranging conditions, The Great Oracle provides you with accurate signals and a second chance to join strong market trends. It’s the ultimate tool for traders who want to maximize profits while keeping risks manageable.
Key Features:
•
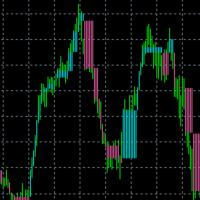
When there is no position, when changing the color, you can consider opening an order. With the fluctuation of the market, when the current color changes again, you need to close the position and leave. Suitable for different cycles, the trading rules are simple and require friends to explore on their own.
I hope friends who use this indicator can make a lot of money, rolling bigger and bigger like a snowball. thank you!
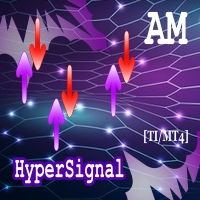
The presented indicator is an original development. The indicator gives signals to open/close a position. The indicator sensitivity can be adjusted in a literally infinite range, which allows it to be used for trading in any market. The indicator signals vary in strength depending on their consistency with the trend over three different time periods. The above indicator feature allows you to estimate the indicator signal potential in advance. Namely: If the signal is strong (coincides with the
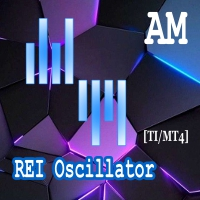
The presented product is the author's implementation of the REI (Range Expansion Index) indicator developed by Thomas DeMark. REI Oscillator AM is an indicator that measures the rate of price change and signals overbought/oversold conditions if the price shows weakness or strength. The indicator value changes within the range from -100 to +100. Thomas DeMark suggests using the default period of 8 and the following algorithm for using the indicator: When the price rises above level 60 and then fa
FREE
One of the standard ways to determine the direction of price movement at a specific point in time is to calculate the linear regression for the values of such a price for a certain period of time. This indicator displays points on the price chart, built on the basis of the linear regression values of the selected price for the selected period of time.
The indicator also displays signals at moments of change in the direction of the calculated values of linear regression. The indicator is
FREE
The presented indicator is an original development. The indicator places two types of signals on the price chart: Signals to open a position; Signals to close a position. The indicator signals appear after the bar formation is complete and are not redrawn. The signals require confirmation, namely - the price must overcome the maximum (for buying) or minimum (for selling) of the bar on which the signal was placed. The indicator can send notifications about its signals to a mobile terminal and e-
FREE
The presented indicator is the author's implementation in the oscillator format of the classic Aroon indicator. The Aroon indicator was developed in 1995 by the Indian trader Tushar Chande. Chand's origin played a role in choosing an unusual name for the oscillator. "Aroon" is translated from Sanskrit as "Light of the morning dawn". The formula for calculating the classic Aroon indicator: Aroon-Up = ((specified number of periods) – (number of periods since the maximum was formed)) / (specified n
FREE

The presented indicator is the author's implementation of the classic Aroon indicator. The Aroon indicator was developed in 1995 by the Indian trader Tushar Chand. Chand's origin played a role in choosing an unusual name for the indicator. "Aroon" is translated from Sanskrit as "Light of the morning dawn". The formula for calculating the classic Aroon indicator: Aroon-Up = ((specified number of periods) - (number of periods since the formation of the maximum)) / (specified number of periods) * 1
FREE

The presented indicator allows you to visualize the current trend. The indicator identifies the trend using the following definition as an algorithm: A trend is a situation when each subsequent maximum price rise is higher/lower than the previous one, and similarly each subsequent maximum price fall is higher/lower than the previous one; The beginning of a new trend is considered to be when the current maximum/minimum overcomes all maximums/minimums of a specified number of previous bars. The i
FREE
The presented indicator is the author's implementation of the DMI indicator. DMI (Directional movement Index) is a directional movement index. The concept of the indicator was developed by Welles Wilder. This is a technical indicator, it is used to identify the trend direction, moments of the market exiting consolidation and to confirm potential reversal points. It is an oscillator consisting of two curves. The constituent components of the Directional Movement Index: +DI (Positive Directional
FREE

NOTE: CYCLEMAESTRO is distributed only on this website, there are no other distributors. Demo version is for reference only and is not supported. Full versione is perfectly functional and it is supported CYCLEMAESTRO , the first and only indicator of Cyclic Analysis, useful for giving signals of TRADING, BUY, SELL, STOP LOSS, ADDING. Created on the logic of Serghei Istrati and programmed by Stefano Frisetti ; CYCLEMAESTRO is not an indicator like the others, the challenge was to interpret only t
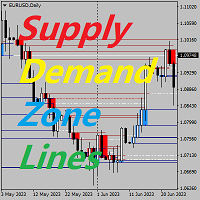
需給ゾーンの主要価格指標 背景 システムはKライン上の需要と供給の領域を自動的に検索し、リアルタイムの主要価格ラインを描画します。トレーダーは価格取引ラインに基づいて取引を行うことができます。 主な特徴 システムはKライン内の供給エリアと需要エリアを自動的に検索します。このシステムはリアルタイムの主要価格ラインも描画し、トレーダーは価格取引ラインに基づいて取引を行うことができます。したがって、需要と供給ゾーン戦略を使用するトレーダーは、需要と供給エリアの兆候を探すのに時間を費やす必要がなくなります。代わりに、需要と供給の領域と主要な価格に対する価格の反応に焦点を当て、自分に合った取引戦略を立てることができます。 ただし、需給ゾーン戦略自体はボラティリティが高い時期に効果を発揮する戦略であるため、市場が強いトレンドを示している場合には注意して使用するか、インジケーターが提供する示唆をトレンドの方向に活用する必要があります。
範囲 ShowZones: 供給ゾーンと需要ゾーンを表示するかどうか DrawLines: 主要価格を表示するかどうか SupplyZoneLineColor:

マルチタイムフレーム・キャンドル インジケーターは、トレーダーが短期の時間軸分析を高期の時間軸構造と整合させるのに役立つ強力な視覚化ツールです。選択した高期の時間軸(H1、H4、D1など)のキャンドルを現在のチャートに直接プロットすることで、チャートを切り替えることなく、市場全体の状況をより明確に把握できます。
このインジケーターが必要な人は誰ですか? このツールは次の場合に最適です。 スマート マネー コンセプト (SMC) / ICT より低い時間枠で取引を実行しながら、より高い時間枠のバイアスを利用するトレーダー。 日次またはセッションの勢いと同期を維持したいスキャルパーとデイトレーダー。 小さなチャートでエントリーを洗練させながら、HTF 構造をざっと確認したいスイング トレーダー。
価格アクション、需要と供給、またはトレンドフォローシステムのいずれを取引する場合でも、このインジケーターにより、エントリーはより長い時間枠の強さによって裏付けられます。
戦略の改善 マルチタイムフレームキャンドルは、次の点の改善に役立ちます。 方向性バイアスの確認 – 支配的なトレンドまた
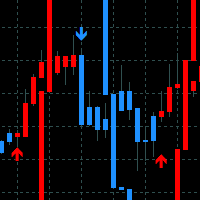
Reversal Bands - ボラティリティ分析とその結果の取引への応用のために設計されたインジケーター。 トレンドに沿った価格方向のシグナルと反転の初期段階のシグナルを提供します。
インジケーターの機能
このインジケーターは、平滑化の度合いを使用してボラティリティの加速と減速の原則に従って構築された速度ラインに基づいています。 ラインの原動力はボラティリティであり、ボラティリティが大きいほど、ラインは価格から大きく外れます。 赤い矢印、ローソク足、スピードラインは上昇傾向を示しており、これは強気の方向と一致しています。 青い矢印、ローソク足、スピードラインは下向きのボラティリティを示しており、これは弱気方向を裏付けています。 トレンドの方向が長期にわたる上昇傾向にあり、スピードラインが価格を上回っている場合、反転シグナルは、強気トレンドが継続する前に修正を示すことがほとんどです。 また、トレンドの方向が長期的な下降トレンドであり、スピードラインが価格より下にある場合、逆シグナルは、下降トレンドが継続する前に修正を示すことがほとんどです。 便宜上、速度線の線と矢印はグラフ自体に
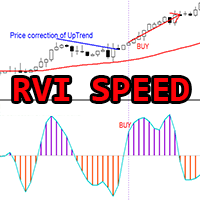
MT4用Crypto_Forexインジケーター「RVI Speed」(リペイント機能なし)
- このインジケーターの計算は物理学の方程式に基づいています。RVI SpeedはRVI自体の1次導関数です。 - Relative_Vigor_Index(RVI)自体は、トレンド相場で非常に有用なテクニカルモメンタムインジケーターです。 - RVI Speedは、価格調整後に主要トレンドの方向にモメンタムエントリーを行う際に有効です。 - 適切なトレンドインジケーター(例えば、標準EMA(図参照)など)と組み合わせて使用してください。 - RVI Speedインジケーターは、RVI自体がどれだけ速く方向転換するかを示します。非常に敏感です。 - RVI Speedインジケーターの値が0未満の場合、速度は負です。値が0を超える場合、速度は正です。 - このインジケーターには、モバイルとPCの両方でアラート機能が組み込まれています。
// 優れたトレーディングロボットとインジケーターは、こちらから入手できます: https://www.mql5.com/en/users/def13
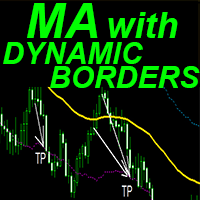
Crypto_Forex MT4用インジケーター「ダイナミックボーダー付き移動平均線」
- このインジケーターは、移動平均線に独自の機能「ダイナミックボラティリティボーダー」を付加しています。 - ダイナミックボラティリティボーダーは、平均真範囲(ATR)値を計算に使用します。 - このインジケーターは、テイクプロフィットのターゲット設定や、ボーダーラインでのSL設定に最適です。 - プライスアクションシグナルとの組み合わせにも最適です。
// 優れたトレードロボットとインジケーターは、こちらから入手できます: https://www.mql5.com/en/users/def1380/seller これは、このMQL5ウェブサイトでのみ提供されるオリジナル製品です。
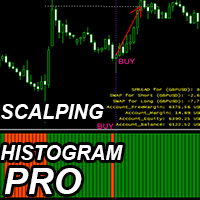
Crypto_Forex MT4用インジケーター「 Scalping Histogram Pro 」、リペイント機能なし。
- Scalping Histogram Proインジケーターは、マイナーな価格調整後の価格モメンタムの主要方向へのエントリーシグナルを探すのに使用できます。 - Scalping Histogram Proは2色で表示されます。オレンジは弱気モメンタム、緑は強気モメンタムです。 - 同じ色のヒストグラムバーが10本以上連続して表示されると、強いモメンタムが発生していることを意味します。 - エントリーシグナルは、ヒストグラム上で反対色の列と、最初のモメンタム色で表示される列です(画像参照)。 - スキャルピングターゲットは、チャート上の最も近い高値/安値です。 - インジケーターにはモバイルとPCのアラートが組み込まれています。 - インジケーターにはスプレッド・スワップ情報表示機能があり、インジケーターが接続されている通貨ペアの現在のスプレッドとスワップを表示します。 - 画面には、口座残高、エクイティ、証拠金も表示されます。 - Info Spread
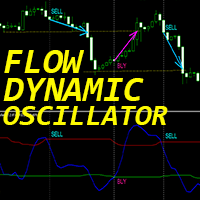
「ダイナミックフローオシレーター」は、MT4向けの高度なカスタムCrypto_Forexインジケーターです。効率的な取引ツールです!
- 新世代のオシレーター - 使い方は画像をご覧ください。 - ダイナミックフローオシレーターは、適応型の売られ過ぎ/買われ過ぎゾーンを備えています。 - このインジケーターは、価格と出来高データを用いて売られ過ぎと買われ過ぎゾーンを特定します。 - オシレーターは、売られ過ぎ/買われ過ぎエリアから正確なエントリーポイントを見つけるための補助ツールです。 - 売られ過ぎ値:グリーンラインより下、買われ過ぎ値:レッドラインより上。 - 標準的なオシレーターよりもはるかに正確です。対応時間軸:M30、H1、H4、D1、W1。 - PCとモバイルの両方でアラート機能を搭載。
// 優れたトレーディングロボットとインジケーターは、こちらから入手できます: https://www.mql5.com/en/users/def1380/seller これは、このMQL5ウェブサイトでのみ提供されるオリジナル製品です。
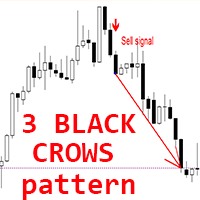
Crypto_Forex MT4用インジケーター「3 Black Crowsパターン」
- インジケーター「3 Black Crowsパターン」はプライスアクショントレードに非常に効果的です。リペイントや遅延はありません。 - インジケーターはチャート上で弱気な「3 Black Crows」パターンを検出します。チャート上に赤い矢印シグナルが表示されます(画像参照)。 - PC、モバイル、メールでアラート通知が可能です。 - 兄弟機種として、強気な「3 White Soldiersパターン」インジケーターもご用意しています(下記リンクをご覧ください)。 - インジケーター「3 Black Crowsパターン」は、サポート/レジスタンスレベルと組み合わせるのに最適です。
// 優れたトレードロボットとインジケーターは、こちらから入手できます: https://www.mql5.com/en/users/def1380/seller これはMQL5ウェブサイトでのみ提供されるオリジナル製品です。
123456789101112131415161718192021222324252627282930313233343536373839404142434445464748495051525354555657585960616263646566676869707172737475767778798081828384858687888990919293949596979899100101102103104105106107108109110111112113114115116117118119120121122123124125126127128129130131132133134135136137138139140141142143144145146147148149
MetaTraderマーケットは、履歴データを使ったテストと最適化のための無料のデモ自動売買ロボットをダウンロードできる唯一のストアです。
アプリ概要と他のカスタマーからのレビューをご覧になり、ターミナルにダウンロードし、購入する前に自動売買ロボットをテストしてください。完全に無料でアプリをテストできるのはMetaTraderマーケットだけです。
取引の機会を逃しています。
- 無料取引アプリ
- 8千を超えるシグナルをコピー
- 金融ニュースで金融マーケットを探索
新規登録
ログイン