Neue technische Indikatoren für den MetaTrader 5

Jeder Käufer dieses Indikators erhält zusätzlich kostenlos:
Das exklusive Tool „Bomber Utility“, das jede Handelsposition automatisch begleitet, Stop-Loss- und Take-Profit-Niveaus setzt und Trades gemäß den Regeln der Strategie schließt Set-Dateien zur Konfiguration des Indikators für verschiedene Handelsinstrumente Set-Dateien zur Konfiguration des Bomber Utility in den Modi: „Minimales Risiko“, „Ausgewogenes Risiko“ und „Abwartende Strategie“ Ein Schritt-für-Schritt-Videohandbuch, das Ihnen hi
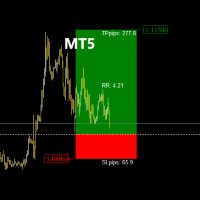
TradeManagerRR Visualizer MT5 ist ein Handelsmanagement-Tool, das für Händler entwickelt wurde, die ihre Gewinnziel- (TP) und Stop-Loss- (SL) Ebenen einfach auf einem Chart visualisieren möchten. Diese erste Version bietet eine einfache grafische Darstellung, die die SL- und TP-Zonen sowie den Einstiegspreis anzeigt. Bitte beachten Sie, dass sich diese aktuelle Version ausschließlich auf die grafische Darstellung der SL- und TP-Zonen als Figuren auf dem Chart konzentriert. Aktuelle Version: Fu
Haven Average Daily Range ist ein Indikator, der die durchschnittliche tägliche Handelsspanne von Finanzinstrumenten auf dem Forex-Markt und anderen Märkten berechnet und anzeigt. Weitere Produkte -> HIER Hauptmerkmale: Berechnung des ADR auf Basis mehrerer Zeiträume (5, 10 und 20 Tage) Anzeige von ADR-Niveaus mit automatischer Stiländerung beim Erreichen der Spanne Klare visuelle Darstellung von Handelsbeginn und -ende Anpassbare Anzeigeparameter (Farbe, Linienbreite) Anzeige von Preislabels z
FREE

# Wave Trend Oscillator (WTO) User Guide
## Overview Wave Trend Oscillator is a powerful technical analysis tool used to analyze price momentum and trend direction. It visualizes market conditions using two main lines (WT1 and WT2) and a histogram.
## Components 1. **WT1 (Green Line)**: Main trend indicator 2. **WT2 (Red Line)**: Signal line 3. **Histogram (Blue)**: Shows the difference between WT1 and WT2 4. **Arrows**: Mark crossover points - Green Arrow: WT1 crosses above WT2 (Buy signa

RSI ABCD-Musterfinder: Technische Strategie 1. Funktionsweise des Indikators Kombiniert den klassischen RSI mit automatischer Erkennung von ABCD-Harmonie-Mustern . Hauptkomponenten Standard-RSI (einstellbare Periode) Hoch- und Tiefpunkte-Markierungen (Pfeile) ABCD-Muster (grüne/rote Linien) Überkauft (70) und Überverkauft (30) Filter 2. MT5-Einstellungen period = 14 ; // RSI-Periode size = 4 ; // Maximale Muster-Größe OverBought = 70 ; // Überkauft-Level OverSold = 30 ; // Überverkauft-Level Fil
FREE

Speed Scalp Indicator – NON-Repaint
The Ultimate Tool for Fast and Precise Scalping
Perfect for Gold (XAUUSD) & Lower Timeframes The Speed Scalp Indicator is a powerful, non-repainting trading tool specifically engineered for scalpers who thrive on speed, precision, and high-frequency entries. Tailored for timeframes 30 minutes and below , this indicator is especially optimized for Gold (XAUUSD) , making it an essential companion for traders focusing on volatile instruments and rapid

I am a trader specializing in the development of rare , exclusive , high-performance trading bots designed for serious traders who are committed to achieving consistent profitability and success. This free indicator is more than just a visual tool—it powers the Midnight Throttle EA , an automated trading system that executes trades based on the precise market conditions this indicator observes. Midnight Watch : A Pro-Level Tool for Precision Market Analysis. An advanced , multi-functional MetaTr
FREE
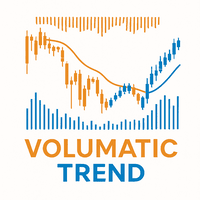
Volumatic Trend is a powerful, trend-following indicator that merges directional analysis with real-time volume behavior. By combining adaptive trend logic and volume overlays, it gives traders a detailed snapshot of market conviction and potential turning points. From instant trend shift detection to volume-weighted candle visuals, this tool brings deeper context to price movement. MT4 Version - https://www.mql5.com/en/market/product/136210/ Join To Learn Market Depth - https://www.mql5.co
FREE

Der Multi Timeframe Candles Indikator ist ein leistungsstarkes Visualisierungstool, das Händlern hilft, ihre Analyse niedrigerer Zeitrahmen mit der Struktur höherer Zeitrahmen abzugleichen. Durch die Darstellung von Kerzen aus einem ausgewählten höheren Zeitrahmen (H1, H4, D1 usw.) direkt in Ihrem aktuellen Chart bietet Ihnen dieser Indikator eine klarere Perspektive auf die gesamte Marktentwicklung, ohne dass Sie zwischen Charts wechseln müssen.
Wer braucht diesen Indikator? Dieses Tool i
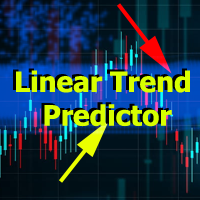
Linear Trend Predictor – Ein Trendindikator, der Einstiegspunkte und Richtungsunterstützungslinien kombiniert. Funktioniert nach dem Prinzip des Durchbrechens des Hoch-/Tiefpreiskanals.
Der Indikatoralgorithmus filtert Marktrauschen und berücksichtigt Volatilität und Marktdynamik.
Indikatorfunktionen
Mithilfe von Glättungsmethoden zeigt es den Markttrend und Einstiegspunkte zum Öffnen von Kauf- oder Verkaufsaufträgen an. Geeignet zum Bestimmen kurzfristiger und langfristiger Marktbewegungen

Candle Volume Strength ist ein erweiterter Volumenanalyseindikator, der Einblicke in den anhaltenden Kampf zwischen Käufern und Verkäufern bietet. Er berechnet und visualisiert Volumenverschiebungen in Echtzeit und hilft Händlern, Ausbrüche, Trends, Rückverfolgungen und Umkehrungen mit größerer Genauigkeit zu bestätigen.
Hauptmerkmale: Volumenbasierte Bestätigung – Der Indikator überwacht Änderungen des Tick-Volumens und warnt, wenn sich die Marktmacht zwischen Käufern und Verkäufern verschi
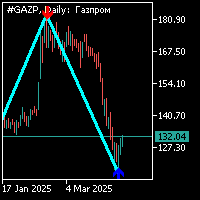
Die Zig-Zag-Anzeige ist Standard mit einer Periode von 34 mit einem zusätzlichen Pfeilersignal. Das zusätzliche Signal wird separat von der Zig-Zag-Anzeige berechnet.Die Arbeit an diesem Indikator erfolgt wie folgt: 1. wenn Sie eine Zig-Zagaanzeige bilden und ein zusätzliches Signal in Form eines Pfeils erscheinen, müssen Sie die Position in Richtung der Pfeilrichtung öffnen; 2. wenn ein weiterer Hebel des Zig-Zag-Indikators in die entgegengesetzte Richtung des zusätzlichen Signals (Pfeile) an d
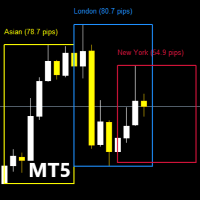
Bevor Sie sich mit den Funktionen dieses Indikators vertrautmachen, denken Sie bitte daran, dieses Produkt zu bewerten, einen Kommentar zu hinterlassen, um Ihre Erfahrungen zu teilen, und sich auf meiner Seite anzumelden, um über die neuesten Updates und neuen Tools informiert zu bleiben. Ihre Unterstützung ist unschätzbar und hilft mir, meine Kreationen kontinuierlich zu verbessern! Beschreibung: TradingSessionPipsVisualizer - Das professionelle Tool zur Beherrschung der Handelssitzungen Visu
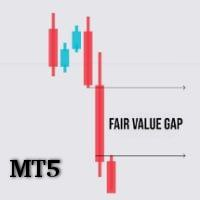
FVG ANALYZER – DAS ULTIMATIVE TOOL FÜR PRÄZISE FAIR VALUE GAP (FVG) ERKENNUNG
Der FVG Analyzer ist ein leistungsstarker und vollständig anpassbarer Indikator, der für ernsthafte Trader entwickelt wurde, die Fair Value Gaps (FVG) in ihren Strategien nutzen. Mit intelligenter Erkennung und klaren Visualisierungen ermöglicht dieses Tool eine schnelle Identifikation von Markteffizienzen – Bereichen, in denen der Preis wahrscheinlich zurückkehren wird, bevor er seinen Trend fortsetzt. HAUPTME

What is Linear Regression? Linear regression is a statistical method used to model the relationship between price and time. In forex trading, it helps traders identify trends, potential reversals, and areas of support and resistance. Uses of Linear Regression in Forex Trading Trend Identification The regression line acts as a dynamic trendline, showing whether the market is trending upward or downward. Traders can use the slope of the regression line to measure trend strength. Support and Resist
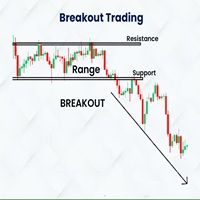
Indicador Basado en la estrategia de ruptura del rango de londres de Amaury Benedetti.
Este indicador dibuja automaticamente el rango, el maximo y minimo y sus correspondientes lineas de stoploss, entrada y takeprofit.
SE RECOMIENDA USAR EN M1 EN EL US30 (DE ACUERDO A LA ESTRATEGIA)
Los valores se pueden modificar de acuerdo a la necesidad del usuario, tambien se tienen mas configuraciones para dibujar cualquier rango en diversos horarios y con diferentes configuraciones de sl, tp, etc
Detal
FREE

Introduction! to the Indicator that Connects Trend , Pattern , and Candlestick Trigger 3 Steps in Under 30 Seconds ️ Trade effortlessly — no analysis required, Your smart assistant is ready to simplify your workflow No more chart overload Trade with confidence using smart bias detection Compatible with all currencies, crypto, stocks, metals, indices, and any timeframe Just click and execute — it’s that simple Ideal for busy traders who want speed and clarity. TPTSyncX is a powerfu
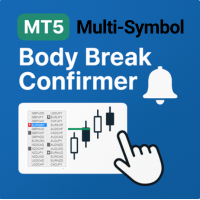
The Body Break Confirmer MT5 allows traders to set real-time alerts when the price breaks the body of the previous candle — helping confirm potential market reversals on a pre-selected symbol, timeframe, and direction. Body breaks are highly effective for confirming reversals on higher timeframes, starting from H1and above. Body Break Confirmer features a multi-symbol tracking panel with symbol buttons to instantly load any symbol to the chart for easy alert placement. Unlike standard reversal
FREE

Overview The TTM Squeeze indicator helps identify low volatility periods (squeeze) that often precede price breakouts. It uses Bollinger Bands (BB) and Keltner Channels (KC) to determine when the market is "coiling" and ready to move. Configuration Guide Volatility Settings The indicator uses Bollinger Bands to measure market volatility. When BBs are inside Keltner Channels, a squeeze is detected. The squeeze suggests the market is consolidating and may soon break out. True Range Option Optional
FREE

MT4 version Overview The Lowess Channel indicator is a smoothed trend-following tool designed to help traders identify the direction of the trend , detect flat or ranging markets , and spot breakouts from consolidation zones. It creates a central smoothed line with upper and lower channel boundaries, adapting to market noise while maintaining clarity. How It Works The indicator builds a channel around a smoothed price line. The central line reflects the current trend. The upper and lower bounda
FREE
Level Box Tool is a powerful and user-friendly custom indicator designed for traders who utilize technical analysis tools like rectangles and trend lines to identify key support, resistance, and price zones. This tool simplifies and speeds up the process of marking chart levels, offering both visual clarity and precision with its fully customizable panel, and now includes price-cross alerts — so you’ll never miss a key level again. MT4 Version - https://www.mql5.com/en/market/product/136009/ Jo
FREE
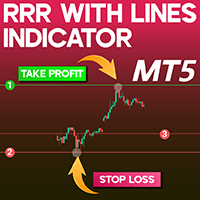
RRR with lines Indicator Download MT5 Effective risk management is a fundamental aspect of sustainable trading in financial markets. The RRR Indicator in MetaTrader 5 provides traders with a structured approach to calculating the Risk-to-Reward Ratio (RRR) . By drawing three adjustable horizontal lines, it assists traders in setting Stop Loss and Take Profit levels with precision. «Indicator Installation & User Guide» MT5 Indicator Installation | RRR with lines Indicator MT5 | ALL Products By
FREE
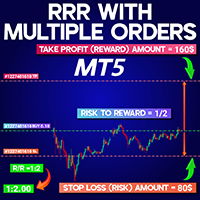
RRR with Multiple Orders Indicator MT5 The RRR with Multiple Orders Indicator MT5 is a powerful utility in the MetaTrader 5 platform that calculates and displays the risk-to-reward ratio for active trades. Especially useful for traders who manage several open positions simultaneously, this indicator helps monitor and control risk exposure more effectively. It shows the R/R values clearly inside a box located in a corner of the chart window, making real-time evaluation of trades easier. «Indicato
FREE
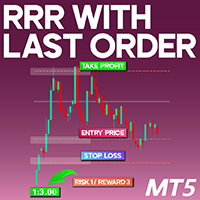
Risk-Reward Ratio with Last Order Indicator for MT5 The Risk-Reward Ratio with Last Order (RRO) Indicator is an essential tool designed for traders using the MetaTrader 5 (MT5) platform. This indicator helps users assess the risk-to-reward ratio of their trades by calculating the distance between the stop loss, take profit, and entry point . The resulting ratio is prominently displayed in the top left corner of the chart, allowing for quick and easy evaluation. «Indicator Installation & User Gui
FREE
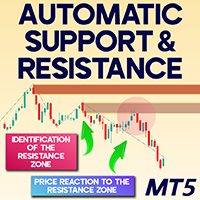
Automatic Support & Resistance Indicator for MT5
The Automatic Support & Resistance Indicator for MT5 is a sophisticated tool tailored for MetaTrader 5 users, engineered to systematically highlight significant support and resistance price zones. It marks support levels using green shades (dark green for newly formed zones, light green once retested) and resistance areas in brown tones (starting with dark brown and lightening after confirmation), offering traders visual clarity in identifying cri
FREE
SyntheticaFX Boom and Crash is a powerful tool designed to highlight potential spike opportunities in the market, exclusively for traders focusing on Crash and Boom indices. This indicator is strictly optimized to operate on the 3-minute (M3) timeframe and supports only the following pairs: Crash 1000 Index , Crash 900 Index , Crash 600 Index , Crash 500 Index , Crash 300 Index , Boom 1000 Index , Boom 900 Index , Boom 600 Index , Boom 500 Index , and Boom 300 Index . It will not display signa
FREE

Overview Inspired by Tradingview’s falconCoin, The Market Cipher indicator is a momentum oscillator used to detect overbought/oversold conditions and potential trend reversals. Traders can also use it to spot divergences between price action and momentum for early entry or exit signals. Configuration Guide Core Indicator Settings The indicator calculates momentum using a short-term and a longer-term average. Momentum is plotted as a wave oscillating between overbought and oversold thresholds. Ov
FREE
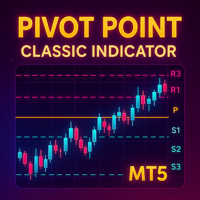
Detailed Description: The Pivot Point Classic Indicator is designed for traders who rely on classic pivot points and midpoints levels for their trading strategies. By automatically calculating and plotting these levels, the indicator provides a clear, visual representation of critical price areas where the market may reverse or break out. Key Features: Automatic Pivot Point Calculations : Automatically calculates pivot points, three support (S1, S2, S3) and resistance (R1, R2, R3) levels bas
FREE

NOTE: CYCLEMAESTRO is distributed only on this website, there are no other distributors. Demo version is for reference only and is not supported. Full versione is perfectly functional and it is supported. CYCLEMAESTRO , the first and only indicator of Cyclic Analysis, useful for giving signals of TRADING, BUY, SELL, STOP LOSS, ADDING. Created on the logic of Serghei Istrati and programmed by Stefano Frisetti ; CYCLEMAESTRO is not an indicator like the others, the challenge was to inter
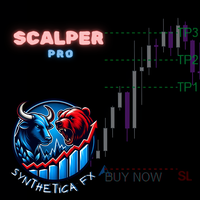
The SyntheticaFX Scalper Pro Indicator is a versatile and user-friendly tool designed to assist traders in identifying high-accuracy entry points across multiple timeframes and all currency pairs. This indicator provides clear visual signals on the chart, along with recommended Stop Loss (SL) and Take Profit (TP) levels, making it easier for traders to plan their trades with confidence. With its built-in dashboard, the SyntheticaFX Scalper Pro Indicator offers real-time trade statistics, helpin
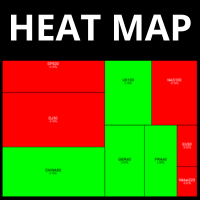
Dynamic Heatmap for MetaTrader 5 — Instantly Spot Market Opportunities Revolutionize the way you see the markets with the most complete and intelligent Heatmap for MetaTrader 5. Designed for traders who demand speed and clarity in decision-making, our Heatmap creates a powerful visual representation of market performance in real time. Key Benefits Instant Read of Market Strength Instantly see which assets are leading or lagging. Dynamic color coding for quick identification: green for ri
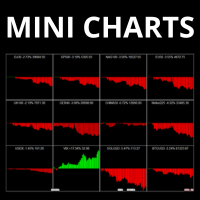
Your market overview, now crystal clear. With our Mini Charts Indicator for MetaTrader 5 , you’ll have the power of multiple charts inside a single, ultra-clean workspace. No more switching between assets or opening dozens of charts. Our Mini Charts give you instant visual snapshots of multiple markets — all in real time. Each mini chart displays the price action of the selected asset, showing whether it’s trending up or down, giving you immediate market sentiment at a glance. Whether you’re mon

# Weekly & Daily Stochastic Signal Indicator User Guide
## Overview This indicator combines the Stochastic oscillator on weekly and daily timeframes to generate strong trading signals. It aims to create more reliable signals by tracking momentum changes across different timeframes.
## Parameters - **ShortPeriod (14)**: Daily Stochastic period - **ShortPeriodSMA (3)**: Daily Stochastic SMA period - **LongPeriod (70)**: Weekly Stochastic period - **LongPeriodSMA (3)**: Weekly Stochastic SMA per

This scanner is based on the Bill Williams Awesome Oscillator (AO) indicator and is designed for faster analysis of financial instruments. The chart shows five vertical columns, which includes a financial instrument that meets certain criteria. The first column shows financial instruments with a strong trend, namely when the AO indicator is above the zero line on three time frames. If there is a strong downward trend in the market, then such instruments will fall into the fifth column. The seco

The "Session Time Vertical Lines" indicator displays vertical lines on the chart that mark the beginning and end of major global trading sessions: Sydney, Tokyo, London, and New York . It is designed to help traders visually identify active market hours, overlaps, and potential high-volume periods directly on the price chart. This tool is especially useful for intraday traders who rely on market session timing to plan entries and exits. Inputs / Settings Parameter Name Description DaysToDraw Num
FREE
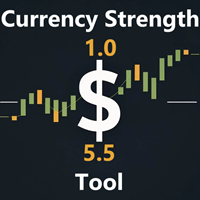
" Currency Strength Tool " is a straightforward and user-friendly indicator designed for analyzing the strength of eight major currencies based on daily price changes of currency pairs. It displays information compactly on the chart in three rows, providing traders with insights into current market dynamics. The indicator serves as an analytical tool, aiding in making informed trading decisions.
It appears as follows: -7.3% 0.5% 0.2% 6.4% 1.2% 3.2% 4.1% 0.4% (daily change) USD E
FREE

The simplest indicator. It emits a standard sound signal (an audio file from the standard MetaTrader library - alert.wav) after a period of time you select. Unfortunately I was unable to add the ability to select your file due to language restrictions. There is a bug in the indicator that I don't know how to fix: when switching the time frame, the sound signal is emitted after about 10-15 seconds.
FREE
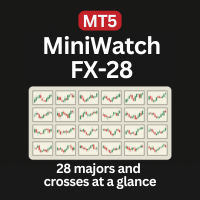
Monitor all 28 Forex pairs at once — clean mini charts, real-time price action, perfect for consistent price pattern traders. Designed for consistent, mechanical, and hybrid traders who repeatedly trade the same price action patterns — such as triangles, flags, trends, and supply/demand zones — across multiple symbols, without relying on indicators.
Core Features: Displays all 28 major Forex pairs in mini chart format , organized in a clean 4-row by 7-column layout. Powered by live price action
FREE
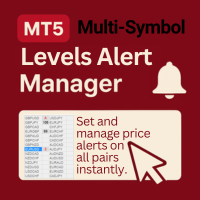
Levels Alert Manager (Beta) is a fast, user-friendly tool for placing and managing price alerts across multiple symbols — ideal for consistent, mechanical, and hybrid trading.
It provides a user-friendly, time-saving alternative to MetaTrader’s default alert system, which can be inefficient and clunky. The process is simple: click the + button, and drag the alert line to the desired level. All alerts are tracked in the panel, displaying live distance to price, with instant notifications trigg
FREE

Arrow Trend indicators Trading with the trend is often one of the most basic pieces of advice given by experienced traders. In addition, experienced traders will often advise traders to prioritize the long-term trend, as prices usually follow the direction of the long-term trend. Arrow trend indicators are tools that traders can use to determine the direction of a trend toward a long-term trend. What is an arrow trend indicator? An arrow trend indicator is a trend-following technical indicator
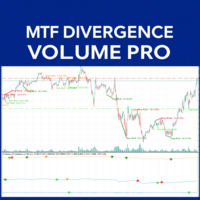
Divergence MTF Volume Pro: Your Ultimate Edge in the Market
Have you ever felt that the market takes you by surprise? Would you like a tool that anticipates possible turns and provides clearer signals for entering or exiting trades? Introducing Divergence MTF Volume Pro! Imagine seeing when price and volume (the force behind movements) start to contradict each other. This, known as divergence, is one of the most powerful signals indicating a potential trend reversal or strong continuation. Our

Dynamic Levels Marker is a smart MT5 indicator that automatically detects and plots three support and three resistance levels using a tiered historical analysis. Levels are visually distinct, labeled, and adapt as price evolves.
Key Features:
Dynamic multi-level support/resistance zones
Tiered logic based on recent price action
Customizable alerts (popup, sound, push notifications)
Clean visual lines with auto-positioned labels
Lightweight and easy to use on any timeframe
Whether you’re

Simple Candle Timer
Overview: The Simple Candle Timer is a simple, yet powerful, tool for traders who want to stay informed about the time remaining until the next candle appears on their chart. Whether you are trading on minute charts or higher timeframes, this indicator ensures you never miss a new candle formation.
Features: Real-Time Countdown Timer: Displays the time left until the current candle closes and a new one starts. The timer updates smoothly every 100 milliseconds for precision

Volume Flow Analyzer The Indicator helps you decode market activity by visualizing real-time volume strength. Whether you're a fast-paced scalper or a patient swing trader , this tool gives you a clearer view of when volume truly supports the price action.
Instructions: Indicator alerts when there is expected increase in volatility by analyzing volumes to allow a trader to prepare. It indicates "High Expected Volatility in such cases", It should be used along with your buy and sell parameters

GoldX PRO is a good trend indicator. The indicator's unique algorithm analyzes the asset price movement, taking into account technical and mathematical analysis factors, determines the most profitable entry points and issues a signal to open a BUY or SELL order. Bonus: When you purchase an indicator GoldX PRO you get the EA GoldX PRO for free.
Advantages of the indicator: The indicator produces signals with high accuracy. The confirmed indicator signal does not disappear and is not redrawn - a
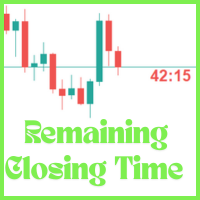
The Candle Remaining Closing Time indicator displays the amount of time left before the current candlestick closes on your chart. This tool is essential for traders who rely on precise timing to enter or exit trades, especially in fast-moving markets. By showing a real-time countdown, it helps you stay aware of upcoming candle completions across any timeframe—from 1-minute to daily charts. Whether you're a scalper watching minute-by-minute action or a swing trader timing key setups on higher tim

The Swing High Low and Fibonacci Retracement Indicator is a powerful technical analysis tool designed to identify key price levels and potential reversal zones in the market. It automatically detects recent swing highs and swing lows on the chart and overlays Fibonacci retracement levels based on these points. This indicator helps traders: Visualize market structure by highlighting recent swing points. Identify support and resistance zones using Fibonacci ratios (e.g., 38.2%, 50%, 61.8%). Adapt
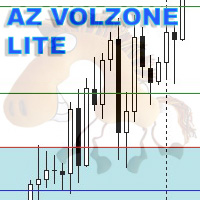
Information: I have developed two versions of the indicator: AZ_Azazavr and AZ_volzone_SYSTEM. The only difference between the AZ_Azazavr version and the AZ_volzone_SYSTEM version is the presence of automatic calculation in the AZ_volzone_SYSTEM version of the indicator and the presence of calculation of a slightly larger number of levels. Otherwise, you are purchasing not just an indicator, but a ready-made trading system.
Friends, many have been looking for a simple and effective system for

The Quasimodo Pattern Indicator is no more difficult than the Head and Shoulders. Still, only a few traders know about it, and some even confuse one with the other. However, this is not a reason to avoid this tool in your forex trading strategy. Features: Automatic Detection: The indicator automatically scans for valid QM patterns across any timeframe, reducing the need for manual chart analysis. Visual Highlights: Clear and customizable on-chart drawing of shoulders, heads, and breakout zones
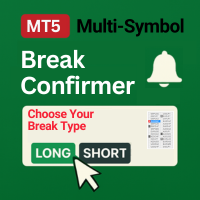
Break Confirmer alerts when price breaks beyond dynamic candlestick patterns. Usage is simple: set alerts with one click and track breaks across multiple symbols in a clear, easy-to-use panel. This tool saves time and helps traders stay focused on the consistent execution of their plan — ideal for those who seek a tool that helps them trade with precision, structure, and discipline.
Note: This tool works in the Strategy Tester without the panel feature. To test the panel, download the FREE Bo
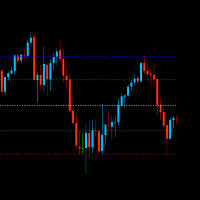
Top and bottom indicator, with the freedom to choose the initial bar and graphic time to be used for calculation regardless of the time frame of the current chart. It also plots mid-range and 23% retracement lines. Good indicator of market strength and current direction of price movement. Also with total freedom of configuration of line types and colors for each line of the indicator. It also has an indicator of the time to bar and open balance in the asset.
FREE

Este es un indicador hecho para indices Crash, en el broker Deriv, o indices Paint en el broker Weltrade. Su funcion es buscar velas de tendencia trend, y es recomendado verlo en temporalidad de 5 minutos o mas. Se que con las velas trend, corres el riesgo que un Spike te sorprenda, sin embargo la idea es ganar pocos pips para no arriesgar mucho. Recuerda que los Spike no respetan Stop Lost pero con una buena gestión de riesgo puede ser rentable. La idea es ganar pocos pips por entradas y este i
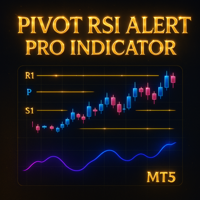
Detailed Description: The Pivot RSI Alert Pro Indicator is a powerful all-in-one indicator that combines five pivot point methods (Classic, Fibonacci, Woodie, Camarilla, DeMark) with a customizable RSI filter. It automatically plots daily pivot levels and midpoints, highlights key reversal zones and sends alerts when price approaches these levels, especially under RSI overbought/oversold conditions. Ideal for intraday and swing traders who rely on dynamic support/resistance and momentum confirm
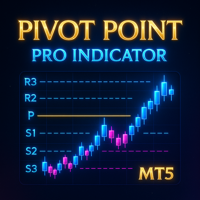
Detailed Description: The Pivot Point Pro Indicator is a powerful all-in-one fully customizable indicator that takes care of five pivot point methods (Classic, Fibonacci, Woodie, Camarilla, DeMark). It automatically plots pivot levels and midpoints, highlights key reversal zones and sends alerts when price approaches these levels. Unlike the free Pivot Point Classic version, this Pro indicator allows users to customize more settings, analyze current and historical pivot points and use al
Market Flow Analysis is a structure-based indicator that goes beyond traditional tools to help you spot real entry opportunities with ease. It highlights the Gold Zone — a gold-filled rectangle showing you the best possible area for entries , based on market structure, not lagging signals. Whether you're scalping or swing trading, this indicator gives you the true market trend , valid order blocks , and clear reaction zones , all in one smart visual layout. Why Market Flow Analysis? Go

Zunächst einmal ist es wichtig zu betonen, dass dieser Trading-Indikator nicht repainted, nicht neu gezeichnet und keine Verzögerungen aufweist, was ihn sowohl für manuelles als auch für algorithmisches Trading ideal macht. Benutzerhandbuch, Voreinstellungen und Online-Support sind enthalten. AI Trend Pro Max ist ein ausgeklügeltes All-in-One-Trading-System, das für Trader entwickelt wurde, die Präzision, Leistung und Einfachheit suchen. Basierend auf jahrelanger Entwicklung früherer Indikatoren

IQ Gold Gann Levels a non-repainting, precision tool designed exclusively for XAUUSD/Gold intraday trading. It uses W.D. Gann’s square root method to plot real-time support and resistance levels, helping traders spot high-probability entries with confidence and clarity. William Delbert Gann (W.D. Gann) was an exceptional market analyst, whose trading technique was based on a complex blend of mathematics, geometry, astrology, and ancient mathematics which proved to be extremely accurate. Download

Multi Currency Multi Time Market Scan Signals It is an Advanced multi-utility dashboard which works with full customization of signal settings and graphical interface. It works with Multi Symbols and Multi-Time frames from 1 SINGLE CHART TEMPLATE. It will automatically open the charts where the latest signals had formed- showing the important levels (Entry, Targets, Stop Loss) Many types of sorting methods for the scanner. A robust ENTRY based on TREND OF MULTI-TIME FRAMES ( Complex Signals

Der IKT-Asiatischer Reichweitenindikator ist ein leistungsstarkes Tool, das Händlern hilft, wichtige Marktstrukturen und Liquiditätszonen basierend auf der ICT Asian Range Trading Strategy zu identifizieren. Es markiert die höchsten und niedrigsten Kursniveaus der asiatischen Handelssitzung (19:00 bis 24:00 Uhr New Yorker Zeit) und liefert wichtige Einblicke in die Marktbewegungen der folgenden Handelssitzungen. Dieser Indikator erhöht die Handelsgenauigkeit durch die Anzeige von Liq
Der High Low Tracker ist ein unverzichtbarer Indikator für alle Trader, die Wert auf Präzision und Klarheit bei der Identifizierung wichtiger Preisniveaus legen. Entwickelt für Trader mit institutionellen Strategien wie ICT (Inner Circle Trader) , BTMM (Bank Trading Market Maker) und SMC (Smart Money Concepts) , vereinfacht dieses Tool die Analyse mehrerer Zeitrahmen, indem es signifikante Hochs und Tiefs direkt in Ihren aktuellen Chart einblendet. Ob Scalping, Daytrading ode
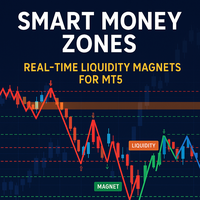
Developed according to the principles of smart money management strategies, the SM Zones indicator is a very convenient tool for traders on the MetaTrader 5 (MT5) platform. It graphically displays on the chart all the significant zones used in the SM strategy: market structure, price levels of increased liquidity, "price magnet" zones - imbalances, order blocks, fvg, breaker blocks and mitigation blocks - towards which the instrument's price moves. The zones influencing the bull market are high
FREE
QQE Divergen – Advanced Trading Indicator
Overview
The QQE (Quantitative Qualitative Estimation) indicator is a powerful trading tool designed to enhance trend detection and market momentum analysis. QQE is an advanced version of the RSI (Relative Strength Index) that utilizes smoothed moving averages and dynamic trailing levels to generate highly accurate signals.
QQE Divergen improves upon the traditional QQE by integrating divergence detection, making it even more effective for identif
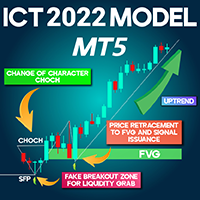
ICT 2022 Model Indicator for MetaTrader 5 The ICT 2022 Indicator is developed based on essential trading principles such as liquidity grabs (Sweep), Change of Character (CHoCH), fake breakouts (SFP), and Fair Value Gaps (FVG) .
By integrating these concepts, the indicator visually represents them on the price chart, making it an invaluable resource for traders and analysts following the ICT trading methodology . «Indicator Installation & User Guide» MT5 Indicator Installation | ICT two thousan
FREE

Overview:
"TrendLine Alerts" is a dynamic, multi-functional trading tool designed to monitor and alert traders in real-time when price action touches or breaks critical technical levels. Built for precision, it seamlessly tracks trendlines, horizontal support/resistance, vertical time-based lines, and equidistant channels , ensuring you never miss a key market movement. Whether you’re scalping, swing trading, or managing long-term positions, this indicator acts as your 24/7 market sentinel. K
English:
Anchored Linear Regression Channel (ALRC)
Description:
The Anchored Linear Regression Channel (ALRC) is an advanced technical analysis tool that enhances the traditional linear regression channel by allowing it to be anchored to a confirmed pivot point. This provides a more accurate and reliable reading of price behavior in relation to key structural points on the chart.
Key Features:
Anchoring to Confirmed Pivots: Manually select a significant pivot to fix the channel, ensuring t

Volume Profile Indicator – User Guide Description: The Volume Profile Indicator is a powerful tool designed for MetaTrader 5. It visualizes market activity using volume distribution across price levels, showing: Histogram of volume at each price bin POC (Point of Control) – the price with the highest traded volume Value Area – the range covering a configurable percentage of volume (e.g. 70%) Support levels: Min, Max, and Pivot Average tick size for BUY and SELL movements Inputs and Parameters:
FREE

Silver Bullet ICT Indicator in MetaTrader 5 The Silver Bullet ICT Indicator is an advanced tool for MetaTrader 5 , designed to analyze market liquidity and key price levels during New York trading hours based on ICT (Inner Circle Trader) principles . This indicator identifies potential trade zones by monitoring high and low price movements and detecting liquidity absorption . When the price reaches a support or resistance level and then retreats to its prior range after capturing liquidity, the
FREE
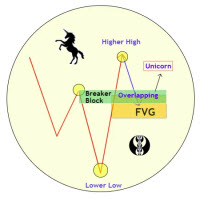
Unicorn Model ICT Indicator — Smart Trading with Precision The Unicorn Model ICT Indicator is a powerful and intelligent tool designed for traders who follow Smart Money Concepts (SMC) and Inner Circle Trader (ICT) methodologies. This indicator simplifies complex price action by visually identifying key market structures and providing high-probability trade setups. Key Features: A Bullish Unicorn Pattern A Lower Low (LL), followed by a Higher High (HH) A Fair Value Gap (FVG), overlapping the est
MFI Divergence is a technical indicator that detects regular bullish and bearish divergences between price and the Money Flow Index (MFI) at swing highs and lows. It highlights potential reversal points by drawing clean green (bullish) and red (bearish) arrows directly on the chart. The indicator uses configurable swing detection, customizable MFI period, and an optional MFI threshold filter to show signals only in oversold/overbought zones. Alerts are triggered only once per bar on candle close
FREE

В индикаторе реализованы 3-хбарные свинги Ганна.
Задача свингов Ганна определяется очень просто: они помогают определять тренд на рынке. Кроме того, они позволяют понять саму суть цены, отбросив все лишнее. С ними гораздо проще найти точки входа на рынок и построить ключевые уровни. Свинги прекрасно устраняют рыночный шум (особенно трехбарные), избавляя трейдера от необходимости отвлекаться на незначительные колебания цены.
FREE
MetaTrader Market bietet jedem Entwickler eine einfache und bequeme Plattform für den Verkauf von Programmen.
Wir unterstützen Sie bei der Veröffentlichung des Produkts und beraten Sie gerne, wie man eine Beschreibung für den Market vorbereitet. Alle Produkte, die im Market verkauft werden, sind durch eine zusätzliche Verschlüsselung geschützt und können nur auf dem Rechner des Kunden gestartet werden. Illegales Kopieren ist ausgeschlossen.
Sie verpassen Handelsmöglichkeiten:
- Freie Handelsapplikationen
- Über 8.000 Signale zum Kopieren
- Wirtschaftsnachrichten für die Lage an den Finanzmärkte
Registrierung
Einloggen
Wenn Sie kein Benutzerkonto haben, registrieren Sie sich
Erlauben Sie die Verwendung von Cookies, um sich auf der Website MQL5.com anzumelden.
Bitte aktivieren Sie die notwendige Einstellung in Ihrem Browser, da Sie sich sonst nicht einloggen können.