Neue technische Indikatoren für den MetaTrader 5 - 9

Structure Levels (Highs & Lows) Indicator for MetaTrader 5
Decode Market DNA — Trade with Institutional Precision Description:
The Structure Levels (Highs & Lows) Indicator is your secret weapon to map the market’s hidden roadmap. Designed for traders who think in terms of price action and market structure, this tool automatically identifies critical swing highs and swing lows, transforming chaotic charts into a clear blueprint of support/resistance zones, breakout opportunities, and trend rev
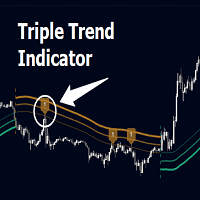
Triple Trend Indicator is a versatile trend-following tool designed to help traders identify trend strength and potential pullback levels using a three-band system. Each band represents a varying degree of price deviation from the mean, providing progressively stronger trend signals.
Key Features:
Three Adaptive Bands:
The indicator dynamically calculates three bands (1, 2, and 3) based on moving averages (SMA, EMA, WMA) and ATR multipliers.
Bands are positioned below the price in a

VWAP Bands Indicator – The Revolution in Trend Analysis! The VWAP Bands Indicator is the ultimate tool for traders seeking precision and clarity in market analysis! Based on the Volume-Weighted Average Price (VWAP) , this indicator not only displays the main trend but also adds three dynamic bands to capture volatility and identify strategic buy and sell zones . Why Use the VWAP Bands Indicator?
Professional Accuracy – Identifies support and resistance areas based on real volume.
Th
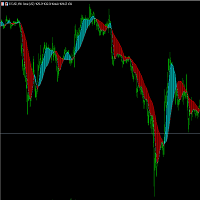
Trend Indicator Pro Use any currency and any time period you want For greater profitability use a risk return of at least 1:3 or 1:4 Entry Signal : Appears after the moving average crossover closes ️️
Histogram Flip : Signals important trend changes ️
Easy to use : Perfect for those who want fast, confident decisions!
Boost your accuracy : Find the best market entry moments with more confidence!
Get straight to the point and seize the best trend opportunities!
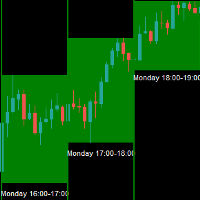
The Entry Signal Analyzer is a sophisticated MetaTrader 5 indicator designed to analyze and identify optimal trading hours based on price movement patterns. The indicator analyzes gold currency only a updated version is currently being developed for other symbol the indicator in the strategy tester is non-functional works on the real chart Statistical Analysis: Analyzes historical price movements for each hour of the trading day Tracks success rates and consistency of movements Calculates poi

Initial Balance Indicator for MQL5 The Initial Balance Indicator is a powerful trading tool for the MetaTrader 5 (MT5) platform that helps traders analyze market structure by marking the Initial Balance (IB) range of a trading session. This range is typically formed during the first X minutes of a trading session (e.g., the first hour in futures markets) and acts as a key reference for potential price movements. Key Features: Customizable Time Period: Define the exact start and end time for the
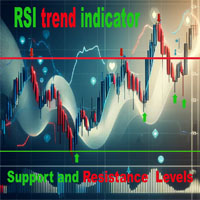
Индикатор RSI Уровни Поддержки/Сопротивления – это мощный инструмент технического анализа, который помогает трейдерам находить точки входа и выхода на основе сигналов RSI и ключевых уровней цены. Индикатор подтверждает зоны перепроданности и перекупленности с учетом исторических максимумов и минимумов. Основные особенности Сигналы на основе RSI: Покупка при перепроданности, продажа при перекупленности.
Динамические уровни: Автоматический расчет ключевых зон поддержки и сопротивления.
Визу

Gaussian scalper indicator based off the same logic used in my gaussian scaler ea. Enjoy!!
The Gaussian Scalper is a precision scalping indicator designed for high-probability trend entries based on advanced filtering techniques. It utilizes a combination of Least Squares Moving Average (LSMA) and Gaussian filtering to detect trend direction and trade signals. The strategy is reinforced by ADX-based trend confirmation, MACD filtering, and a volume threshold for trade validation. Risk management
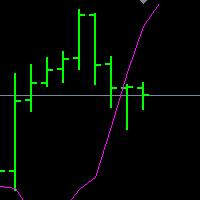
DINAPOLI,MACDP,DMP,XMP,MT5版本 帝纳波利主图MACD指标,国内又叫做:DMP,XMP,MACDP,DNMACDP。 是MACD主图化指标,参数为: FAST=8.3896 SLOW=17.5185 SIGNAL=9.0503 SHIFT=1; 主要作用: 趋势判断,动态压力辅助,SG识别。 是帝纳波利点位交易法不可缺少的指标工具。 1. 只使用 DiNapoliDMP 作为判定趋势的工具。不使用它作为判断超买 / 超卖或动量的指标。 2. 一个上升趋势信号在价格从下向上穿越DMP时被给出。一个下降趋势信号在价格从上向下穿越DMP时被给出。穿越时形成的角度非常重要,陡直的角度,接近于 90 度,往往决定了后续的趋势质量更高。 3. 正确的公式和数字的输入才能使这些研究有效。它们经历了时间的验证。

This trend-following indicator calculates dynamic trailing stops using a modified (or unmodified) ATR method with a Wilder's moving average for smoothing. It displays separate bullish (green) and bearish (red) trailing stop lines that adjust as the market moves. recommended to be used in conjution with Gaussian Scalper XD indicator for trade entry with multiple confirmations. Gaussian Scalper XD: https://www.mql5.com/en/market/product/132204?source
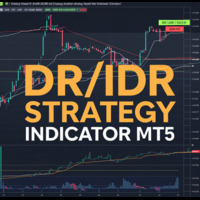
Unlock the full potential of your trading strategy with the DR IDR Indicator and the DR ODR Indicator for MT5. These powerful tools are designed to enhance your trading and increase your market performance, especially during high-volatility periods such as the opening of major stock indices like the DAX, DOW, NASDAQ, and S&P 500. DR / IDR Trading Strategy: Leverage Explosive Price Movements The Opening Range Breakout (ORB) Indicator is a must-have tool to capitalize on the explosive price moveme
Levels Plus Indicator Overview The Levels Plus Indicator is a sophisticated and highly effective tool designed for traders who seek to identify key price levels in the market. This indicator combines multiple key levels and Volume Profile Point of Control (POC) lines to provide a comprehensive view of the market structure. Whether you're a day trader, swing trader, or long-term investor, the Levels Plus Indicator offers valuable insights that can help you make informed trading decisions. Key Fe

Refined Order Block Indicator for MT5
Designed with the principles of ICT and Smart Money strategies, the Refined Order Block (OBR) indicator is an essential tool for traders on the MetaTrader 5 (MT5) platform. It identifies and highlights significant price levels by marking bullish order blocks in green and bearish order blocks in brown. These levels represent potential price reversal areas, often influenced by large institutional and bank orders. As price reaches these key zones, it is likely
FREE

Trendindikatoren sind einer der Bereiche der technischen Analyse und werden im Handel an Finanzmärkten eingesetzt.
Angular Trend Lines -Indikator – bestimmt umfassend die Trendrichtung und generiert Einstiegssignale. Neben der Glättung der durchschnittlichen Richtung der Kerzen
Dabei wird auch der Neigungswinkel von Trendlinien genutzt. Für den Neigungswinkel wurde das Prinzip der Konstruktion von Gann-Winkeln zugrunde gelegt.
Der Indikator für die technische Analyse kombiniert Candlestick-Glätt

Entdecken Sie die wahren, verborgenen Muster des Marktes mit dem PREDATOR AURORA Trading-System – dem Endgegner der hybriden Trading-Indikatoren. Sehen Sie, was andere nicht sehen! Das PREDATOR AURORA Trading-System ist eine Kraft, die für diejenigen entwickelt wurde, die sich weigern, im Schatten der Mittelmäßigkeit zu verharren. Dies ist nicht nur ein weiterer Indikator; es ist der Cheat-Code; es ist Ihr unfairer Vorteil, ein ausgeklügeltes hybrides Jagdsystem, das Marktbewegungen mit tödli

Der Wormhole-Zeitrahmen-Indikator für MetaTrader 5 (MT5) ist nicht nur ein weiteres Handelsinstrument – er ist Ihr Wettbewerbsvorteil auf den Finanzmärkten. Entwickelt für sowohl Anfänger als auch professionelle Händler, verändert der Wormhole die Art und Weise, wie Sie Daten analysieren und Entscheidungen treffen, sodass Sie immer einen Schritt voraus sind. Warum Sie den (kostenlosen) Wormhole-Indikator benötigen Überlisten Sie die Konkurrenz: Die Möglichkeit, zwei Zeitrahmen gleichzeitig auf d
FREE
SAR Vision MTF - Multitimeframe Parabolic SAR Indicator for MT5 ist ein fortschrittlicher Multitimeframe Parabolic SAR-Indikator, mit dem Sie Parabolic SAR-Werte aus höheren Zeitrahmen direkt im aktuellen Chart anzeigen können. Dieses Tool bietet Händlern eine klarere Sicht auf langfristige Trends, was einen präziseren Handelseinstieg und -ausstieg ermöglicht.
Hauptmerkmale: Multitimeframe-Analyse - Verfolgen Sie Parabolic SAR-Werte von höheren TFs (M5, M15, H1, H4, etc.) auf niedrigeren
Un order book, ou carnet est un outil numérique qui affiche en temps réel les ordres d'achat et de vente pour un actif financier spécifique, comme une action, une crypto-monnaie ou une paire de devises. Il permet aux traders de visualiser la profondeur du marché, c'est-à-dire la quantité d'ordres d'achat et de vente à différents prix. Voici une description des éléments clés d'un order book : Colonne d'achat (Bid): Affiche les ordres d'achat en attente pour un actif. Les prix d'achat sont classés

Order Block Indicator for MT5
The Order Block Indicator (OB) is a highly efficient tool tailored for traders utilizing ICT and Smart Money trading methodologies. Specifically built for the MetaTrader 5 (MT5) platform, this indicator enables traders to pinpoint crucial price zones where major financial institutions execute their orders. These areas often act as key decision points, where price movements tend to reverse after encountering liquidity. Traders can leverage this tool to refine their
FREE
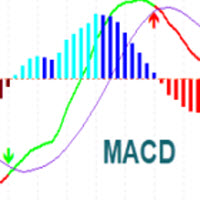
MACD Indicator It has MACD line, Signal line, and Histogram. The Histogram has 4 colors based on Direction Above and Below the Zero Line, showing its movement direction as simple as possible. Allows Show MACD & Signal Line, Show Change In color of MACD Line based on cross of Signal Line. Show Dots at Cross of MacD and Signal Line, Turn on and off Histogram. Enjoy your trading experience, and feel free to share your comments and reviews.
If you are interested in this indicator, you might be i
FREE

Download the Laguerre RSI Indicator for MT5 The Laguerre RSI indicator is a powerful trend-following oscillator designed for MetaTrader 5. It can function independently as a trading tool or serve as a supporting confirmation indicator within broader strategies. Unlike the traditional RSI, it significantly reduces signal lag, particularly in extended time frames. Additionally, it employs a gamma (Γ) filter that minimizes price fluctuations, leading to fewer misleading signals. «Indicator Ins
FREE
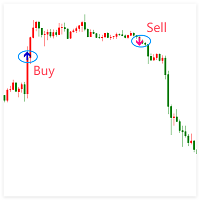
Extreme Breakout Signal is a trading strategy based on price breaking through key support or resistance levels. It indicates potential trend shifts, allowing traders to capture new upward or downward movements.
Parameter extreme radius: extreme radius( Different parameters can be set for different periods ) Key Principles Support & Resistance : Prices often reverse near these levels; breaking them may signal a new trend. Confirmation : Use volume or other indicators to verify the breakout's

This isn't just an indicator; it's a top-tier market analysis tool that combines the power of various technical analysis techniques into one package. Perfect for traders seeking precision and clarity in their trading decisions. Key Features: HiLo Activator: Easily capture the essence of market trends. This component differentiates between bullish or bearish markets, helping you to be on the right side of the move. MACD (Moving Average Convergence Divergence): Quickly identify changes in market
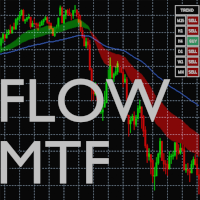
This indicator takes as parameters the periods for three moving averages (Short, Long, Very_Long) and displays them for the current timeframe: - in the form of a cloud (green if Short is greater than Long, red if Short is less than Long) - as a line for the Very_Long moving average. It also allows you to display the status (BUY or SELL) of these same moving averages but for the M15, H1, H4, W1 and MN1 timeframes. This information is summarized in the window titled "TREND", where, for each timefr
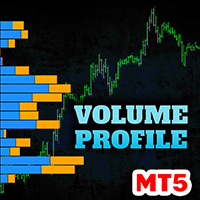
Contact me after payment to send you the user manual PDF file. Download the MT4 version here. Volume Profile Indicator A functional and useful tool that can improve your trading plan.
This indicator calculates volume in price levels(typical volume indicator shows only candle volumes).
With the volume of price levels, you can identify important areas that have the potential to reverse. You can also see the volume of support and resistance levels and decide on them.
Using volume profiles along
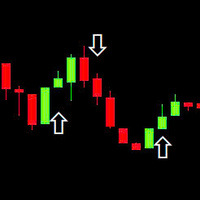
This indicator is based on the RSI (Relative Strength Index) to identify potential Breakout points and draw arrows on the chart to suggest buy/sell signals. Use RSI to find breakout signals. Draw Buy/Sell arrows on the chart. Send alerts when there is a trading signal. Buy (Orange Arrow - 0xFFAA00): When a buy signal appears. Sell (Blue Arrow - 0x0000FF): When a sell signal appears. DRAW_ARROW: Used to draw arrows on the chart.
FREE

Discover the Power of the QDOTRAXY Indicator: Your Key to Precise Trading Decisions! Have you ever imagined having a powerful ally that combines advanced technical analysis with real-time alerts to maximize your market operations? We introduce ULTRA ADVANCED, the indicator that revolutionizes how you make buy and sell decisions. Why Choose QDOTRAXY? Unmatched Accuracy: QDOTRAXY combines multiple technical indicators (MACD, Bollinger Bands, SAR, and Moving Average) to generate highly reliable si

A tool for creating Bill Williams indicators Our tool provides the ability to set Bill Williams indicators on a chart with a mouse click. - The Awesome Oscillator (AO) indicator helps to assess the driving force of the trend. - Alligator indicator — determines the current state of the trend and possible entry and exit points. - Fractals indicator — helps to identify significant levels - Accelerator Oscillator (AC) indicator — shows the change in trend acceleration. - Market Facilitation Index
FREE

The THREE DRAGONS is a technical indicator that portrays three mystical Chinese dragons flying through the price chart:
1. The Green Dragon (SeaGreen): - The most agile and fastest of the three - Reacts quickly to market direction changes - Usually leads the movements
2. The Red Dragon (Tomato): - Moves with balance between speed and caution - Confirms movements initiated by the Green Dragon - Its interactions with the Green Dragon may indicate opportunities
3. The Black Dragon (Black): - Th
FREE
QUICKVIEW MT5 A simple indicator to instantly highlights asset variations, delivering crystal-clear market insights at a glance. Effortlessly track multiple assets with visual simplicity, enabling quicker, smarter, and more confident trading decisions daily.
Key Benefits Real-Time Asset Tracking :: Instantly monitor multiple assets simultaneously, never missing a critical market move. Flexible and Intuitive Display :: Personalize your view, displaying assets exactly as you want—clear, concise
FREE

CATALYST Indicator Version: 1.03
Author: KWAKU BONDZIE GHARTEY
Released: 1st Feb @ 2025 Description The CATALYST Indicator is not just another tool on your chart—it is a revolutionary, next-generation technical analysis system engineered to transform your trading experience. Designed with cutting-edge algorithms and multi-timeframe analysis capabilities, the CATALYST Indicator delivers lightning-fast, pinpoint signals that have redefined performance analysis for traders across all major market

This indicator overlays higher timeframe candles on the lower timeframe chart. You have option to make the candles Hollow (outline) or Solid (fill) for better visibility and analysis of your charts. You can easily change your chart timeframes ( to any lower timeframe than the indicator input) while using this indicator for true multi-timeframe analysis.
Features: Timeframes from 1 Min to 1 Month Minimal Inputs Customize candle body, color etc.
Inputs: Candles Period - Choose the timeframe f
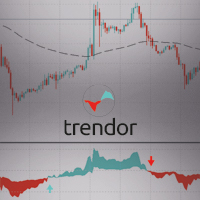
The TRENDOR 1.0 indicator is designed to identify and filter market trends using a combination of RSI and ATR indicators. This powerful trend detection system helps spot significant RSI crossovers while filtering out false signals using an ATR and an EMA (Exponential Moving Average). The purpose of this indicator is to provide clear and precise signals for optimal trading decision-making.
Main features:
Short and Long RSI: Combines the values of two RSIs (short and long) to detect market tr
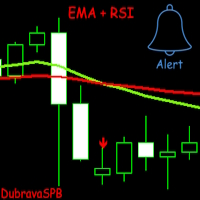
Introducing EMA + RSI – A Trading Indicator Combining Exponential Moving Average (EMA) and Relative Strength Index (RSI) Analysis. The indicator signals trade entries with arrows on the chart when two EMAs cross and the RSI meets the specified conditions.
It is initially optimized for the GBPUSD currency pair on the 1H timeframe, but users can customize it to fit their strategy. Key Features: Flexible settings: Users can adjust EMA length, choose the price for calculation, and configure RSI para
FREE
This indicator collects and systematizes the data about the spread. Its code was profiling several times and optimized in such a way that despite the presence of graphics not to slow down the work of the MT5 terminal. In addition, the indicator provides for the mode of complete invisibility (while the indicator continues to collect data and save it). Having returned to the visual display mode, you can see the work done by him.
Advantages and capabilities of the SpreadFix indicator: 1. Collects
FREE

Maximize your trading performance with Dd-uP , a revolutionary indicator based on an Exponential Moving Average (EMA) smoothing. This indicator is represented by a distinct yellow line on your charts, making it easy to identify market trends and providing precise and reliable trading signals. Key Features: Advanced EMA Smoothing : Track market trends with an EMA smoothing that reacts quickly to price changes, offering precise and real-time analysis. Buy and Sell Signals : Receive clear signals w
A comprehensive MT5 trading performance indicator designed to provide real-time analytics of your trading activity on chart.
Key Features: - Dual tracking modes: Chart Symbol or Magic Numbers - Customizable display with toggle options for each metric - Adjustable font size for better visibility - Real-time updates with color-coded results
Performance Metrics: - Total Profit/Loss: Track overall performance - Total Trades: Monitor trading frequency - Win Rate: Measure trading success percentage
FREE

Checklist Indicator for MT5 Streamline your trading process with the Checklist Indicator —a powerful tool designed to keep you disciplined and organized. This indicator allows you to create and manage a personalized checklist directly on your chart, ensuring you follow your trading rules before entering a position. ️ Customize your own trading checklist
️ Stay consistent and avoid impulsive trades
️ Improve decision-making with structured analysis
️ Seamlessly integrates into your MT5 workfl

Utility of the Indicator Multifaceted Analysis : Allows for a comprehensive view of the market through different metrics (trend, volatility, momentum, risk, support/resistance). Trading Signals : Offers clear buy and sell signals, aiding traders in making entry and exit decisions. Risk Management : The risk buffer helps to assess when it is safe or risky to execute trading operations. Customizable Visualization : With multiple colors and chart styles, it becomes easy for the trader to interpre

Heiken Ashi Smoothed – The Ultimate Trend Filtering Indicator for MT5 Enhance Your Trading with Smoother Trends! The Heiken Ashi Smoothed indicator is a powerful tool designed for traders who want clearer trend signals while eliminating market noise. Unlike traditional Heiken Ashi candles, this smoothed version provides fluid, lag-free price action , making it perfect for swing trading, trend following, and long-term analysis. Key Features: Crystal-Clear Trends – Filters out market noise
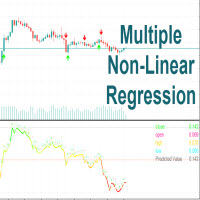
Multiple Non-Linear Regression This indicator is designed to perform multiple non-linear regression analysis using four independent variables: close, open, high, and low prices. Here's a components and functionalities: Inputs: Normalization Data Length: Length of data used for normalization. Learning Rate: Rate at which the algorithm learns from errors. Show data points: Show plotting of normalized input data(close, open, high, low) Smooth?: Option to smooth the output. Smooth Length: Length of
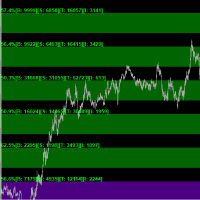
Key Features: • Multi-Zone Analysis: Track volume patterns across multiple customizable price zones • Real-Time Volume Tracking: Monitor buy/sell pressure as it develops • Dynamic Price Levels: Automatically adjusts zones around daily opening prices • Advanced Statistics: View detailed volume metrics and price action percentages
Technical Capabilities: • Volume Distribution Analysis - Buy/Sell volume ratios - Volume imbalance detection - Total trading activity monitoring - Price action directio
In the dynamic world of forex trading, technical analysis is an essential tool for traders seeking to navigate the complexities of the currency markets. One key element of this analysis is the interpretation of candlestick patterns, particularly the phenomenon of consecutive one-sided candles. These candles, characterized by a uniform direction — either completely bullish or bearish — offer significant insight into market sentiment and potential future movements. Understanding the implications o
This indicator automatically identifies and plots key support/resistance (S/R) levels on price charts using a hybrid algorithm combining fractal detection , price touch validation , and dynamic level managemen. Key Features
Support and Resistance Levels: Support levels and Resistance levels are drawn in red . Fractal-Based Detection: Levels are identified based on fractal highs and lows. Efficient Memory Handling: The number of levels is limited to 100 to avoid clutter. Cleanup on Deletion: All

Initialize RSI with period 2 above the closing price. Initialize EMA with period 20 above the closing price. Buy condition: RSI < 15 (oversold). Closing price of 4 consecutive candles > EMA (uptrend). Place BUY signal at the bottom of the candle. Sell condition: RSI > 85 (oversold). Closing price of 4 consecutive candles < EMA (downtrend). Place SELL signal at the top of the candle
FREE

AriMax – AI-Powered Trading Robot AriMax is a cutting-edge AI-powered trading robot designed to help traders maximize profits while minimizing risk. Utilizing advanced machine learning algorithms and real-time market analysis, AriMax identifies high-probability trade opportunities with precision and speed.
Key Features: AI-Driven Market Analysis – Analyzes market trends and patterns to make data-driven trading decisions.
Automated Execution – Places trades seamlessly with optimiz

Der Indikator zeigt die Trendrichtung von mehreren Zeitrahmen in einem Fenster an. Wenn der Trend aus mehreren Zeitrahmen übereinstimmt, werden Pfeile eingezeichnet. Sie können auch zum Histogramm wechseln, das den Trend im aktuellen Zeitrahmen anzeigt. Der Indikator zeichnet Einstiegspunkte und ungefähre Ausstiegspunkte auf dem Chart ein.
Achtung: Da der Indikator mehrere Zeitrahmen umfasst, sollten bei der Verwendung im Strategietester die Kurse für alle erforderlichen Zeitrahmen im Voraus h
ATR Power Levels Smart Support Resistance Indicator! What makes this indicator unique?
Unlike traditional support & resistance tools, ATR Dynamic Zones uses Adaptive ATR calculations to detect peaks & valleys with extreme accuracy. Once price breaks above or below a key level, the zone is automatically converted into a buy or sell area , giving traders a clear roadmap for smart entries & exits. How It Works:
Detects peaks & valleys dynamically using ATR-based price movement
Highli

Der Wormhole-Zeitrahmenindikator für MetaTrader 5 (MT5) ist nicht nur ein weiteres Trading-Tool – er ist Ihr Wettbewerbsvorteil auf den Finanzmärkten. Entwickelt für Anfänger und professionelle Trader gleichermaßen, revolutioniert der Wormhole, wie Sie Daten analysieren und Entscheidungen treffen, und sorgt dafür, dass Sie immer einen Schritt voraus sind. Warum Sie den Wormhole-Indikator brauchen Überlisten Sie die Konkurrenz: Die Möglichkeit, zwei Zeitrahmen gleichzeitig in einem Diagramm anzuz
FREE
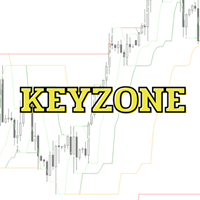
Keyzone ist ein Indikator, der entwickelt wurde, um Unterstützungs- und Widerstandsniveaus zu identifizieren. Diese sind in vier Hauptstufen unterteilt: 3, 8, 21 und 89 . Diese Niveaus basieren auf einer fortgeschrittenen Anpassung des Smart Money Concept (SMC) und bieten eine hohe Effizienz bei einfacher Anwendung. Dank seines minimalistischen und dennoch leistungsstarken Designs kann Keyzone in verschiedenen Handelsstilen eingesetzt werden, darunter:
Scalping – Schnelle, hochfrequente Trades S
FREE
The Channel Sgnals ProfRoboTrading Indicator for MT5 is an effective Forex trading tool designed to track market movements. The MT5 signal point indicator effectively detects trend reversals after they have already occurred. This Indicator is a fully automated technical tool that includes a number of parameters to track market trends. It automatically examines the ever-changing price dynamics of the market, compares the information with earlier data and generates a trading signal. Because
FREE
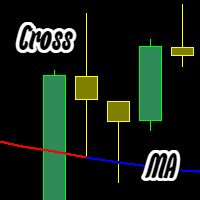
Der Indikator zeichnet einen zweifarbigen Gleitenden Durchschnitt (MA): Blau — Eröffnungs- und Schlusskurs des vorherigen Balkens liegen über der MA-Linie. Rot — Eröffnungs- und Schlusskurs des vorherigen Balkens liegen unter der MA-Linie. Anpassbare Einstellungen: MA-Typ (Einfach, Exponentiell, Geglättet, Linear); MA-Periode; Alarm bei Farbwechsel der MA. Bei Fehlern bitte melden — wir korrigieren sie! bar cross Moving cross candle cross Moving cross bar cross MA cross candle cross MA cross
FREE

Der Volume Bar POC Indikator ist ein innovatives Werkzeug, das eine präzise Visualisierung der Schlüsselpreiszonen (Point of Control, POC) auf Basis des Tick-Volumens bietet. Dieser Indikator analysiert jeden Preisbereich innerhalb einzelner Kerzen und zeigt die bedeutendsten Level an, die als starke Unterstützungs- und Widerstandszonen genutzt werden können. Ideal für kurzfristige und langfristige Handelsstrategien. Wie funktioniert der Volume Bar POC Indikator? Der Indikator verwendet eine
Der Indikator generiert Einstiegssignale für BINÄRE OPTIONEN ODER FOREX SCALPING, Normalerweise sehen Sie auf dem Diagramm einen Pfeil, der auf der letzten Kerze erscheinen oder verschwinden kann. Das ist normal: Der Indikator verarbeitet die Daten und liest die Bedingungen zum Senden eines Einstiegssignals. Die Bedingungen ändern sich jede Sekunde, daher erscheint und verschwindet das Signal. DIES IST IM GRUNDE EINE HINWEIS AN DEN HÄNDLER, SICH BEREIT ZU SEIN, da sich die Bedingungen für einen

The Extreme Spike PRT Indicator is an effective tool for identifying sharp market fluctuations . It performs its calculations using the ATR (Average True Range) indicator and displays candles with extreme volatility in two categories: primary spikes and secondary spikes , within the Metatrader platform oscillator window. This tool assists traders in detecting intense price movements and conducting more precise analyses based on these fluctuations. Time Frame 15-minute - 1-ho

ZigZag Indicator for MT5
The ZigZag Indicator is a valuable tool available in MetaTrader 5, designed to highlight the highs and lows on a price chart. By marking pivotal turning points in price—commonly referred to as Pivot Highs and Lows (HH-HL-LH-LL)—it simplifies the process of identifying price trends. In any price movement, consecutive peaks and troughs are formed. Understanding these patterns correctly is essential for recognizing the direction of the overall market trend or short-term fl
FREE
Tired of drawing opening range breakout line? Maximize your trading potential with the Range Breakout Indicator and the Opening Range Breakout (ORB) Indicator for MT5, two essential tools designed to enhance your trading strategy and boost your market performance. These powerful indicators allow you to profit from the explosive price movements that often occur at the opening of major stock indices, such as the DAX, DOW, NASDAQ, and S&P500. By leveraging the Opening Range Breakout Indicator, you

As an ICT or SMC trader you must do top-down analysis, and you struggle to make template of drawing object on Metatrader just like you normally do on Tradingview. Well, Drawing Assistance indicator will make your top-down analysis much easier on Metatrader. Allow to design template for 3 timeframes. (HTF, MTF and LTF). Each objects drawn on chart will have the color, style and visibility individually by the timeframe it was drawn on. Save time as all analyzing is done on Metatrader chart. Shortc
The Stochastic RSI (StochRSI) is a technical indicator that combines the characteristics of the Relative Strength Index (RSI) with the Stochastic Oscillator, resulting in a more sensitive tool that generates a higher number of trading signals. Developed by Tushar Chande and Stanley Kroll, the indicator was designed to overcome a perceived limitation of the traditional RSI: the low frequency of overbought and oversold levels activation (commonly 80 and 20), especially in less volatile assets. Ho
FREE

Fair Value Gap (FVG) Indicator for MetaTrader 5
The Fair Value Gap (FVG) Indicator is an effective tool designed to spot trading opportunities in MetaTrader 5 by identifying imbalances in supply and demand. These imbalances, known as FVGs, emerge when the price moves aggressively. To explain simply, imagine three candlesticks: the gap between the first and third candlestick forms the " FVG ." This indicator highlights these gaps as dynamic boxes—green for bullish FVGs and red for bearish FVGs.
FREE
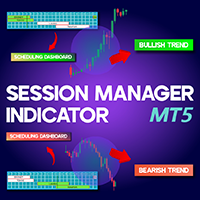
Session Manager Indicator MT5 Effective time management and understanding market activity are vital for traders in the fast-paced financial markets. Different trading symbols exhibit unique behaviors and levels of activity during specific time periods. The Session Time Manager indicator for MetaTrader 5 enables traders to monitor time and analyze price movements. This tool highlights key trading sessions—New York, London, Sydney, and Tokyo—by overlaying boxes on the price chart. «Indicator Insta
FREE

RSI on Moving Average Indicator for MT5
The RSI on MA Indicator integrates Moving Average Crossovers with the Relative Strength Index (RSI) to enhance trend detection and momentum analysis. By merging these technical elements, it improves precision in identifying market movements. The indicator displays two oscillating lines ranging from 0 to 100, making it easier to pinpoint buy and sell opportunities while clarifying trend directions. «Indicator Installation & User Guide» MT5 Indicator Instal
FREE

Summary
This indicator plots multiple pivot points (support and resistance levels) using various calculation methods, allows customization of their appearance, and can alert when price touches these levels. It works on different timeframes and can display historical levels or just the current ones.
Overview Purpose : Plots dynamic pivot levels (Pivot, S1-S4, R1-R4) on the chart to help identify potential price reversal zones. Key Features : Supports 7 calculation methods (Classic, Camarilla

Based on the Extreme Trend Indicator on Trading View converted for MT5. Usage of the Indicator is free, but if you want the source code, you can purchase the source code by messaging me.
Extreme Trend is an indicator that identifies when a new trend is forming and creates a trading signal. This indicator can be used for many markets, forex, gold etc. If you have any inquiries or want to create an EA using this indicator, you can message me.
FREE
GammaLevels Indicator! What makes this indicator unique?
Unlike traditional support & resistance tools, ATR Dynamic Zones uses Adaptive ATR calculations to detect peaks & valleys with extreme accuracy. Once price breaks above or below a key level, the zone is automatically converted into a buy or sell area , giving traders a clear roadmap for smart entries & exits. How It Works:
Detects peaks & valleys dynamically using ATR-based price movement
Highlig

Overview The Waterfall Trading Indicator is a powerful momentum detection tool designed to identify high-probability trading opportunities across multiple timeframes. Built on pure price action analysis, this indicator provides clear, non-repainting signals that are especially effective for binary options and forex trading. Key Features Non-Repainting Signals : Based on real-time price action, ensuring reliable trade signals Multi-Timeframe Compatibility : Effective across all timeframes, with o
The indicator shows the strength of the trend if the green number is more than 50, you need to look for a signal to buy, and on the contrary, the red number is more than 50, you need to look for a sell,
The indicator is based on the Heiken Ashi candle
the indicator is suitable especially for scalping and medium-term trading
REMEMBER THE INDICATOR DOES NOT GUARANTEE A WINNER BUT IT HELPS TO MAKE CORRECT TRADING
THE RISK ON THE TRANSACTION WILL BE NO MORE THAN 3 PERCENT
FREE

Fibo Extrema Bands is a unique indicator that visually demonstrates when the market shifts into a trend and highlights key levels acting as support or resistance. It combines easy-to-read “stepped” extrema lines with Fibonacci levels (whose values can be adjusted in the indicator’s inputs), simplifying the search for entry and exit points. Install Fibo Extrema Bands to gain a powerful tool for trend analysis and for identifying critical price levels! This product is also available for MetaTrade
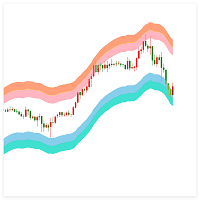
Indicator Introduction: The Volatility Range Indicator aims to help traders identify the current market's volatility range by analyzing historical price data. By calculating the upper and lower bounds of price fluctuations, traders can determine potential support and resistance levels, providing a foundation for subsequent trading decisions. This indicator is particularly suitable for ranging markets and high-volatility environments, as it can effectively assist traders in capturing price breako

This indicator is based on Mr. Mark Fisher's ACD strategy, based on the book "The Logical Trader."
- OR lines - A lines - C lines - Daily pivot range - N days pivot range - Customizable trading session - Drawing OR with the desired time Drawing levels A and C based on daily ATR or constant number - Possibility to display daily and last day pivots in color zone - Displaying the status of daily PMAs (layer 4) in the corner of the chart - Show the order of daily pivot placement with multi-day piv
FREE
Erfahren Sie, wie man einen Handelsroboter im MetaTrader AppStore, dem Shop für Applikationen für die MetaTrader Handelsplattform, kaufen kann.
Das Zahlungssystem der MQL5.community ermöglicht Zahlungen mit PayPal, Kreditkarten und den gängigen Zahlungssystemen. Wir empfehlen Ihnen eindringlich, Handelsroboter vor dem Kauf zu testen, um eine bessere Vorstellung von dem Produkt zu bekommen.
Sie verpassen Handelsmöglichkeiten:
- Freie Handelsapplikationen
- Über 8.000 Signale zum Kopieren
- Wirtschaftsnachrichten für die Lage an den Finanzmärkte
Registrierung
Einloggen
Wenn Sie kein Benutzerkonto haben, registrieren Sie sich
Erlauben Sie die Verwendung von Cookies, um sich auf der Website MQL5.com anzumelden.
Bitte aktivieren Sie die notwendige Einstellung in Ihrem Browser, da Sie sich sonst nicht einloggen können.