Neue technische Indikatoren für den MetaTrader 5 - 23

The indicator places a buy or sell signal when the conditions of the strategy it was designed with are met. The strategy is guaranteed, strong, and has been tested for 9 years. The indicator is for binary options and can be converted into a bot by linking it to MT2Trading, where it sends the signal to this platform. This platform automatically opens a trade on the trading platform you are using, whether it is Pocket Option, IQ Option, or any other binary options platforms. The entry is on the n

The indicator displays the total number of ticks during the formation of a single bar. It can be used to analyze market activity in financial trading. Peaks and troughs of the indicator effectively highlight potential reversal points in price movements. This tool is particularly useful for traders seeking to identify periods of high volatility, allowing them to make informed decisions based on tick volume patterns. By observing changes in tick frequency, traders can gain insights into market se

Dynamic Range and Target Indicator: Your Reliable Trading Partner
Introducing an innovative indicator that revolutionizes how you analyze markets and make trading decisions. Whether you're a beginner seeking clear guidance or an experienced trader looking to enhance your strategy, this tool is designed to meet your needs.
Key Features:
1. Dynamic Range Determination: The indicator continuously analyzes the market, identifying the most recent significant price ranges.
2. Clear Support an

The indicator places a buy or sell signal when the conditions of the strategy it was designed with are met. The strategy is guaranteed, strong, and has been tested for 9 years. The indicator is for binary options and can be converted into a bot by linking it to MT2Trading, where it sends the signal to this platform. This platform automatically opens a trade on the trading platform you are using, whether it is Pocket Option, IQ Option, or any other binary options platforms. The entry is on the ne
This never-before-seen Indicator is a histogram of the MACD lines crossing. It has never been easier to observe a trend reversal in advance. It fixes the crossing points of the MACD lines on the chart according to your parameter settings. Ideal for anticipating trends and studying the stock market. Detailing the Indicator: It accurately indicates the crossing of the MACD and Signal lines, being later confirmed by the MACD indicator as confirmation of the trend. it confirms the macd crossing wit

Finanzindikator SolarTrade Suite: Mercury Market Indicator – Ihr zuverlässiger Führer in der Welt der Finanzmärkte! Unser Forex-Handelsprogramm ist mit einer leistungsstarken künstlichen Intelligenz ausgestattet, die Marktdaten in Echtzeit analysiert. Es sagt Preisbewegungen genau voraus und hilft Händlern, fundierte Entscheidungen zu treffen. Mit fortschrittlichen Algorithmen optimiert unser Indikator Strategien und minimiert Risiken für Händler. Es handelt sich um einen gleitenden Durchschnit

Volume Break Oscillator ist ein Indikator, der Preisbewegungen mit Volumentrends in Form eines Oszillators in Einklang bringt.
Ich wollte Volumenanalysen in meine Strategien integrieren, war aber von den meisten Volumenindikatoren wie OBV, Money Flow Index, A/D, aber auch Volume Weighted MACD und vielen anderen immer enttäuscht. Deshalb habe ich diesen Indikator für mich selbst geschrieben, bin zufrieden mit seiner Nützlichkeit und habe mich daher entschieden, ihn auf dem Markt zu veröffentlic

Moving Pivot Average The Moving pivot indicator compares the selected period with its counterpart from the previous period. The indicator uses very flexible algorithm for pivot value calculating. It allows you to allocate in days a certain time intervals (custom bars) and calculate the average pivot value based on High, Low and Close prices of these bars. How many custom bars will be taken into account is determined by the "Days" setting. The pivot line can be considered an average trend line

COLORED TREND MA / MACD CANDLES draw MA Candles above/below Moving Average draw MACD Candles above and below 0 and Signal-Line
Your Advantage: a simple view of the trend direction a simple view over the higher trend direction a calmer chart for the eye clear rules can be defined Settings: Value Quick-Set : pre-Settings MACD 3 / 9 / 6 MACD customize MA Candles Fast EMA : 12 Slow EMA : 26 MACD SMA : 9 1. MA Period : default 14 and 20, which are my favorite for all timeframes, I believe in the 14
FREE

Dominant Candle Finder is a significant candlestick on a price chart that stands out due to its size, volume, or price movement compared to surrounding candles. It often indicates strong buying or selling pressure and can be used to identify potential reversal points, breakouts, or continuations in the market. Dominant candles can serve as key indicators for traders to make informed decisions, providing insights into market sentiment and potential future price movements. MT4 Version - https://w
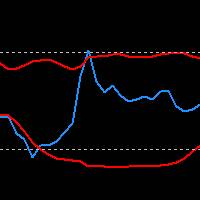
RSI Indicator with Bollinger Bands: Maximize Your Win Rate with Precision and Advanced Trading Strategies Take your trading to the next level with the RSI Indicator combined with Bollinger Bands. Customize the RSI period, band moving average, and deviation to tailor the indicator to your unique strategies. Upon request, we also offer the possibility to customize or create bespoke indicators to best meet your trading needs.
A MUST HAVE - NON REPAINT INDICATOR - that will help you to make the decision whether to Buy or Sell , including where to set the Take Profit and Stop Loss . The Buy/Sell signal will not redraw nor repaint until the next new signal occurs. The Take Profit and Stop Loss will change following the market conditions. Our indicator will give alert to your mobile/handphone when new buy/sell signal arrive. For best result, combine this indicator with your knowledge on price action and support & resista

Price Sessions is an exclusive MetaTrader 5 indicator that integrates symbol information and trading sessions into your chart. It does not link to any account information or external sources, ensuring user safety. Main Features: 1. Symbol Information Current Symbol Live Price Live Spread 2. Trading Sessions (Time zone UTC/GMT+0) Tokyo session London session New York session If you find this utility helpful, please rate it. If you encounter any issues or have suggestions, pleas
FREE

If you like this project, leave a 5 star review.
Follow on TikTok: @quantum.trader
[ Any Symbol Can Be ADDED ] DM me for adding any Pair symbol, crypto, index, stock or anything related. you can also DM me in TikTok [@quantum.trader] Works on [ EURUSD-GBPUSD-GBPJPY-USDJPY-XAUUSD-US30-BTCUSD-ETHUSD-SOLUSD ]
This indicator calculate and draw the Prediction or Forecast the peaks of the current day ( forecast high - forecast low - forecast middle - forecast upper q - forecast lower q
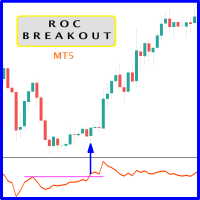
When prices breakout resistance levels are combined with Rate of Change oscillator "ROC" oscillator breaks out its historical resistance levels then probability emerges to record farther prices. It's strongly encouraged to confirm price breakout with oscillator breakout since they have comparable effects to price breaking support and resistance levels; surely, short trades will have the same perception. Concept is based on find swing levels which based on number of bars by each side to confirm
FREE

Rivoluziona il Tuo Trading con l'Indicatore di Segnali Scalping su Timeframe Multipli Scopri il segreto del successo nel trading con il nostro esclusivo indicatore di SEGNALI scalping su timeframe multipli. Questo strumento avanzato è progettato per trovare segnali efficienti e precisi, aiutandoti a massimizzare i profitti e a ridurre i rischi associati al trading veloce L'indicatore di segnali Alien Scalper MTF è uno strumento di analisi tecnica altamente efficace, progettato per identificare
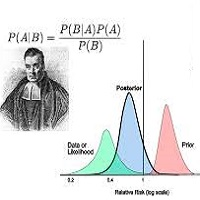
Bayesian methods can be effectively applied to predict price trends in financial markets, including Forex, stocks, and commodities. Here’s how Bayesian techniques can be used for trend prediction: 1. Bayesian Linear Regression Bayesian linear regression can be used to model the relationship between time and price. This method allows for the incorporation of prior beliefs about the trend and updates the trend as new data comes in. Example: Suppose you want to predict the price trend of a currency
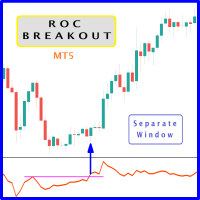
When prices breakout resistance levels are combined with Rate of Change oscillator "ROC" breaks out its historical resistance levels then higher chances emerges to record farther prices. It's strongly encouraged to confirm price breakout with oscillator breakout since they have comparable effects to price breaking support and resistance levels; certainly short trades will have the same perception. Concept is based on find swing levels which based on number of bars by each side to confirm peak or
FREE
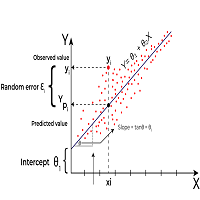
Linear Regression is a statistical method used to model the relationship between two or more variables. The primary goal of Linear Regression is to predict the value of one variable (called the dependent variable or outcome variable) based on the value of one or more other variables (called independent variables or explanatory variables) Linear Regression can be applied to technical analysis, and it is indeed one of the tools used by traders and analysts to make predictions and identify trends i

RSI Divergence Signal
The RSI Divergence Signal is a technical analysis tool used in financial markets to identify potential trend reversals. It compares the Relative Strength Index (RSI) with price action to detect divergences. When the RSI moves in the opposite direction of the price, it signals a potential change in momentum, suggesting that the current trend may be weakening. This divergence can indicate a buying opportunity in a downtrend or a selling opportunity in an uptrend. Traders u
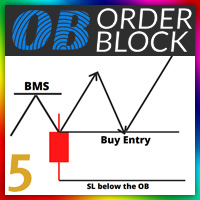
Orde Block Detector: The order block detector can automatically identify the breakthrough of the market structure. After the trend framework breaks through, the order block area can be drawn automatically. In order to draw the OB area more accurately, we also automatically find the candle on the left and right sides of the original candle according to its trading principle, and draw a more accurate ob area through more subtle quantitative rule judgment. Futures : 1. Customize the BMS color, a

The ICT Propulsion Block indicator is meant to detect and highlight propulsion blocks, which are specific price structures introduced by the Inner Circle Trader (ICT). Note: Multiple Timeframe version avaiable at here
Propulsion Blocks are essentially blocks located where prices interact with preceding order blocks. Traders often utilize them when analyzing price movements to identify potential turning points and market behavior or areas of interest in the market.
USAGE (fingure 1)

Description The Profit and Loss Indicator by Creative Tech Solutions is a robust and comprehensive tool designed to help traders monitor their trading performance in real-time. This indicator provides detailed metrics on profits and drawdowns, ensuring traders are always informed about their trading activities and performance. With customisable alerts and display settings, this indicator is an essential tool for any serious trader. Features Real-Time Metrics : Monitor profit and drawdown percent
FREE
This indicator will draw lines for previous day Highs and Lows, current day open price and current day price plus and minus ATR. This will provide an overview of the support and resistance for the price movement of the current trading day. The ATR is fixed to the 1 day period, so this indicator is suitable for the time frames lower than 1 day, i.e. 4HRTF, 1HRTF or 15MTF.
You can change the indicator looks but this is only applicable on Windows Platform. It will not work in Linux/Wine environme
FREE

Dieser Nachrichtenassistent wurde entwickelt, um die von Händlern benötigten wirtschaftlichen Ereignisse aus den wichtigsten Veröffentlichungsquellen abzurufen, die Nachrichten in Echtzeit basierend auf der Market Watch des Terminals mit verschiedenen und einfachen Filtern veröffentlichen.
Forex-Händler nutzen makroökonomische Indikatoren, um fundierte Entscheidungen über den Kauf und Verkauf von Währungen zu treffen. Wenn ein Händler beispielsweise glaubt, dass die US-Wirtschaft schneller wac
FREE

Dieses Produkt dient zur Anzeige der Handelssitzungen von 15 Ländern basierend auf der Zeitzone Ihres Broker-Servers und verschiedenen Anzeigemodi basierend auf Ihren gewünschten Einstellungen, um eine Überlastung der Diagramme zu verhindern und die Möglichkeit zu bieten, eine Sitzung mit der vom Benutzer gewünschten Zeit festzulegen.
Auf dem Forex-Markt geht die Sonne nie unter, aber ihr Rhythmus tanzt im Takt der verschiedenen Handelssitzungen. Das Verständnis dieser Sitzungen, ihrer Übersch
FREE

Der Bollinger-Bands-Dashboard-Indikator bietet eine praktische und informative Möglichkeit, Bollinger-Bands-Indikatorsignale in verschiedenen Zeitrahmen über ein Panel (Dashboard) zu verfolgen. Dieses Tool ermöglicht es Händlern, schnell und einfach die benötigten Informationen zu erhalten und so eine effiziente Entscheidungsfindung am Markt zu ermöglichen.
Hauptmerkmale:
1. **Signalbereich**: Das Dashboard zeigt Bollinger-Bänder-Signale für ausgewählte Zeitrahmen an und bietet Benutzern klar

SMT (Smart Money Technique) Divergence refers to the price divergence between correlated assets or their relationship to inversely correlated assets. By analyzing SMT Divergence, traders can gain insights into the market's institutional structure and identify whether smart money is accumulating or distributing assets. Every price fluctuation should be confirmed by market symmetry, and any price asymmetry indicates an SMT Divergence, suggesting a potential trend reversal. MT4 Version - https:/

Contact me for any queries or custom orders, if you want to use this in an EA. Key Features: Pattern Recognition : Identifies Fair Value Gaps (FVGs) Spots Break of Structure (BOS) points Detects Change of Character (CHoCH) patterns Versatile Application : Optimized for candlestick charts Compatible with any chart type and financial instrument Real-Time and Historical Analysis : Works seamlessly with both real-time and historical data Allows for backtesting strategies and live market analysis Vis
FREE

ObieTrader ist ein Indikator für kurzfristige Signale. Er wird für den Intraday-Handel verwendet. ObieTrader identifiziert den kurzfristigen Trend mithilfe des Williams-Prozent-R-Indikators und des durchschnittlichen wahren Bereichs. Wenn ein kurzfristiger Trend durch den Indikator bestätigt wird, zeichnet er Semaphoren auf den Balken, um den Trend anzuzeigen. Balken mit roten Punkten zeigen einen Abwärtstrend an und Balken mit blauen Punkten einen Aufwärtstrend.
Wenn ein Trend erkannt wird, ö

Our BOOM SELL ALERT indicator is specifically engineered to take candles on BOOM 1000 , BOOM 500 is tool is optimized for M1 (1-minute) timeframe, ensuring you receive timely and actionable insights. The indicator is a combination of many indicators. - AO Oscillator - Stochastic HOW TO USE THIS INDICATOR To use well this indicator , it need to use SCHAFF TREND RSX ( 5 MIN OR M5) IF SCHAFF trend RSX is GREEN and you have a signal then SELL when you have ENTRY and out with

When prices breakout resistance levels are combined with momentum oscillator breaks out its historical resistance levels then probability emerges to record farther higher prices. It's strongly encouraged to confirm price breakout with oscillator breakout since they have comparable effects to price breaking support and resistance levels; surely, short trades will have the same perception. Concept is based on find swing levels which based on number of bars by each side to confirm peak or trough
FREE

Insight Pro is a comprehensive tool for market analysis. It offers various features such as trend analysis, resistance and support levels, and distribution analysis, suitable for both novice and experienced traders. Features Trend Analysis Detects and visualizes market trends. Suggests potential entry and exit points based on trends. Customizable trend lines for clear market direction. Displays extreme levels based on standard deviation. Positive slope indicates buy orders; negative slope indic

Magnified Price Experience trading like never before with our Magnified Price indicator by BokaroTraderFx , designed exclusively for MetaTrader 5. This revolutionary tool provides traders with instant insights into price movements, offering a clear advantage in today's fast-paced markets.
Key Features: 1. Real-time Precision: Instantly magnify price action to uncover hidden trends and patterns. 2. Enhanced Visibility: Clear visualization of price movements with adjustable zoom levels. 3. User
FREE

The indicator is based on the relationship between two sets of Stochastic lines. The first set consists of 6 Stochastic with periods: 5, 8, 10, 12, 14, 16. The second set consists of 6 Stochastic with periods: 34, 39, 44, 50, 55, 60. These periods are customizable. Input parameters Stochastic MA Method Method of calculation ===== Short-term ===== Stochastic #1 %K Period Stochastic #2 %K Period Stochastic #3 %K Period Stochastic #4 %K Period Stochastic #5 %K Period Stochastic #6 %K Period Short
FREE

Market Heartbeat is in your hand! Introduction The Market Heartbeat indicator with a special enhanced algorithm (volume, money flow, cycle of market and a secret value) is a very repetitive trend finder with a high success rate . Interestingly, this Winner indicator indicates that the trend has changed its direction or the end of a trend retracement or even appears at the range market. The Market Heartbeat can use in scalping trading or trend trading. It finds immediately with alarm, n

When prices breakout resistance levels are combined with momentum oscillator breaks out its historical resistance levels then probability emerges to record farther higher prices. It's strongly encouraged to confirm price breakout with oscillator breakout since they have comparable effects to price breaking support and resistance levels; certainly short trades will have the same perception. Concept is based on find swing levels which based on number of bars by each side to confirm peak or trough
FREE

** All Symbols x All Time frames scan just by pressing scanner button ** *** Contact me to send you instruction and add you in "Order Block group" for sharing or seeing experiences with other users. Introduction: The central banks and financial institutions mainly drive the market, Order block is considered a market behavior that indicates accumulation of orders from banks and institutions, then the market tends to make a sharp move(Imbalance) on either side once the order block is

Unlock the power of Fibonacci with our advanced indicator!
This tool precisely plots Fibonacci levels based on the previous day's high and low, identifying the next day's key support and resistance levels. Perfect for day trading and swing trading, it has consistently generated weekly profits for me.
Elevate your trading strategy and seize profitable opportunities with ease.
NOTE: In the Input section make sure the draw labels are set to "True" so you can see each levels.

Contact me for instruction, any questions! Introduction V Bottoms and Tops are popular chart patterns among traders due to their potential for identifying trend reversals. These patterns are characterized by sharp and sudden price movements, creating a V-shaped or inverted V-shaped formation on the chart . By recognizing these patterns, traders can anticipate potential shifts in market direction and position themselves accordingly. V pattern is a powerful bullish/bearish reversal pattern

To get access to MT4 version please click here . This is the exact conversion from TradingView: " WaveTrend" by LazyBear.
This is a light-load processing and non-repaint indicator. All input options are available. Buffers are available for processing in EAs. You can message in private chat for further changes you need. The filling area option is omitted to fit into MT5 graphics.

the Spike detector show multiple indication for entries, for max profits enter on each indication given u can also add on lots size as entries go to secure max profits before spike occure, the more entries you enter along the way ,the more profits u have after the initial spike, after spike hold 3-5 candles before close for max profits . good on al timeframes max stop loss is 22candles.
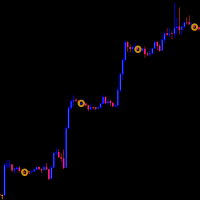
The Daily Closing Price Indicator marks the closing prices of previous days to easily spot them during chart analysis.
Features: -Available for MT5 only -Applicable in all instruments -Applicable in all timeframes
https://c.mql5.com/31/1144/daily-closing-price-indicator-screen-9611.png https://c.mql5.com/31/1144/daily-closing-price-indicator-screen-1492.png
https://c.mql5.com/31/1144/daily-closing-price-indicator-screen-5676.png
Parameters: https://www.mql5.com/data/temp/7867750/38bze8eu30
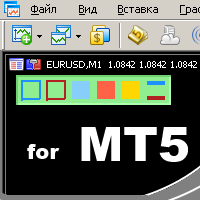
удобный инструмент для тех, кто использует технический анализ с использованием таких инструментов, как Трендовая линия и Прямоугольник. Имеется возможность настройки двух пустых прямоугольников, трех закрашенных и двух трендовых линий. Настройки индикатора крайне просты и делятся на пронумерованные блоки: С цифрами 1 и 2 вначале - настройки пустых прямоугольников (рамок); С цифрами 3, 4 и 5 - настройки закрашенных прямоугольников; С цифрами 6 и 7 - настройки трендовых линий. Объекты создаются оч
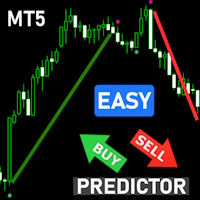
Overview: Elevate your trading strategy with the Advanced SuperTrend Buy Sell Signals Indicator! Designed for both novice and professional traders, this indicator provides clear and accurate buy/sell signals based on the popular SuperTrend algorithm, enhanced with customizable parameters and visual alerts. Features: Clear Trend Visualization: Identifies UpTrends (green line) and DownTrends (red line) with precision. Customizable Parameters: Adjust ATR period and multiplier to fit your trading s

The AT Forex Indicator MT5 is a sophisticated trading tool designed to provide traders with a comprehensive analysis of multiple currency pairs. This powerful indicator simplifies the complex nature of the forex market, making it accessible for both novice and experienced traders. AT Forex Indicator uses advanced algorithms to detect trends, patterns and is an essential tool for traders aiming to enhance their forex trading performance. With its robust features, ease of use, and reliable signal

Volumen und MarketProfile Pro Beschreibung: Der MarketProfile Indikator bietet Ihnen eine präzise und detaillierte Analyse des Handelsvolumens über verschiedene Preisniveaus hinweg, indem er das Volumenprofil für jeden einzelnen Tag berechnet und darstellt. Dieser Indikator ist ideal für Händler, die ein tiefes Verständnis der Marktstruktur und der Volumenverteilung benötigen, um fundierte Handelsentscheidungen zu treffen. Hauptmerkmale: Tägliche Volumenanalyse: Der Indikator berechnet und zeig
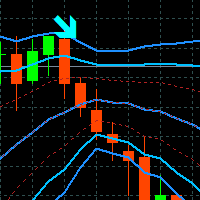
Tyr Bands Indicator
Tyr Band works with BB and 3 different deviations, plus the Stochastic confirmation. So when the price closes below/above the BB Reversal Band (Red) and the Stoch is in the confirmation zone, then the arrow (buy/sell) appears. This arrow indicates that we can entry to the market up/down on the next opening. Since it is only an indicator, it will not place SL or TP, we need to have them placed manually if you want to trade. The SL will lie on the external BB band (Blue), and
FREE

Probability emerges to record higher prices when MACD breaks out oscillator historical resistance level. It's strongly encouraged to confirm price breakout with oscillator breakout since they have comparable effects to price breaking support and resistance levels; surely, short trades will have the same perception. As advantage, many times oscillator breakout precedes price breakout as early alert to upcoming event as illustrated by 2nd & 3rd screenshot. Furthermore, divergence is confirmed in c
FREE

Probability emerges to record higher prices when MACD breaks out oscillator historical resistance level. It's strongly encouraged to confirm price breakout with oscillator breakout since they have comparable effects to price breaking support and resistance levels; surely, short trades will have the same perception. As advantage, many times oscillator breakout precedes price breakout as early alert to upcoming event as illustrated by 2nd & 3rd screenshot. Furthermore, divergence is confirmed
FREE

This is the Volume Avarage Weighted Price (VWAP) it's a indicator that shows where is the avarage of the current volumes and the levels at which the price is considered premium, above the second upper band, or discount, under the second lower band, it's also very usefull to use the VWAP level as a target for operations since it's a very liquid level so the price it's attracted to it. feel free to leave a feedback either positive or negative based on your expereince with this indicator, enjoy the
FREE
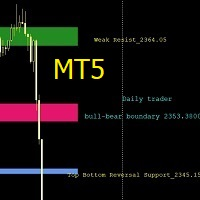
Support and Resistance Levels is an intelligent indicator that displays horizontal support and resistance levels, suitable for traders of different trading frequencies. You can select your preferred trading frequency, and the indicator will automatically calculate the support and resistance levels relevant to that frequency. Among these, the Bull-Bear Line is an interval used to distinguish the strength of bullish and bearish forces, and is an important level.
You can combine it with other ind

This is the Cumulative Volume Delta (CVD) , it's an indicator that calculates the long and short volumes plotting it then as a line on the chart, the most efficient way to use this indicator is by comparing the CVD line to the current chart and looking at the Divergence beetween the two of them, so that you can identify fake-outs and liquidty sweeps. for example in the picture that i put below you can see that the price has made a lower low but the CVD didn't, that means the volumes didn't suppo
FREE

Price Action Scanner is an indicator that identifies price behaviors and provides alerts. This indicator can simultaneously detect signals for up to 6 different symbols across various timeframes. By setting a separator, you can add different symbol names and timeframes.
The indicator can detect multiple common signal types such as Pinbar, Engulfing Pattern, Inside Bar, Morning Star, Evening Star, Fakey, and display corresponding information in separate subcharts, indicating the direction of th

Price Action Scanner Pro is an indicator that identifies price behaviors and provides alerts, offering more features and customization compared to Price Action Scanner. This indicator can simultaneously detect signals for up to 15 symbols across different timeframes. You can configure it to detect signals during specific trading sessions such as Asian, European, and US sessions, using different timeframes. This allows you to use lower timeframes for active trading periods and higher timeframes

The SuperTrend MTF indicator is an excellent trend tracking indicator . It can not only display SuperTrend trends within the timeframe of the chart, but also set up to display SuperTrend trends for larger time frames simultaneously . This will be beneficial for grasping trends at a larger time scale and predicting future trends . At the same time, the price of the trend line can also be displayed at a glance, making it easy to observe.
Input parameters :
ATR period used at chart timeframe
The DYJ SignalSource WPRBashboard signal source is based on the WPR indicator information dashboard It can be used for any currency pair and time frame.
WPR suggests that a metric value between 80% and 100% indicates oversold in the market The indicator value between 0 and 20% indicates that the market is overbought.
The entry signal of this indicator is a turning point in the trend.
It provides reverse trend selection direction.
This indicator uses simulated trading techniques.
It provide

Highs, Lows and Bos Indicator for MT5; The indicator works on any type of market and on all TimeFrames. It also works on the MetaTrader5 Tester. the main function of the indicator is to identify the highs and lows by marking them with a point above/below the candle, then with a horizontal line it marks the Bos. It is very simple and intuitive, there are only 2 inputs: -the color of the maximums -the color of the minima
For any other information do not hesitate to contact me.

The DD_Profit_Monitor MT5 indicator is a trading tool developed by the Dagangduit Core Team . This indicator is designed to monitor profits in real-time with the following key features: All Time Profit : Displays the total profit earned since the beginning of the trading account's usage. This feature helps traders see the overall performance of their trading activities. Daily Profit : Displays daily profits, allowing traders to monitor their daily performance more specifically. Key Features: Al
FREE

The DD_PL Running MT5 indicator is a trading tool developed by the Dagangduit Core Team . This indicator is designed to display real-time running profit and loss (P/L), providing essential information about your trading account's performance. Key Features: Real-Time P/L Monitoring : Calculates and displays profit and loss in real-time. Visual Indicator : Uses labels and colors to provide a visual representation of profit and loss status. Customizable Display : Allows adjustment of text color, b
FREE

The DD_ATR MT5 indicator is a trading tool developed by the Dagangduit Core Team . This indicator is designed to calculate and display the Average True Range (ATR) in real-time, providing traders with essential volatility information to aid in their trading decisions. Key Features: ATR Calculation : Calculates and displays the ATR for the selected timeframe. Multiple Timeframes : Displays ATR values for multiple timeframes (M1, M2, M3), giving traders a comprehensive view of market volatility.
FREE
The Reversal Candlestick Structure indicator detects multiple candlestick patterns occurring when trends are most likely to experience a reversal in real-time. The reversal detection method includes various settings allowing users to adjust the reversal detection algorithm more precisely.
A dashboard showing the percentage of patterns detected as reversals is also included. USAGE Figure 1 Candlestick patterns are ubiquitous to technical analysts, allowing them to detect trend continuation
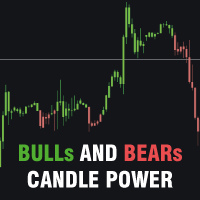
Bulls and Bears trend Power
The Bulls and Bears trend Power is a no repaint versatile technical analysis tool that helps traders identify market trends and see who's in control. It features dynamic trend capture logic that adapts to market conditions for a clear visual representation of trend direction. Traders can customize the colors to suit their preferences.
Features : Trend identification Compensation of market noise by strength of sellers or buyers
Recommendations : Use H1 timeframe a
FREE
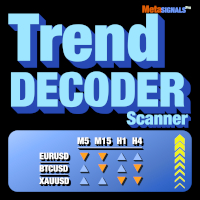
Erhalten Sie TrendDECODER -Signale für mehrere Vermögenswerte und Zeiteinheiten | Bestimmen Sie die beste Zeiteinheit zum Einstieg | Maximieren Sie Ihre Gewinne und gewinnbringenden Trades Nicht nachzeichnender, nicht verzögerter Indikator und Screener - ideal für manuellen und automatisierten Handel - für alle Anlagen und alle Zeiteinheiten 49 $ für die ersten 50 Exemplare - danach 99 $ Nach Ihrem Kauf hinterlassen Sie bitte einen Kommentar oder eine Bewertung , und wir senden Ihnen einen zu

Trading Session Indicator Der Trading Session Indicator visualisiert die Hoch- und Tiefpunkte sowie die Start- und Endzeiten der Asia, London und New Yorker Handelssitzungen direkt auf Ihrem Chart. Funktionen: Visualisierung der Haupt-Handelssitzungen Hervorhebung von Hoch- und Tiefpunkten Anzeige der Start- und Endzeiten jeder Sitzung Anpassbare Sitzungszeiten Benutzerfreundlich und effizient Anpassbarkeit: Jede Handelssitzung (Asien, London, New York) kann individuell an die spezifischen Hande
FREE

TMA Channel is a price channel obtained through a special calculation method based on traditional TMA . The channel has upper, middle, and lower tracks . When the price approaches or exceeds the upper track, it is already in an overbought state, and attention should be paid to the situation of reversal and decline; When the price approaches or falls below the lower track, it is already in an oversold state, and attention should be paid to the situation of reversal and rise . The indicator will
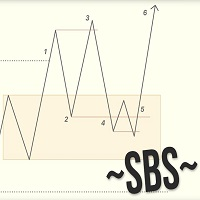
Swing Breakout Sequence | SBS presents a comprehensive trading strategy designed to help traders identify and capitalize on market swings and breakouts. The Swing Breakout Sequence (SBS) strategy is built around a series of well-defined steps to optimize trading decisions and improve profitability. Version 2.01: Add "golden entry" - entry by fib. Stoic added to it (fibo) he calls this setup gold SBS here is the video the description of the setup starts at 18min24sec Version 2: + Add BOS filter .

Our new indicator is an important part of the Smart Money Concepts (SMC) system
It uses a modern market vision and fast calculation methods. As a result, the trader has a complete picture of the trade at every moment in time, which makes the process of obtaining results easier and faster.
Our new indicator displays the following important patterns:
Order Blocks. Imbalance – Fair Value Gap (FVG). Break Of Structures (BoS). Change of character (CHoCH). Equal highs & lows. Premium , Equilibrium

We mark the fair value gap (FVG) and wait for the price to reach that zone, but sometimes it reverses before getting there. This can happen because we didn't notice the Balanced Price Range (BPR). My tools will enhance your analysis by displaying everything on the chart, helping you identify potential price reversal areas so you can make informed decisions about when to enter the market. MT4 - https://www.mql5.com/en/market/product/119216 So, what is BPR or Balanced Price Range? A Balanced Pri

This indicator combines TRIX (Triple Exponential Moving Average) with a Moving Average, which can be simple, exponential, smoothed or weighted.
This combination is very useful to identify the main trend and when it is changing to a new direction.
The indicator also has signals on the chart that indicates the TRIX crossing with the Moving Average, as well as pop-up alerts and push (in the MT5 app).
Enjoy it!
FREE
Ist Ihnen bekannt, warum der MetaTrader Market die beste Plattform für den Verkauf von Handelsstrategien und technischer Indikatoren ist? Der Entwickler braucht sich nicht mit Werbung, Programmschutz und Abrechnung mit Kunden zu beschäftigen. Alles ist bereits erledigt.
Sie verpassen Handelsmöglichkeiten:
- Freie Handelsapplikationen
- Über 8.000 Signale zum Kopieren
- Wirtschaftsnachrichten für die Lage an den Finanzmärkte
Registrierung
Einloggen
Wenn Sie kein Benutzerkonto haben, registrieren Sie sich
Erlauben Sie die Verwendung von Cookies, um sich auf der Website MQL5.com anzumelden.
Bitte aktivieren Sie die notwendige Einstellung in Ihrem Browser, da Sie sich sonst nicht einloggen können.