Neue technische Indikatoren für den MetaTrader 5 - 37
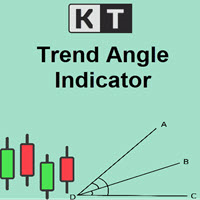
The KT Trend Angle helps to identify ranging and trending markets. The idea is to only enter a trade following the market trend if the slope is steep enough.
An angle is the ratio of the number of bars to the number of points: The bars mean the time offered by standard (M1, M5, etc.) and non-standard time frames. Points represent the unit of price measurement with an accuracy of 4 or 5 decimal places.
Input Parameters Period: An integer value to define the intensity of angled trendlines. A
A very good indicator for experienced and professional traders . A practical approach to trading. Easy to understand. A helping tool for traders looking for price movements .
Signals: Signal Number 1: When yellow line which is a signal line crossing the zero line towards downward direction is a selling opportunity. Signal Number 2:
When yellow line which is a signal line crossing the zero line towards upward direction is a buying opportunity.

KT Forex Blau Balance combines elements of momentum and volatility. It helps you identify entry and exit points.
Blau Balance consists of two moving averages (a slow-moving average and a fast-moving average) intersecting key transition points in market price. The indicator turns green or red when one is above or below the other, signaling to buy or sell trade signals.
It can be used in currency pairs and other markets that your MT4 or MT5 platform supports. Both short-term and long-term tra

The KT De Munyuk is a trend-based indicator that uses Parabolic SAR to identify the market direction. The indicator shows the PSAR in the form of green/red dots using a separate window. Buy Signal: When a green dot appears after a series of at least three red dots. Buy Exit: When a red dot appears on the current or next higher time frame. Sell Signal: When a red dot appears after a series of at least three green dots. Sell Exit: When a green dot appears on the current or next higher

In MetaTrader, plotting multiple horizontal lines and then tracking their respective price levels can be a hassle. This indicator automatically plots multiple horizontal lines at equal intervals for setting price alerts, plotting support and resistance levels, and other manual purposes. This indicator is suitable for Forex traders who are new and looking for chances to make quick profits from buying and selling. Horizontal lines can help traders find possible areas to start trading when the

KT XMaster Formula is a buy & sell signal indicator that works magically on most of the timeframes and currency pairs when used correctly.
The indicator uses calculations based on moving averages, RSI, and MACD. It is usually appropriate for scalping and trend trading - whether you are a novice or an experienced trader, the signals generated by this indicator are simple to understand and implement.
Overview The indicator comprises green and red dots arranged in wavy lines. These dots corre

KT Forex Trend Rider uses a trend following algorithm developed specifically for the Forex market to provide reliable buy & sell signals across the major currency pairs. It works best on major FX pairs and all time-frames.
Features
It comes with a Multi-Timeframe scanner that can search for upcoming signals across all the time-frames. It comes with four preset profiles to facilitate trading for scalpers, tick-trend, swing, and trend traders. It marks the potential reversal points in the mark
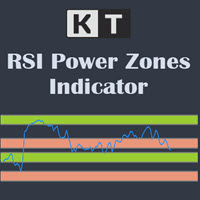
The KT RSI Power Zones divides and shows the movement of RSI into four different power zones to identify the potential support and resistance zones using the RSI.
Bull Support The bull support ranges from 40 to 50. The price is expected to reverse to the upside from this zone.
Bull Resistance The bull resistance ranges from 80 to 90. The price is expected to reverse to the downsize from this zone.
Bear Support The bear support ranges from 20 to 30. The price is expected to reverse to the

KT Price Border creates a three-band price envelope that identifies potential swing high and low areas in the market. These levels can also be used as dynamic market support and resistance. The mid-band can also be used to identify the trend direction. As a result, it also functions as a trend-following indicator. In addition, its ease of use and more straightforward conveyance of trade signals significantly benefit new traders.
Features
It works well on most of the Forex currency pairs. It

The BSI stands for Bar Strength Index. It evaluates price data using a unique calculation. It displays readings in a separate window. Many financial investors mistake this indicator for the Relative Strength Index (RSI), which is incorrect because the BSI can provide an advantage through its calculation method that the RSI indicator does not. The Bar Strength Index (BSI) is derived from the Internal Bar Strength (IBS), which has been successfully applied to many financial assets such as commodit

The KT Tether Line is a trend-following tool consisting of three indicators that work together to generate trading signals. It can correctly identify market trends while signaling trade entries. It was first introduced by Bryan Strain in the Stock & Commodities magazine in 2000 in "How to get with the trend and out at the end."
The Concept
When a market trend is confirmed, the most challenging part is determining the timing of the entries. This indicator alerts you to potential trend reversal

Um Inside Bar é um dos principais sinais de continuidade de uma tendência existente e as vezes reversão, pois nos mostra locais especiais de entrada, possibilitando uma boa taxa de Risco x Retorno. É simples visualizar um Inside Candle. Esse padrão é formado por apenas dois candles. O primeiro deve ser, preferencialmente grande, e o segundo deve estar integralmente contido dentro dos limites de máxima e mínima do primeiro.
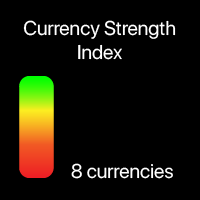
Current strength of the 8 major currencies My #1 Utility: includes 65+ functions, including this indicator | Contact me if you have any questions The indicator is displayed in a separate window, it can be moved to any place on the chart. In the input settings you can adjust: Interface theme : dark / white; Prefix and Suffix, if the currency pairs on your broker have it:
(e.g. if Symbol is "EURUSD .pro ", please set " .pro " as a Suffix); Panel size Font size
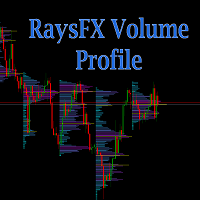
Calculation method The calculation method is summing the number of deals performed at a certain price. Alternatively, the volumes at a certain price can be summed if the real volume type is set in the parameters. The trade data is interpolated based on the most accurate terminal data available (М1 timeframe data). Each bar is divided into several trades based on the estimated price movement inside the bar. This is a distinguishing feature of the product setting it apart from other ones that hav

Supply / demand zones: observable areas where price has approached many times in the past. My #1 Utility: 65+ features , including this indicator | Contact me for any questions | MT4 version The indicator shows where the price could potentially be reversed again. Usually, the more times the price has been rejected from the level, the more significant it is. In the input settings you can adjust: Enable or disbale Weak zones; Show or hide zone description; Font size; Set the basi

Ichimoku Aiko MTF is a collection of technical indicators that show support and resistance levels, as well as momentum and trend direction. It is a multi-timeframe indicator so you don't need to change the chart timeframe when you want to see the ichimoku clouds on a higher timeframe. eg. The chart timeframe is M15 and you want to see on the M15 timeframe chart the H1 ichimoku indicators (the ichimoku in Metatrader can't do that) that's why you need to use Ichimoku Aiko MTF.

About the indicator: DALA Forecast is a universal tool for predicting the dynamics of time series of any nature. For prediction, modified methods of nonlinear dynamics analysis are used, on the basis of which a predictive model is built using machine learning methods. To get the trial version of the indicator, you can contact me in private messages.
How to use the indicator: Apply the indicator to your chosen financial instrument or indicator with the settings you need. The prediction will b
FREE

The Envelopes M indicator is based on the popular Envelopes technical indicator, which is used to create flexible channels where prices stay most of the time. The boundaries of these corridors are two moving averages. But the application that the price is in the channel most of the time is not completely correct, since the channel often breaks out and the price falls far beyond the channel. The main difference of this indicator is that with each new channel breakout, the channel line expands fo

Theoretical Foundation The Keltner Channels are channels ploted using volatility deviations above and bellow a moving average. The indicator is an excellent tool to help the trader build trend and mean-reversion strategies. Parameters The Orion Dynamic Keltner allows the user to select the Volatility Calculation Type, being ATR or Average Range (not considering price gaps). Also, the user can select the Calculation Period, Number of Deviations, Moving Average Mode and the Moving Average Ca

The indicator works with the objects "Trend Line", "Rectangle", "Text" and allows you to create and copy them from one chart to another.
It is a more convenient alternative to automatic copiers, because it allows you to choose more flexibly what and where should be copied.
Keyboard shortcuts:
'1,2,3,4,5,6' - creating thin horizontal lines (the color is set in the settings), the same with SHIFT - thick line ' ~' - creating a line with a random color ))) '7,8,9' - creating shaded rectangles

Here’s the problem: the default zigzag indicator given in MT5 trading platform does not really capture the most of the highs and lows on chart do draw zigzags. On chart below, notice that some of ther high, low of price have been missed to draw zigzags by this default zigzag indicator (picture 1). It is not so apparent until you compare default zigzag indicator to this SwingZZ indicator. Have a look on picture 2 and 3. The swing zigzag indicator is best because it captures most of the swing high
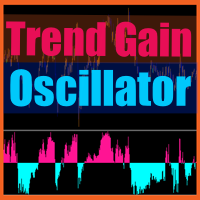
Trend Gain Oscillator - is the manual system for defining trend phase(bullish/bearish). When histogramm is pink - market is up/bullish and when histogramm is blue - market is down/bearish. Arrows is plotted on zero cross, in case if additionally market has power for future movement. Main inputs are : trendPeriod- main indicator's period for trend calculation; trendPowerPeriod - period for market's power(volatility+volume) calculation ; trendPowerTrigger - arrows is not plotted if market's power
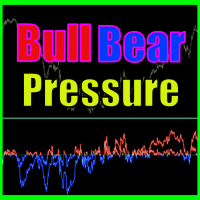
Bull bear pressure indicator - is the manual system which defines bull/bear market. When lines is above zero level - market is strong bullish, and when lines below zero level - market is bearish. First line represents global trend and second one are smoothed and shows local market's mood. Main inputs are : MainPeriod- main indicator's period for global trend calculation; SignalPeriod - period for smoothed and shows local market's trend; Main Indicator's Features Signals are not repaint,non-late

ROC acceleration-deceleration is the manual system for medium-term scalping. Indicator based on custom ROC system which defines bullish/bearish market and especially acceleration-deceleration of tendention in the market's main direction. Buy arrow is plotted during bearish market when current trend decelerates and sell arrow is plotted during bullish market when current trend decelerates. Main Indicator's Features Signals are not repaint,non-late or disappear(exept cases when system recalculat

ASI fractals with DPO filter - is the manual trend-following system. ASI fractals are the base of every trend. System plots an arrow when fractal pattern appears on ASI indcator and DPO direction is same as incomming signal. System has several ways of usage : simply indicator, indicator with suggested arrows, arrows with single targets and arrows with common profit targets. User can simply switch indicator's modes directly from chart. Main Indicator's Features Signals are not repaint,non-late or
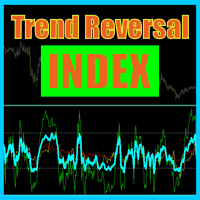
Trend reversal index - is the manual trading system that works with overbought , oversold levels and reversal patterns. Sell arrow is plotted when indicator is higher than overbought level and here forms reversal pattern, all pattern points located higher than overbought level. Opposite with buy arrow : ndicator is lower than oversold level and here forms reversal pattern, all pattern points located lower than overbought level. Main Indicator's Features Signals are not repaint, late or disapp

Theoretical Foundation Similar to the well-known Average True Range (ATR), the Average Range indicator is a volatility measure that is calculated using only the range of the bars (high – low), not considering the Gaps, as with the ATR. The Average Range can be very useful for day traders as it allows one to get the measure of the volatility of the last N bars. Parameters You can select the calculation period of the indicator.

Dema divergence points - is the manual trading system based on double exponental moving divergence. Histogram represents 4 colors : yellow - strong up trend, orange - up movement, blue - down movement and aqua - strong down trend. Up arrow is poltted when dema crosses current price up - but phase is still strong down (aqua color), down arrow is poltted when dema crosses current price down - but phase is still strong up (yellow color). Main inputs : mainPeriod - main dema calculation period; f

Demarker pullback system - is the manual trading system for choppy markets. It show 2 colored histogram. When histogram is blue - market is quite bullish, when histogram ir orange - market is more bearish. Up arrow is plotted when histogram is in oversold zone but blue color. Down arrow is plotted when histogram is in overbought zone but orange color. These patterns shows false breakout and possible soon reverse(price is overbought but shows bearish signs and price is oversold but shows bullis

Early WPR divergence - is the manual system to define trend reverse. Green histogram shows main trend, Orange one - shows "short"/local trend. System is looking for clear divergence between both trends and pick up position(plot buy/sell arrows). When main trend is up, but local trend reverses to bearish trend and get's big power - sell arrow is plotted; When main trend is down, but local trend reverses to bullish trend and get's big power - buy arrow is plotted; Main inputs are : mediumTrendPe

Normal Parabolic SAR with label of long or short state. Tells also "Parabolic long" and "short". Can be used in multitimeframe layouts together with Swiss HolyGrail indicator or in different timeframes. So, if all the indicators show "long" or "short" you can be sure that the risk of a wrong direction is small. The standard values for Parabolic SAR are 0.02 for step and 0.2 for maximum. You may experiment with changing the maximum to get smother curves. Note that changes in parabolic SAR are la
FREE
Индикатор отображает изменение баланса В правом нижнем углу окна.
Отображаются следующие периоды Сегодня Вчера 3 дня Неделя 10 дней Месяц 3 месяца Полгода Год Все время Есть возможность выставить расчетное время. Удобно пользоваться для расчетов прибыли/убытков с определенного часа.
Будет полезен например ночным скальперам. Данные совпадают с расчетами отчета в терминалее.
FREE
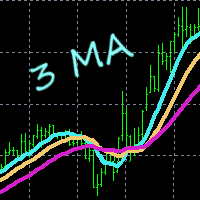
This indicator gives you a modified version of three Moving Averages. Great for scalping. Does not feature any alerts, and is best used manually after confirming multi line displays. Settings: Period1 Period2 Period3 Period4 How to use: Simply attach to any chart with default settings. Buy when the 4 lines converge below the price. Sell when the 4 lines converge above the price. Take note of the slope of Period4. See example pictures below. Best results when looking at three or more time frames

Der Volatilitätsanalysator ist ein Momentum-Indikator, der von der Tendenz profitiert, dass der Preis nach der Konsolidierung in einer engen Handelsspanne stark ausbricht. Der Indikator verwendet auch einen Momentum-Oszillator, um die erwartete Richtung der Bewegung anzuzeigen, wenn der Squeeze ausgelöst wird. Dieses Histogramm oszilliert um die Nulllinie, ein steigendes Momentum über der Nulllinie zeigt eine Gelegenheit zum Long-Kauf an, während ein Momentum, das unter die Nulllinie fällt, ein
MT5-INDIKATOR.
Dieser Indikator erkennt Nachfrage- und Angebotszonen auf jedem Chart, jedem Zeitrahmen und jedem Broker. Es ist perfekt für die technische Analyse.
Standardmäßig weisen die roten Linien auf starke Verkaufszonen hin, während grüne Linien auf starke Kaufzonen hindeuten. Sobald eine Linie gezogen ist (grün oder rot), gibt es eine 99%ige Chance, dass die Preise in diese Zone zurückkehren, um die Linie zu schließen.
EINGÄNGE:
(bool) Four_candle = false : Eine Option, um d

DESCRIÇÃO O indicador EasyFollowerTrader-Bot2-DayTrade opera apenas a favor da tendência. Assim, o indicador, em primeiro momento, observar a tendência de três médias síncrona com o time-frame selecionado. Em seguida, o indicador observar a tendência do gráfico diário. Quando estes dois gráficos estiverem se movimentando na mesma direção, teremos a maior probabilidade de ganhos. Chamaremos esta região como região de alta probabilidade de ganho. Na região de alta probabilidade de ganho, o ind

The Roll the Field indicator displays signals in a simple and accessible way in two colors (when to buy and when to sell is determined by changing the color). Knowing the entry point of each currency is very important for every forex trader. The intelligent algorithm of the indicator accurately determines the trend, filters out market noise and generates entry signals.

Point discussion is a fundamental technical indicator - an algorithm that allows you to obtain data on future prices using quotes data for a certain period of time specified in the indicator settings. The technical analysis indicator Point discussion is based on a special formula. It is with its help that the calculation takes place. The indicator is well suited for determining a reversal or a large sharp jerk to one side, thanks to it you will know when this happens, it will notify you by the a

the fundamental technical indicator Informative Trend, which allows you to assess the current market situation in order to enter the market of the selected currency pair in a trend and with minimal risk. It basically uses the process of identifying the rate of change in price growth and allows you to find entry and exit points from the market.
The indicator was created on the basis of the original indicators for searching for extreme points and is well suited for determining a reversal or a l

One of the main definitions for monitoring the currency market is a trend, which is why the Megan indicator was created in order to display the trend in a visual form. Forex indicator Megan is a real trading strategy with which you can achieve the desired results. As soon as the indicator is set, the main indicators will immediately begin to be recalculated at the price of the traded pair, based on the postulates of technical analysis. In addition, when potential entry points are detected, visua
The Choppiness Index was created by Australian commodity trader E.W. Dreiss. It is designed to determine if the market is choppy (trading sideways) or not choppy (trading within a trend in either direction). A basic understanding of the indicator would be; higher values equal more choppiness, while lower values indicate directional trending. The values operate between 0 and 100. The closer the value is to 100, the higher the choppiness (sideways movement) levels. The closer the value is to 0,

Everything is simple. The usual Information indicator.
Shows on the chart: Current spread, buy swap, sell swap, time to close the candle, broker time.
The indicator can be placed at the top right or at the bottom right of the chart.
Most often, the spread is called the difference between the sale and purchase price.
Swap is the cost of transferring a position to the next day.

This indicator paints any Inside Bar found on the attached chart in a Dark Gray Colour with Black Borders and Wicks. If there are multiple consecutive Inside Bars, then they would also be successively painted Dark Grey with Black Borders and Wicks as well. You may opt to change the colours set by default in order to better contrast with your chosen background and chart colours. I made this Indicator out of necessity as my trading required it. But I know there may be others out there who may need

The movement exhaustion is a color rule that helps indicate when the movement will revert its direction. The darker the color, the greater the probability to revert. The indicator is based on the price statistic. Works on every timeframe, every instrument. Five color options: 0. Natural movement. (Gray) 1 - 4. Movement exhaustion (Yellow to maroon) The trader can use it as reversal or exhaustion signal. In a trend following trade it can be used as an exhaustion signal, indicating the movement ca

In this indicator, Heiken Ashi candles are calculated with the most optimal method. You can also customize the results by adjusting the amount of period and method input. But the most important advantage of this indicator is the adjustment of the time frame value. You can use this to calculate the Heiken Ashi chandels to See in time frames with lottery in the lower time chart. In this case, you get the best signal to buy or sell using two or more Heiken Ashi indicators with different timeframes
FREE

Meet the new generation ichimoku cloud. You can develop hundreds of strategies on it. Or you can open a trade directly by looking at whether it is above or below the cloud.
Now it is much easier to know the trend...
Once you get used to this cloud, you won't be able to look at the graphics without it.
The calculation logic is completely different and you will experience the privilege of looking at the market from a different perspective.
By looking at the chart, set the appropriate para

Live-Übertragung des Indikators auf YouTube. Bitte klicken Sie auf den Link unten, um mehr Glaubwürdigkeit zu erhalten. Es gibt auch Videos des Indikators, die Sie sich ansehen können. Beachten Sie, dass die Übertragung spät ist, verlassen Sie sich nicht darauf. Nur eine Überprüfung des Indikators ist nur eine Überprüfung der Genauigkeit des Indikators, der fast nicht verliert und die Gewinnrate 95% erreicht Ich werde mit großer Genauigkeit an der CRASH-Münze 1000 INDICES arbeiten

Automatisierte Angebots- und Nachfragezonen der nächsten Generation. Neuer und innovativer Algorithmus, der bei jedem Diagramm funktioniert. Alle Zonen werden dynamisch entsprechend der Preisbewegung des Marktes erstellt.
ZWEI ARTEN VON WARNUNGEN --> 1) WENN DER PREIS EINE ZONE ERREICHT 2) WENN EINE NEUE ZONE BILDET WIRD
Sie erhalten keinen weiteren nutzlosen Indikator. Sie erhalten eine vollständige Handelsstrategie mit nachgewiesenen Ergebnissen.
Neue Eigenschaften:

Dieser Indikator basiert auf der Strategie, die vom YouTube-Kanal „The Secret Mindset“ im Video „A Reliable Scalping Strategy I Discovered After 1 Month of Price Action Trading“ vorgeschlagen wurde. Eine vollständige und detaillierte Erläuterung der Strategie und Bedingungen zum Filtern der Signale finden Sie im Video. * Der Ersteller des YouTube-Kanals hat nichts mit der Entwicklung dieses Indikators zu tun Die Signale sollten mit anderen Indikatoren kombiniert und nach dem Urteil jedes Händle
FREE

Der Market Steps-Indikator wurde auf der Grundlage von Gann-Zeit/Kurs-Korrelationen entwickelt und durch Price Action-spezifische Regeln für den Devisenmarkt optimiert. Er nutzt die Konzepte des Market Order Flow, um potenzielle Preiszonen für ein hohes Auftragsvolumen vorherzusagen.
Indicator Levels kann für den Handel selbst oder als Kombination zum Filtern von falschen Signalen anderer Strategien/Indikatoren verwendet werden. Jeder Trader braucht ein solch leistungsstarkes Tool, um Multi-
DESCRIPTION
The EasyFollowerTrader-Bot3-DayTrade indicator only trades with the trend. Thus, the indicator will, at first, observe the trend of three averages synchronous with the selected time-frame. Then the indicator observes the trend of the daily chart. When these two charts are moving in the same direction, we have the highest probability of winnings. We will call this region the region of high probability of gain.
In the region of high probability of gain, the indicator will indicate

DESCRIPTION
The EasyFollowerTrader Bot4 DayTrade indicator always trades with the trend. Thus, the indicator, at first, observes the trend of the average of the highs and lows of the candles of the selected time-frame. Then see if this trend is in line with the trend of the daily chart to operate in favor of the major trend. When these two charts are moving in the same direction, we have the highest probability of winnings. We will call this region the region of high probability of gain.
In

Simple ATR Modern Ein schlankes Werkzeug zur Verfolgung der Marktvolatilität mit größerer Klarheit, ideal sowohl für Daytrading als auch für Swingtrading. Es ist der beste Indikator für den Handelsstart oder für Anfänger.
Visuelle Indikatorfarbe: ATR Daily - Blau Verbessern Sie Ihre Analyse, indem Sie den Indikator mit Volatility Vision kombinieren. Misst präzise Schwankungen der Marktbedingungen und ist unerlässlich für Entscheidungen im Daytrading und Swingtrading. Verwendet einen einfachen

Colors generated according to the Height and Depth parameter.
The analysis is carried out following the direction of the price and volume traded if the traded value exceeds the calculation base the system changes the color to green, informing you that the price direction is strong to buy, if the traded value is less than the calculation base the system changes to red, indicating that the price is strong for sale.
FREE

TransitGhost Signal indicator, this is one of my best forex trading strategy. The strategy is based on the simple moving average cross, 5 SMA AND 200 SMA of which take a longer time to cross. Whenever the is a cross between the 5 SMA and 200 SMA a signal will be given, when the 5 SMA cross the 200 SMA to the upside ,a buying arrow will appear on chart, and push notification(alert) "Buy now, use proper risk management" will be sent on both the MT5 PC and mobile app, and when the 5 SMA cross the 2
FREE
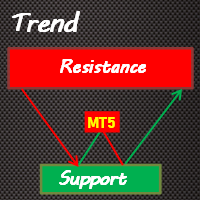
Trend Support Resistance is a fairly simple indicator that provides traders with confirmed immediate support and resistance in whatever timeframe you monitor. It's good for short-term and long-term order blocks. With the default settings, the indicator identifies critical support and resistance areas. Bearish Order Blocks are around the OrangeRed areas while Bullish Order Blocks almost always form near the LawnGreen areas. We have also added a Multi-timeframe feature that can be helpful to allow

66% discount only for the first 5 buyers (4 left), main price: 300 $ Show the signal as a line graph Prediction of 10 future candles and advanced display Prediction of individual candles graphically Can be used in the gold symbol Can be used in 15 minutes time frame Can be used only in gold symbol and only 15 minutes time frame
How the indicator works:
Using complex mathematical calculations, it predicts the future 10 candles. The predictions of this indicator are based on price. Theref

This indicator uses a different approach from the previous version to get it's trendlines. This method is derived from Orchard Forex, and the process of making the indicator is demonstrated in there video https://www.youtube.com/watch?v=mEaiurw56wY&t=1425s .
The basic idea behind this indicator is it draws a tangent line on the highest levels and lowest levels of the bars used for calculation, while ensuring that the lines don't intersect with the bars in review (alittle confusing? I kno
FREE
Indicator for boom and crush which can be used to catcher spikes or ride a whole wave of spikes. If a signal is found it can send Alerts , note that this feature can be disabled. to get most out of this strategy you must not enter with just the signal alone but u can pair this with the "ichimuko" indicator put in a second window so as to define good turning points more of this can be seen in the screenshot provided. For Boom the Ichimuko must be below or has touched the 20 level For Crash the Ic

The Average Daily Range (ADR) is an indicator that shows how far a currency pair can move in a day. Automatically displays the upper and lower ADR levels. Automatically calculates the percentage and distance of ADR achieved by the currency pair for the day. Notifies when the price reaches the ADR level. Changes the color and thickness of the ADR line when the price reaches it.

A version based on David Waves' description in his book 'Trade About to Happen' of his adaptation of the Wyckoff wave chart. The indicator directionally accumulates volume, adding to each brick or candle close, with color indication for up and down. it can be used it with tick or real volume, it also changes color when the accumulated value of the previous wave is exceeded, being the trade signal. Yellow color is used for doji candlestick, it will continue with accumulation without zero the sum
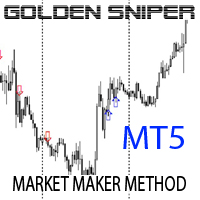
Indicator is based on Market Maker Strategy. NO REPAINT.
MM's are traders and their objective is to make money. This includes strategies to trade against retails traders. The major difference between them and other traders is that they have the ability, through access to massive volumes, to move price at their will. So to make money, they aim to buy at a lower price and then sell at a higher price. They achieve this by: 1. Inducing traders to take positions. This is achieved by using a

Double Correlation indicator (free) plots two windowed correlations in a separate window. the size of window is taken as input before the two symbols to correlate to. Two symbols are taken as an input parameters as well as period length. and the two correlations are computed with the currently shown symbol ex: input GBPJPY and AUDNZD. current symbol EURUSD then the following will be computed corr(EURUSD,GBPJPY) and corr(EURUSD,AUDNZD) The indicator can be useful to run a multi-symbol pair trad
FREE

MA Slope is a simple indicator that measures the slope of a specific Moving Average. We usually say that the price is in an uptrend when it is above the moving average, or it is in a downtrend when it is below the moving average. However, this information is inadequate since most of the time the market is in range. During range-bound markets, price moves back and forth around the Moving Average giving a lot of false signals. MA Slope helps identify and validate trends as it directly measures t

This is a regression tree indicator for MT4/MT5.
This indicator classificate nodes on the time period so that the deviation becomes smaller,
and displays regression line and channel for each node.
It's free!
Attached CartDemo.ex4 and CartDemo.ex5 is a Demo version and has the following limitations:
Method is RandomForest only
Maximum number of bars is 200
Maximum number of trees is 2
Maximum tree depth is 2
Calculated waste lines are shown
Not display correlation coefficients
Fu
FREE

This indicator belongs to the family of channel indicators. These channel indicator was created based on the principle that the market will always trade in a swinging like pattern. The swinging like pattern is caused by the existence of both the bulls and bears in a market. This causes a market to trade in a dynamic channel. it is designed to help the buyer to identify the levels at which the bulls are buying and the bear are selling. The bulls are buying when the Market is cheap and the bears a
This indicator is based on John Carter's "TTM Squeeze" volatility indicator, as discussed in his book "Mastering the Trade". In this version, this indicator has some improved features: Multiple timeframes (MTF) is supported. You can analyze multiple timeframes in the same window. Histogram is plotted in a different way to help reduce noise. 3 customizable thresholds to help adjust when the dots change color. The dot color indicates the market volatility: d ark blue: very low volatility blue: low

Dieser Informationsindikator ist nützlich für diejenigen, die immer über die aktuelle Situation auf dem Konto informiert sein möchten.
- Weitere nützliche Indikatoren Der Indikator zeigt Daten wie Gewinn in Punkten, Prozentsatz und Währung sowie den Spread für das aktuelle Paar und die Zeit bis zum Schließen des Balkens im aktuellen Zeitrahmen an. Für die Platzierung der Informationslinie im Diagramm gibt es mehrere Möglichkeiten: Rechts vom Preis (läuft hinter dem Preis); Als Kommentar (in
FREE

Contact me after payment to send you the User-Manual PDF File. Volume Profile Indicator A functional and useful tool that can improve your trading plan.
This indicator calculates volume in price levels(typical volume indicator shows only candle volumes).
With the volume of price levels, you can identify important areas that have the potential to reverse. You can also see the volume of support and resistance levels and decide on them.
Using volume profiles along with Price Action and

Divergence and Convergence are important harbingers of reversals in stock markets.
The Divergence Sync indicator is designed to automatically search for divergences on a large number of indicators with different parameters.
The search for divergences is carried out on these indicators: (CCI, CHO, DeMarker, MACD, MFI, Momentum, OBV, OsMA, RSI, Stochastic, WPR, Awesome Oscillator ).
To search for divergences, you can use one technical indicator or search simultaneously on any number of ind
MetaTrader Market bietet jedem Entwickler eine einfache und bequeme Plattform für den Verkauf von Programmen.
Wir unterstützen Sie bei der Veröffentlichung des Produkts und beraten Sie gerne, wie man eine Beschreibung für den Market vorbereitet. Alle Produkte, die im Market verkauft werden, sind durch eine zusätzliche Verschlüsselung geschützt und können nur auf dem Rechner des Kunden gestartet werden. Illegales Kopieren ist ausgeschlossen.
Sie verpassen Handelsmöglichkeiten:
- Freie Handelsapplikationen
- Über 8.000 Signale zum Kopieren
- Wirtschaftsnachrichten für die Lage an den Finanzmärkte
Registrierung
Einloggen
Wenn Sie kein Benutzerkonto haben, registrieren Sie sich
Erlauben Sie die Verwendung von Cookies, um sich auf der Website MQL5.com anzumelden.
Bitte aktivieren Sie die notwendige Einstellung in Ihrem Browser, da Sie sich sonst nicht einloggen können.