Neue technische Indikatoren für den MetaTrader 5 - 2

O indicador media colors se baseia num canal que pode ser criado a partir de duas médias Media colors é um indicador de tendência utilizado no trading para identificar a direção predominante do mercado. Pode ser baseado na Média Móvel Simples (SMA) e na Média Móvel Exponencial (EMA) que dá mais peso aos preços mais recentes, tornando-a mais sensível às mudanças de preço. Como Funciona: Cálculo: A EMA é calculada aplicando um fator de suavização aos preços de fechamento de um ativo financeir
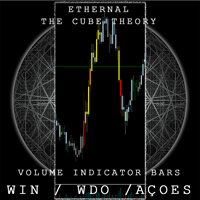
The Cube Bars Brasil pinta os candles de acordo com o volume , excelente para saber os picos de compra e venda . Pode ser regulado livremente pelo usario . Possui regulagem de parametro de entrada para que o usuario tenha a liberdade de regular o colume de acordo com o ativo que escolher . Possui 4 cores que diferenciam os candles de acordo com o tamanho do volume naquele instante
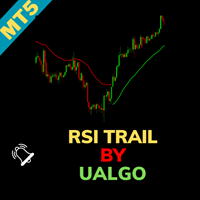
RSI Trail [UAlgo] Indicator for MetaTrader 5 The RSI Trail [UAlgo] indicator is a sophisticated technical analysis tool designed to enhance trading strategies by leveraging the Relative Strength Index (RSI) in conjunction with various moving average calculations. This indicator dynamically plots support and resistance levels based on RSI values, offering clear visual signals for potential bullish and bearish market conditions. Key Features:
Dynamic Support and Resistance Levels: The indicator
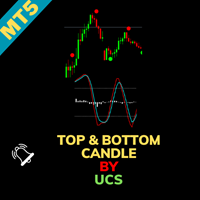
UCS_Top & Bottom Candle Indicator for MetaTrader 5 The UCS_Top & Bottom Candle is an innovative experimental indicator designed for MetaTrader 5. Based on momentum, this indicator identifies the top and bottom candles for most swing movements, assisting traders in making precise market entries and exits. Key Features: Momentum-Based Analysis: Utilizes momentum to detect the top and bottom candles for swing trading opportunities. Customizable Settings: Percent K: Set the Percent K value (default
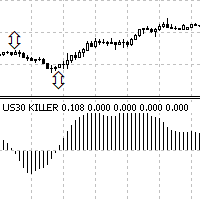
Us30 killer non repaint non repaint (means that the arrows that appear on the chart will not disappear or redraw). Us30 killer consists of 2 black arrows and a histogram. if black arrow appears above the current price look for selling opportunities ( See figure 3) if black arrow appears below current price look for buying opportunities. (See figure 3) The indicator works on all timeframes recommended is M5 TO Monthly Timeframe.
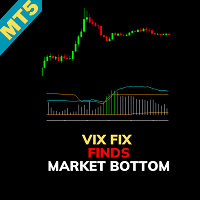
Indicator Name: CM_Williams_Vix_Fix Finds Market Bottoms Overview: The CM_Williams_Vix_Fix Finds Market Bottoms indicator is an advanced tool designed to identify market reversal points across various asset classes. Inspired by the original work of Larry Williams, this indicator provides similar insights to the VIX for stock indices but with the added flexibility of functioning effectively across all asset types. Key Features: Versatility Across Asset Classes: Unlike traditional indicators that
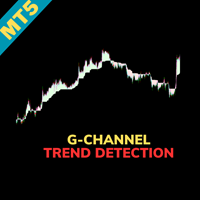
Indicator Name: G-Channel Trend Detection Overview: The G-Channel Trend Detection indicator offers a unique approach to trend analysis, leveraging AlexGrover's G-Channel methodology. This indicator provides a clear and simplified view of market trends by identifying bullish and bearish conditions based on price interactions with the G-Channel boundaries. Key Features: Trend-Based Market Analysis: The indicator determines trend direction by monitoring price action relative to the G-Channel bounda

Session Average Date Range: Analyze and average the low - high of specific trading sessions within custom date ranges, offering insights into price movements and market behavior over selected periods. The "Session Average Date Range" tool is an advanced analytical utility designed to empower traders and analysts by allowing them to dissect and evaluate the high and low range of specific trading sessions within a user-defined date range. This tool provides a flexible and precise approach to analy
FREE
HiperCube ADX Histogram is here!
This indicators helps you to know if could be a strong trend in the market .
ADX is a very popular and usefull indicator, so many top traders reccomends use it as filter to bad trades, or in combinations of other analysis.
With HiperCube ADX you will be a premium exoerience using a beautifula and great indicator for your trading.
FEATURES: Fully Customizable Custom Your Chart! Custom Color to Histogram In Sub Windows for have a clear main chart
HiperCube VIX is here! HiperCube VIX known as the CBOE Volatility Index, is a widely recognized measure of market fear or stress . It signals the level of uncertainty and volatility in the stock market, using the S&P 500 index as a proxy for the broad market. The VIX Index is calculated based on the prices of options contracts on the S&P 500 index.
Features: Custom Colors Custom Chart Colors Indicator display in subwindows to keep main graph clear Easy to interpretate Fully Customize

The "HiperCube USD INDEX" is a financial benchmark representing the performance of a specific group of assets, like stocks, bonds, or commodities, with values denominated in U.S. dollars. These indices help investors track and compare the performance of particular sectors or markets over time. By being expressed in USD, the index provides a consistent measure for evaluating investments, regardless of the assets' native currency or geographical location.
Performance
Indicator to separate w

Introducing the Volume Order Blocks indicator, a game-changing tool designed for traders who demand precision and clarity in their market analysis. This advanced indicator not only identifies order blocks but also integrates crucial volumetric data, allowing you to gauge the strength of these blocks with unparalleled accuracy. MT4 version - https://www.mql5.com/en/market/product/121237/ Key Features of the Volume Order Blocks: Bullish & Bearish Order Blocks: Easily visualize and differentiat

Order block hunter indicator is the best indicator for hunt the order blocks that area where there has been a large concentration of limit orders waiting to be executed Order blocks are identified on a chart by observing previous price action and looking for areas where the price experienced significant movement or sudden changes in direction .This indicator does that for you by using very complicated codes and helps you to take the best areas To buy and sell because it make marks at the best a

Heiken Ashi MT5 Indikator Verbessern Sie Ihre Marktanalyse mit dem Heiken Ashi MT5 Indikator. Dieses leistungsstarke Tool verwandelt Standard-Preisdaten in glattere, trendorientierte Kerzen, wodurch die Identifizierung von Markttrends und potenziellen Umkehrpunkten erleichtert wird. Hauptmerkmale: Klare Trendidentifikation: Unterscheiden Sie visuell zwischen Aufwärts- und Abwärtstrends durch unterschiedliche Kerzenfarben. Rauschreduktion: Filtern Sie Preisschwankungen heraus und erhalten Sie ei
FREE

The Market Structure Analyzer is a powerful tool designed for traders who follow market structure and smart money concepts. This comprehensive indicator provides a suite of features to assist in identifying key market levels, potential entry points, and areas of liquidity. Here's what it offers:
1. Swing High/Low Detection : Accurately identifies and marks swing highs and lows, providing a clear view of market structure.
2. Dynamic Supply and Demand Zones: Draws precise supply and demand zo
Perfekt gestaltet für Trader, die Klarheit, Präzision und Benutzerfreundlichkeit schätzen, bietet dieser hochmoderne Renko-Chart-Indikator alles, was Sie benötigen, um Ihre Handelsstrategie zu verbessern. Im Gegensatz zu herkömmlichen Generatoren, die Offline-Charts erstellen, liefert dieser Indikator Renko-Charts in Echtzeit direkt auf Ihrer Live-Handelsplattform. Der Live Renko-Indikator funktioniert auch nahtlos auf Synthetic Indices wie Volatility 75, Step Index, Boom und Crash.
FREE

Aufgrund technischer und logischer Manipulationen durch Brokerage habe ich einen langen Weg zurückgelegt, um diesen Indikator zu entwickeln, der zahlreiche Strategien mit den folgenden Fähigkeiten kombiniert:
Identifizierung von Markttrends: Verstehen Sie den allgemeinen Trend des Marktes.
Umkehrpunkte: Identifizieren Sie potenzielle Punkte, an denen der Markt die Richtung ändern könnte.
Einstiegs- und Ausstiegspunkte: Bestimmen Sie optimale Zeitpunkte für den Einstieg und Ausstieg aus Tr

Überblick SwingVolumePro ist ein fortschrittlicher und vielseitiger Indikator, der für eine breite Palette von Finanzinstrumenten entwickelt wurde und verschiedene Handelsstile unterstützt. Basierend auf strengen Analysen von Volumen und Preis bietet er klare und präzise Signale, die es Händlern aller Erfahrungsstufen ermöglichen, informierte Entscheidungen auf Grundlage hochwertiger Daten zu treffen. Hauptmerkmale Vielseitigkeit: SwingVolumePro kann auf verschiedenen Assets angewendet
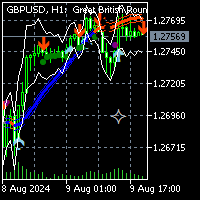
To get access to MT4 version please click here . This is the exact conversion from TradingView: " SSL Hybrid" by Mihkel00.
This is a light-load processing and non-repaint indicator. All input options are available. Buffers are available for processing in EAs. You can message in private chat for further information/changes you need. Thanks for downloading
Währungsstärke-Index (Currency Strength Index - CSI) Indikator BEVOR SIE DEN INDIKATOR AKTIVIEREN, DENKEN SIE DARAN, "TRUE" EINZUSTELLEN, UM DIE PAARE ANZUZEIGEN Der Währungsstärke-Index (Currency Strength Index - CSI) Indikator ist ein leistungsstarkes Werkzeug, das im Forex-Handel verwendet wird, um die relative Stärke der wichtigsten Währungen zu messen. Dieser Indikator hilft Tradern, die stärksten und schwächsten Währungen zu identifizieren, was es ihnen ermöglicht, fundiertere Handelsents

„Der Ultimate Bot Alerts-Indikator ist ein leistungsstarkes Tool für MetaTrader 5, das Händlern dabei hilft, potenzielle Ein- und Ausstiegspunkte im Markt zu identifizieren. Dieser Indikator verwendet einen ausgeklügelten Algorithmus, der auf Average True Range (ATR) und Preisbewegungen basiert, um Kauf- und Verkaufssignale zu generieren.
Wenn Sie den Ultimate Bot Alerts-Indikator auf Ihr Diagramm anwenden, sehen Sie grüne Pfeile für Kaufsignale und rote Pfeile für Verkaufssignale. Diese Sign
Verbessere Deine Handelsstrategien mit dem "Order Block" Indikator für MT4 Entdecke den "Order Block" Indikator: Der "Order Block" Indikator für MT4 ist darauf ausgelegt, Orderblöcke im Markt präzise zu identifizieren, indem er die Hochs und Tiefs der Orderblock-Kerzen markiert. Dieses leistungsstarke Tool ermöglicht es dir, zu verstehen, wo große Institutionen ihre Aufträge platzieren und so deine Fähigkeit zur Vorhersage von Marktbewegungen zu verbessern. Hauptmerkmale: Präzise Orderblock-Erke

Adaptive Volatility Range [AVR] - is a powerful tool for identifying key trend reversals. AVR - accurately displays the Average True Volatility Range taking into account the Volume Weighted Average price. The indicator allows you to adapt to absolutely any market volatility by calculating the average volatility over a certain period of time - this provides a stable indicator of positive transactions. Thanks to this , Adaptive Volatility Range has a high Winrate of 95% There are two ways t
Darvas Flow is a revolutionary trading indicator that combines the classic Darvas Box method with modern market flow analysis. Developed for serious traders, Darvas Flow offers a powerful and intuitive tool for identifying trading opportunities. This indicator has been through backtesting on the XAUUSD M30 pair for 6.5 years. If you are interested, please visit this EA product : https://www.mql5.com/en/market/product/121320
Key Features: Darvas Box Method Implementation : Darvas Flow au
FREE

This indicator identifies and highlights market inefficiencies, known as Fair Value Gaps (FVG), on price charts. Using a custom algorithm, the indicator detects these areas of imbalance where the price moves sharply, creating potential trading opportunities. Indicator Parameters: Bullish FVG Color (clrBlue) : Color used to highlight bullish inefficiencies. The default value is blue. Bearish FVG Color (clrRed) : Color used to highlight bearish inefficiencies. The default value is red. Bullish FVG
FREE

Im Trading-Bereich ist der Schlüssel zum Erfolg, die richtigen Werkzeuge zur richtigen Zeit zu haben. Unser innovativer Volumenprofil-Indikator wurde mit einem einzigen Ziel entwickelt: Tradern einen beispiellosen Zugang zu wichtigen Marktaktivitätsinformationen zu bieten. Dieses hochmoderne Werkzeug ermöglicht es Ihnen nicht nur zu sehen, wo und wann Volumen gehandelt wird, sondern auch die Markttiefe mit einer nie dagewesenen Klarheit zu verstehen. Hauptmerkmale: Zeitliche Flexibilität: Stelle

Maximiere deine Trading-Chancen mit dem "Auto Trendlines" Indikator Entdecke den "Auto Trendlines" Indikator: "Auto Trendlines" ist das essentielle Werkzeug für jeden technischen Trader. Dieser Indikator zeichnet automatisch Trendlinien und identifiziert Unterstützungs- und Widerstandsniveaus mit chirurgischer Präzision. Ideal für diejenigen, die Marktausbrüche und Umkehrungen nutzen möchten. Hauptmerkmale: Automatisches Zeichnen von Trendlinien: Identifiziert und zeichnet wichtige Trendlinien o

Optimiere deine Handelsentscheidungen mit dem "autoFibo" Indikator Entdecke den "autoFibo" Indikator: "autoFibo" ist das essenzielle Analysewerkzeug für Trader, die Fibonacci-Niveaus voll ausnutzen möchten, ohne manuell zeichnen zu müssen. Dieser Indikator automatisiert den Fibonacci-Retracement-Prozess und bietet sofortigen visuellen Zugang zu wichtigen Unterstützungs- und Widerstandszonen. Hauptmerkmale: Automatisches Fibonacci-Retracement: Zeichnet automatisch Fibonacci-Niveaus, was die Ident

Verbessere deine Trading-Leistung mit dem "Better Volume" Indikator Entdecke den "Better Volume" Indikator: Der "Better Volume" ist das essenzielle Werkzeug zur Analyse des Marktvolumens für Trader, die sich abheben möchten. Es analysiert Tick-Volumen mit beispielloser Genauigkeit und bietet eine fortgeschrittene Gleitende-Durchschnitt-Funktion (PERIOD_MA) sowie anpassbare Kauf- und Verkaufsalarme. Hauptmerkmale: Fortgeschrittene Volumenanalyse: Erkenne Volumenspitzen, die wichtige Preisbewegung

Channel Vertex is a price action pattern formed by price Chanel and a triangle pattern . Price channels basically indicates possible support and resistance zones around a price movement and retracement or breakout at these levels can indicate possible trend continuation or reversal .
Majority of the times price fluctuations forms triangle patterns defined by 3 vertexes , these triangle patterns most times defines a trend continuation. A triangle pattern is a trend continuation pattern tha
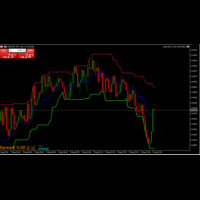
The Donchian Channel Indicator I created is a powerful tool for analyzing price trends and volatility. By plotting the highest high and lowest low over a specified period, it helps identify potential breakout opportunities and trend reversals. This indicator is valuable for traders seeking to understand market dynamics and make informed decisions based on price movements. Its simplicity and effectiveness make it an essential addition to any trading strategy.
FREE

Overview: The US Dollar Index (DXY) is a key financial indicator that measures the strength of the US Dollar against a basket of six major world currencies. This index is crucial for traders and investors as it provides a comprehensive view of the overall market sentiment towards the US Dollar and its relative performance. All Products | Contact Composition: The DXY's composition is as follows: Euro (EUR): 57.6% Japanese Yen (JPY): 13.6% British Pound (GBP): 11.9% Canadian Dollar (CAD): 9.1%
FREE

DTFX Algo Zones are auto-generated Fibonacci Retracements based on market structure shifts.
These retracement levels are intended to be used as support and resistance levels to look for price to bounce off of to confirm direction.
USAGE Figure 1 Due to the retracement levels only being generated from identified market structure shifts, the retracements are confined to only draw from areas considered more important due to the technical Break of Structure (BOS) or Change of Character

CONGESTION BREAKOUT PRO
This indicator scans the breakout of congestion zones . This indicator unlike any other congestion indicator you will find in the market right now, it uses an advanced algorithm not peculiar to most traditional congestion indicators available today . The advanced algorithm used to define the congestions is greatly responsible for the high rate real congestion zones and low rate fake congestion zones spotted by this product.
UNDERSTANDING CONGESTION
Congestion are
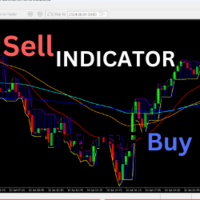
Welcome to a highly versatile and customizable trading indicator designed to elevate your trading strategy. This indicator integrates four moving averages (MAs) and order blocks, providing you with a powerful tool for market analysis and decision-making. Key Features: Four Moving Averages (MAs): This indicator allows you to utilize up to four different moving averages simultaneously. You can adjust each MA's period, color, and style to tailor the indicator to your specific trading needs. Whether
FREE

Introducing our Smart Money Concepts (SMC) and Inner Circle Trader (ICT) Indicator, specifically designed for professional traders seeking precision in their market analysis. This tool seamlessly integrates key SMC/ICT concepts directly onto your charts, providing clear and accurate visual cues.
Key Features: Order Blocks Identification: Automatically detects and highlights both bullish and bearish order blocks, allowing you to see where institutional orders are placed. Customize the color
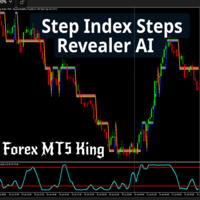
Unlock precision in your trading with the Step Index Steps Revealer AI . This advanced MT5 indicator is your ultimate tool for identifying key price levels on major forex pairs, including GBP/USD, EUR/USD, and others, as well as the step index
Key Features 1. Accurate Price Level Identification Plots precise key levels on major forex pairs like GBP/USD, EUR/USD, USD/JPY, and more. Ideal for traders looking to capitalize on bounce backs and breakouts with accuracy. 2. Optimized for Step Index C

O Indicador foi desenvolvido para a bolsa Brasileira, identificando a relação do Índice com a soma dos principais ativos do IBOV, também funciona para qualquer mercado do mund o, possui um oscilador WPR com a soma dos principais ativos escolhidos, indicando a antecipação do movimento em relação ao Índice. Características WPR com a soma dos papéis escolhidos - branco WPR do papel atual - vermelho Canal de Tendência O indicador pode indicar movimento de entradas, sendo: cruzamento das linhas cruz
FREE

MT5用 サブウィンドウにスプレッドとBUY SWAP(BS)とSELL SWAP(SS)を表示するインジケーターです。
表示の文字フォントの大きさと色の設定、スプレッドの表示をPIPS表示もしくはPOINTS表示切替が可能ですので、チャートの色設定などに合わせて、お好みでご利用いただけます。 サブウィンドウの表示サイズに合わせて、その中央に表示するようになっています。
(ご協力お願いします!) こちらは無料でご利用いただけます。どうぞご自由にご利用ください。 もしよければ MS High Low indicator も紹介していますので、どうぞご参照の上、DEMO版のダウンロードをお試しください!
Happy Trading :)
FREE

Session Box Indicator for MetaTrader 5
Description: The SessionBox indicator is designed to visually represent the trading sessions on a chart, specifically the Asian, European, and American sessions. This indicator draws customizable rectangles around each session, allowing traders to easily identify different trading periods. It also includes labels to denote each session, enhancing clarity.
Users only need to input the session start and end hours in their server time. Please note, the As

WHY IS OUR FXACCCURATE TCT MT5 THE PROFITABLE ? Gives entry, stop and target levels from time to time. It finds Trading opportunities by analyzing what the price is doing during established trends. We have made these indicators with a lot of years of hard work. It is made at a very advanced level.
Established trends provide dozens of trading opportunities, but most trend indicators completely ignore them! The trend reveals trading indicator represents an average of 10 different trades per trend
O delta volume é uma ferramenta poderosa utilizada em várias estratégias de operação, especialmente no trading de futuros, ações e criptomoedas. Aqui estão algumas das principais estratégias onde o delta volume é frequentemente aplicado: Identificação de Tendências : O delta volume ajuda a identificar a direção da tendência predominante, mostrando se há mais pressão de compra ou venda. Isso pode ser útil para confirmar a força de uma tendência ou identificar possíveis reversões. Confirmação de B

Elder Impulse Indicator Overview: The Elder Impulse Indicator is a powerful tool designed for traders who want to combine the strengths of trend-following and momentum strategies. Developed by Dr. Alexander Elder, this indicator helps traders identify potential entry and exit points by analyzing both price direction and momentum. It’s an essential tool for making informed decisions in various market conditions, whether you're trend-trading, swing trading, or looking for momentum shifts. Key Fea

Golden Spikes Detector Acknowledgement and Dedications: The name of this indicator was Inspired by an Original; Mr Grant Koopman; a Knowledgeable and experienced Synthetics trader. I dedicate this indicator to Mr Grant.
Overview: The Golden Spikes Premium is a groundbreaking trading indicator meticulously crafted for the Boom and Crash indices on the Deriv market. Tailored to meet the needs of discerning traders, this powerful tool operates exclusively on the one-minute timeframe, providin
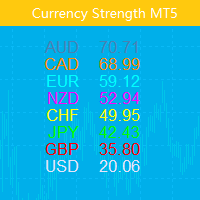
Dieser Indikator zeigt die relative Stärke von acht Hauptwährungen (USD, EUR, GBP, AUD, NZD, CAD, CHF, JPY). Kraftwerte werden im Bereich von 0 bis 100 normalisiert. Werte über 60 bedeuten stark. Ein Wert unter 40 deutet auf Schwäche hin.
Fahrkarte Only Show Current Pair - Bei „true“ wird nur das aktuelle Diagrammpaar angezeigt. Ansonsten werden alle acht Kurven angezeigt. Bars To Show – Anzahl der Balken zur Anzeige der Kraftkurve. Ma Periods To Smooth Curves : Gleitende Dur

Introducing the BOOM CRASH MASTER Indicator: Unleash the Power of Precision Trading! Step into the world of unparalleled trading with the BOOM CRASH Master Indicator, exclusively designed for the Boom and Crash indices offered by Deriv broker. This cutting-edge tool is your gateway to mastering the art of spike detection and anti-spike entries, ensuring you stay ahead of the market’s every move. Key Features: Precision Spike Detection: Harness the power of advanced algorithms to catch spikes wi

The MS High Low Lines indicator is a tool designed to enhance trend visualization for MT5. It displays high and low prices as lines, using your preferred Moving Average (MA) settings (either SMA or EMA, with customizable periods). The indicator shows configured signals when prices break above or below these MAs. By setting it up with highly functional MAs, traders can better understand market trends and make trades with a statistical edge. You can modify settings and place multiple indicators o

VolaMetrics VSA | Ein Mächtiger Verbündeter in der Technischen Analyse Der VolaMetrics VSA ist ein technischer Analyseindikator, der die Volume Spread Analysis (VSA) Methode mit einer detaillierten Analyse des Handelsvolumens kombiniert. Entwickelt, um signifikante Preisbewegungen zu identifizieren und zu verfolgen , nutzt der VolaMetrics VSA die Interaktion zwischen Volumen und Preisspread , um wertvolle Einblicke zu bieten, die bei Handelsentscheidungen unterstützen können. Grundlagen der V
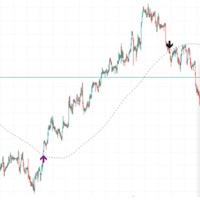
If the price is cutting above the slow length moving average, a breakout may occur. If the price is cutting below, a pullback may occur in the market. This was known for a long time, but there aren't many indicators which signal on the event. Candlestick pattern validation is also used in this indicator so that signals will not be drawn on doji candles or small "uncertainty" candles. The length of the moving average period can be defined by the user (default is 200). The number of price movement
FREE
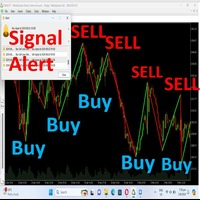
Hello Traders, *-For your bonus one indicator with SL,TP zone* just give your review, comment.Once finish developing I will give you**** Trend identification Indicator This is a indicator that will identify trend zone as bearish and bullish zone . This indicator can use for all pairs and any timeframe you can use it . *Green lime mean buy.Red line mean sell.You will receive alert sound when signal generate. The create best on high, low point and moving average calculation. You can customize valu
FREE
OUR TELEGRAM FOR MORE INFORMATION
This Trading indicator automatically plots contract blocks characterized by support and resistance zones. This powerful tool enables traders to easily visualize key market levels where prices tend to bounce or reverse. The contract blocks are represented by colored rectangles indicating support (bottom) and resistance (top) zones, thereby aiding decision-making and optimizing trading strategies.
FREE

Fractals Aydmaxx 2024 Overview: Fractals Aydmaxx 2024 is a custom indicator designed for the MQL5 trading platform, developed by Aydmaxx. This indicator identifies and displays fractal patterns on your trading chart, which are essential for recognizing potential market reversals. The indicator highlights both bull and bear fractals, making it easier for traders to spot key levels of support and resistance. Features: Customizable Fractals: Allows the user to set the number of bars on the left and
FREE

This indicator/dashboard , is place on a single symbol. It shows the percentage of movement withing all time frames from M1 to W1.The text will change green if all % are in the positive for a buy signal.The text will change red if all % are below zero and in negative for a sell signal. There are audible notifications, as well as on screen notifications along with push notifications that can be turned on and ON/OFF in the settings.
This is a sure way to Find trends quickly and efficiently, with
You can use the indicator in trend following to detect trend changes. Each color change is a trading signal. It should be used on at least 1 hour charts. It is recommended to use it on 1-day charts. However, it should be noted that the number of meaningful candles (without gap) on your chart should be at least 80.
The calculation method is based on ATR, MA and CCI indicators. However, for a significant part of the calculation I have developed my own algorithm based on standard deviation and r
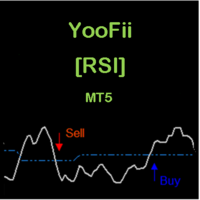
CONSTITUTION YooFii [RSI] is an indicator consisting of an oscillator and a dynamic level. The oscillator, dynamic level and warning signals can be adjusted via the inputs. It is designed for the MT5 platform only. APPLICATION This indicator should be used with a trend filter [e.g. two moving averages, MA 200 and MA 55] [see screen shots for more details]. when the oscillator crosses the dynamic level from bottom to top, we have a BULLISH move. when the oscillator crosses the dynamic level from

Average Session Range: Calculate and Average the Sessions High-Low Range of Specific Time Sessions Over Multiple Days. The Session Average Range is a sophisticated and precise tool designed to calculate the volatility of specific time sessions within the trading day. By meticulously analyzing the range between the high and low prices of a defined trading session over multiple days, this tool provides traders with a clear and actionable average range. **Note:** When the trading platform is closed
FREE
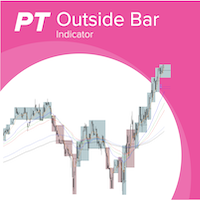
Aussenstab are important in professional price action trading and were made popular by Michael Voigt. Highs and lows of outside bars ( Aussenstäbe ) can be utilized as entry and exit for trades following different strategies. Examples for strategies with inside/outside bars are Reversal Trend continuation Breakout Ranges This indicator allows to displays outside bars on the current and configurable higher timeframes. E.g. you can display the M5 outside bars on a M1 timeframe to see the bigg

Price and Spread Indicator
Version: 1.0 Developer: Creative Tech Solutions Website: https://www.creativetechsolutions.co.uk
Overview The Price and Spread Indicator is a great tool for MetaTrader 5 that displays the Ask and Bid prices along with the spread directly on the chart. This indicator provides real-time updates and allows traders to make informed decisions based on accurate price information.
Features - Real-time Price Updates: Continuously updates Ask and Bid prices. - Spread D
FREE
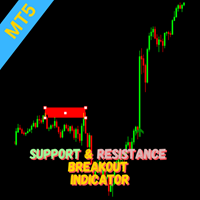
Indicator Overview This indicator utilizes the Zigzag indicator to identify potential support and resistance levels. When the price action breaks through one of these levels, a trading signal is generated. How it Works The Zigzag indicator is employed to pinpoint significant price highs and lows, forming potential support and resistance areas. A signal is triggered when the current candle closes beyond a previously established support or resistance level. Traders can consider entering a position
The VSA Scanner Dashboard is a multi-symbol, multi-timeframe scanner that displays VSA signals. It is based on the Volume Plus and VSA Signals indicator. Features Displays the VSA signal of the last closed candle. Monitors 28 customizable instruments (symbols) and up to 21 timeframes at the same time. Easily arrange symbols in any order. Each signal has a tooltip that displays the name and time of appearance. Click on each signal to open a new chart. All types of alerts (sound, pop-up, email,
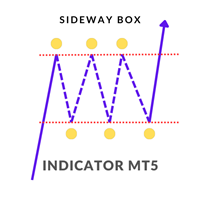
Sideway Box Indicator The Sideway Box Indicator is an advanced trading tool designed to help traders identify and capitalize on sideways market conditions. This powerful indicator detects periods when the market is in a sideways (ranging) phase, providing traders with clear visual cues. Key Features: Sideways Market Detection : The Sideway Box Indicator accurately identifies sideways market conditions, allowing traders to recognize when the price is consolidating within a specific range. Buy/Sel

This MQL5 Speed Indicator script calculates the average speed of price movements for a selected financial instrument over a specified period. It uses the arithmetic mean to determine the average speed, which is computed by dividing the distance (change in price) by the time interval. The indicator then displays this value as a histogram in a separate window. Average Speed Calculation : The speed is calculated using the formula v = d t v = \frac{d}{t} v = t d , where d d d is the price differen
The "Order Block Indicator for MetaTrader 5" is an advanced trading tool designed to help traders identify key order block zones in the financial markets. Order blocks are areas of institutional buying and selling, often marking significant price levels where market reversals or continuations are likely to occur. This indicator provides a visual representation of these zones directly on the chart, enabling traders to make more informed trading decisions. Key Features: Accurate Order Block Identi
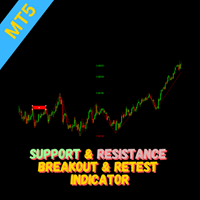
Overview The Breakout and Retest indicator is designed to identify potential trading opportunities by detecting price breakouts from significant support and resistance levels followed by a retest of the broken level. How it Works The indicator analyzes price data to determine key support and resistance areas. When the price decisively breaks through one of these levels and then retest it, then a potential breakout is signaled when it breakout again. To increase the probability of a successful t

Quantum Prime Indicator Take Note 1.This indicator works with additional license to prevent third party software from access. Kindly message me after purchase to receive license 2.You will get the quantum prime indicator for free after purchasing the Quantum prime EA.
The Quantum Prime Indicator is a cutting-edge trading tool designed to revolutionize your trading experience by integrating the powerful concepts behind the renowned Quantum Prime EA. This advanced indicator leverages sophistic
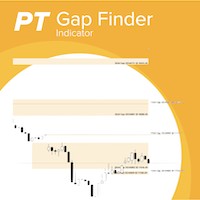
With the gaps finder indicator gaps between trading session are automatically added to you chart and you will never miss a gap which you can use in your trading strategies. Gaps often act as a magnet where the markets returns to or when a gap is closed often constitutes a reversal point.You don't have to draw manually gaps anymore. Key Features: Support for multiple trading sessions in a single chart, e.g market session and future session Configurable number of days to look back for gaps Highly
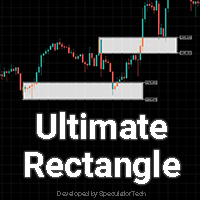
ST Ultimate Rectangle MT5
Introducing our latest MT5 indicator: the upgraded Rectangle Object Indicator. This powerful tool boasts an enhanced rectangular object, allowing for simultaneous color fill and outlining. Plus, it offers the flexibility to display prices conveniently at both the top and bottom of the rectangle. Streamline your trading analysis with this versatile indicator, designed to provide clarity and precision in every trade.
We value your input in further refining our indic

AtBot: Wie es funktioniert und wie man es benutzt ### Wie es funktioniert Der "AtBot"-Indikator für die MT5-Plattform generiert Kauf- und Verkaufssignale mithilfe einer Kombination von technischen Analysetools. Er integriert den einfachen gleitenden Durchschnitt (SMA), den exponentiellen gleitenden Durchschnitt (EMA) und den Durchschnitt der wahren Reichweite (ATR)-Index, um Handelsmöglichkeiten zu identifizieren. Darüber hinaus kann er Heikin Ashi-Kerzen verwenden, um die Signalgenauigkeit zu
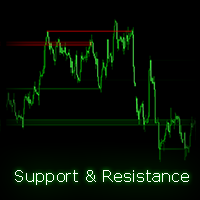
Dieser Indikator findet und plottet automatisch Support- und Widerstandskanäle auf Ihrem Chart, um wichtige Level einfach zu identifizieren. Der Indikator unterstützt mehrere Zeitrahmen, sodass Sie Kanäle aus verschiedenen Zeitrahmen auf Ihrem aktuellen Chart anzeigen können. Darüber hinaus bietet er transparente Farben für verbesserte visuelle Klarheit und ermöglicht es Ihnen, die Farben der Kanäle nach Ihren Wünschen anzupassen. Wie funktioniert dieser Indikator? Der Indikator findet Schwingun
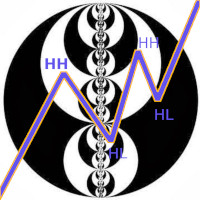
Der Indikator für die Marktstruktur im aktuellen Zeitrahmen findet:
1. Trend (aufsteigende und absteigende Wellen). Die Änderung der Richtung der Welle erfolgt nach dem Ausfall des Extremums (Liquiditätsabzug von der gegenüberliegenden Seite). Das Rendern eines Trends erfolgt unter Berücksichtigung der äußeren Balken (es kann 2 Extreme an einer äußeren Leiste geben). Der Trend kann sich mit der minimalen Anzahl von Balken in der Welle (2 oder mehr) abbilden. Wird durch den Parameter QTY_bars_
Der MetaTrader Market ist eine einzigartige Plattform für den Verkauf von Robotern und technischen Indikatoren.
Das Merkblatt für Nutzer der MQL5.community informiert Sie über weitere Möglichkeiten: nur bei uns können Trader Handelssignale kopieren, Programme bei Freiberuflern bestellen, Zahlungen über das Handelssystem automatisch tätigen sowie das MQL5 Cloud Network nutzen.
Sie verpassen Handelsmöglichkeiten:
- Freie Handelsapplikationen
- Über 8.000 Signale zum Kopieren
- Wirtschaftsnachrichten für die Lage an den Finanzmärkte
Registrierung
Einloggen
Wenn Sie kein Benutzerkonto haben, registrieren Sie sich
Erlauben Sie die Verwendung von Cookies, um sich auf der Website MQL5.com anzumelden.
Bitte aktivieren Sie die notwendige Einstellung in Ihrem Browser, da Sie sich sonst nicht einloggen können.