Neue technische Indikatoren für den MetaTrader 5 - 56

This is a combination of 3 customized indicators, to make chart clean, we only showing up or down arrows. This gives good result in 1 hour and above time frames. In one hour chart, please set sl around 50 pips. Once price moves into your direction, it would be good to trail your sl by 30 to 50 pips to get more profit as this indicator kinda trend follower. In four hour chart, set ls around 100 pips. Works in all major pairs and winning ration is around 70 % based on back test.

Koala Engulf Muster Preisplan
Schritt 1: Kostenlos für die ersten 20 Downloads.
Schritt 2: Mieten Sie 10 $ / Jahr für die nächsten 20 Downloads.
Schritt 3: Mieten Sie 20 $ / Jahr für die nächsten 20 Downloads.
Schritt 4 ; Kaufpreis für lebenslange Nutzung für die nächsten 100 Download 39 $.
Schritt 5: Der endgültige Preis für die Lebensdauer dieses Produkts beträgt 99 $.
Koala Engulf Pattern Einführung
Professioneller MT5-Indikator zur Erkennung von Engulf-Pr

This is advanced Multi-Symbol and Multi-Timeframe version of the "Candle Pattern Finder" indicator (search for candlestick patterns based on the book by Gregory L. Morris "Candlesticks charting explained. Timeless techniques for trading stocks and futures" ). The indicator searches for candlestick patterns for ALL symbols of the "Market Watch" window and for ALL standard timeframes from M1 to MN1. When patterns appear on any symbol / timeframe, the indicator gives a signal (text, sound, sending

Description
SuperCCI is an indicator based on the standard CCI indicator. It identifies and displays convergences/divergences in the market and forms the corresponding entry points. Also, using the trading channel index, it determines the direction of the trend and displays the levels of support and resistance .
Features Not repaint. Shows entry points. Shows the direction of the current trend and support/resistance levels. Has notifications. Recommendations
Use convergence/divergence to

I would like to present to you really UNIQUE multitimeframe and multicurrency indicator which will be showing both reaction zones ( Where the price will have an immediate reaction from a certain zone) and also a reversal zones , which could reverse price for a long time. The main advantage is that ALL THE ZONES ARE SHOWN before the happen and not after like many do ( THis is shown very well in the screenshots)
Another reason why it is unique is that you put it on 1 graph , for example EURUS

In this indicator you choice a data to be used from yesterday (high, low, open, close, etc) to automatically draw an line to be the zero. And, from that a percentage deviation ("Percentage to be used") is calculated and used to draw others line to both side until a limit be reached.
Both sides can have diferrent colours as show in screenshots. Also, more than one indicator can be used at same time.
FREE

Necessary for traders: tools and indicators Waves automatically calculate indicators, channel trend trading Perfect trend-wave automatic calculation channel calculation , MT4 Perfect trend-wave automatic calculation channel calculation , MT5 Local Trading copying Easy And Fast Copy , MT4 Easy And Fast Copy , MT5 Local Trading copying For DEMO Easy And Fast Copy , MT4 DEMO Easy And Fast Copy , MT5 DEMO
Can set the cycle for other varieties of K line graph covered this window, fluctuations obse
FREE

Necessary for traders: tools and indicators Waves automatically calculate indicators, channel trend trading Perfect trend-wave automatic calculation channel calculation , MT4 Perfect trend-wave automatic calculation channel calculation , MT5 Local Trading copying Easy And Fast Copy , MT4 Easy And Fast Copy , MT5 Local Trading copying For DEMO Easy And Fast Copy , MT4 DEMO Easy And Fast Copy , MT5 DEMO
The homeopathic indicator is also called the CCI indicator. The CCI indicator was propos
FREE

"Spotting emerging trends, defining correction periods, and anticipating reversals can benefit your trading in many ways..." So be it: Higher Highs & Lower Lows indicator. This is an indicator created by Vitali Apirine and presented to the public through the article "Time To Buy. Time to Sell - It's a Stochastic, Higher Highs & Lower Lows" in the Stocks & Commodities magazine . This is a Momentum indicator that helps determine the direction of a trend. Higher Highs and Lower Lows are two indicat
FREE

For those who feel that regular RSI is too fast and too noisy to be used on regular trades or in EAs and want to have an alternative to meter the Momentum of the Price, here is a solution presented on the great article of the Technical Analysis of Stocks & Commodities magazine (April, 2015), by Vitali Apirine, called: Slow Relative Strenght Index . Its reading is almost the same as the regular RSI, but its levels of Overbought and Oversold are 80 and 20 instead. SRSI is very powerful to show div
FREE

FXC iDeM-DivergencE MT5 Indicator
This is an advanced DeMarker indicator that finds trend-turn divergences on the current symbol. The indicator detects divergence between the DeMarker and the price movements as a strong trend-turn pattern.
Main features: Advanced divergence settings
Price based on Close, Open or High/Low prices Give Buy/Sell open signals PUSH notifications
E-mail sending Pop-up alert Customizeable Information panel Input parameters: DeM Period: The Period size of the DeMarke

FXC iCCI-DivergencE MT5 Indicator
This is an advanced CCI indicator that finds trend-turn divergences on the current symbol. The indicator detects divergence between the CCI and the price movements as a strong trend-turn pattern.
Main features: Advanced divergence settings
Price based on Close, Open or High/Low prices Give Buy/Sell open signals PUSH notifications
E-mail sending Pop-up alert Customizeable Information panel Input parameters: CCI Period: The Period size of the CCI indicator.
C

The Oscar, one of my favorite indicators. This is my enhanced Version of it with more options and better visuals. Many different averaging methods Oscar changes color on signal cross, but not too volatile (3% extra threshold) Adaptable Divisor, higher numbers lead to more signals, due to higher fluctuations. Its a fast but quite accurate trend direction indicator. Play around with the settings and make it match to your setup. GL trading Please follow me on Twitter https://twitter.com/semager and
FREE

MT5. Распознаёт боковой тренд (флет) на ранней стадии и рисует его границы, на любом таймфрейме, на любом инструменте, до смены тенденции. Индикатор основан на анализе характеристик волн, заранее предупреждает о возможном боковом тренде (Flat). Вершины волн помечены буквой с цифрой по моей разработанной волновой системе. Индикатор предскажет флет раньше чем мы его увидим на графике. Не требует сложной настройки параметров. Адаптирован под 2,4 и 3,5 знаковые котировки. При первой загрузке и
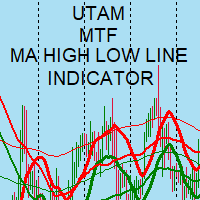
MTF Moving Average High Low line. I use it in my MT5 and MT4 robots in the round. Look at the robots and indicators I put up under my name. Good luck trading! :)
MTF Moving Average (Mozgó Átlag) High (felső) Low (alsó) line (vonala). MT5 és MT4 robotomban használom a fordulóban. Nézd meg a nevem alatt milyen robotokat és indikátort raktam fel . Sok sikert a kereskedéshez! :)

Projeção de alvos harmônicos com dois cliques, os alvos possuem melhor qualidade quando ancorados em candles climáticos, seja de ignição ou exaustão ou em pivôs de alto volume.
Funciona com qualquer ativo (volume real e volume tick), em qualquer tempo gráfico, ações, indicies, futuros, forex, criptomoedas, commodities, energia, mineiro e qualquer outro. As projeções devem respeitar os princípios de confluência e simetria, portanto não devem ser utilizados unicamente como critério de decisão, se

O CoioteTradeDetector monitora o time and trades (time and salles), é possível criar filtros de alerta gráficos (plotagem de linha com qtd) com variações de agressões pré-definidas.
É possível monitorar grandes lotes, ordens diretas e alta frequência de trades. Para perfeito funcionamento do produto é preciso ter os dados de agressão da corretora (acesso completo ao times and trades).

This indicator draws a vertical line repeatedly at the set time. The number of lines that can be set can be set arbitrarily. In addition, it is possible to set 4 types of lines. It is possible to change different times, colors, line types, etc. The time can be set to any time in minutes.
In the next version, we plan to display the high and low prices within the setting range.
FREE
RaptorT: Cumulative Volume and Cumulative Volume Delta (Buying Selling Pressure) Introduction RaptorT CV & CVD (CVD is also known as Buying/selling Pressure or Book Pressure) offers two basic and meaningful indicators for trading having volumes as main index and weigh of the market interest. It gives good insights in combination with VWAP line and its four upper and lower standard deviations, developing PVP (Peak Volume Price, the equivalent of the POC for the old Market Profile), Volume Profi

Custom Spread Indicator *Please write a review, thanks!
Also MT4 version is available
Spread Indicator show the current spread in pips with color codes. Handle 3 levels, Low, Medium, High. You can set levels and colors for each level (eg. Low: Green, Medium: Orange, High: Red), and can choose display position on the chart.
There is two spread calculation mode: -> Server spread value -> Ask - Bid value
Can set opacity, for better customization. When spread jump bigger, then display do
FREE

Moving Average Distance Indicator
The “Moving Average Distance Indicator” calculates the difference between the instrument's price and the moving average of your choice, showing this difference in percentage values or in price. In other words, it indicates how far the price is from the moving average.
What is it for?
The great advantage of this indicator is the ease to compare movement expansions that occurred in the past, at different price levels, as the indicator works in a levell

Big summer sale. Save up to 40% on my products. SR dashboard - save 10$! With the SR Dashboard, you get a powerful tool to control some of the most important information in trading. Assemble a setup according to your strategy and get informed as soon as this setup is valid. Assign scores to defined conditions and let the Dashboard find them. Choose from Trend, Average Daily Range, RSI, Moving Averages, Pivot (Daily, Weekly, Monthly), Highs and Lows, Candlestick Patterns. What can you do with th

This Indicator adding power to traditional zigzag indicator. With High-Low numbers in vision it will be easier to estimate change of trend by knowing the depth of each wave. Information including points, pips, percentage%, and #bars can be displayed based on configuration. All information is real-time update. This indicator is especially useful in sideway market to buy low sell high.
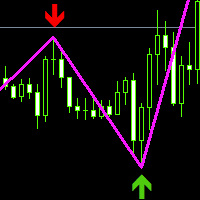
Dieser Index basiert auf der sekundären Entwicklung von Zickzack, das Hinzufügen von Hoch- und Niedrigpunktpfeil, Verdickung der Linie und Änderung der Farbe.Kann eine gute Anzeige der aktuellen Handelssignale, aktuelle lang oder kurz.Zur Bestimmung des Handelspunkts, der einen großen Bezugswert hat, kann er mit anderen Indikatoren kombiniert werden.Im Vergleich zum allgemeinen Trend-Index oder zum Oszillationschargenstandard ist die genaue Bestimmung aus der Perspektive historischer Datenforsch
FREE

Торговля пивотами:
1.pp pivot
2. r1 r2 r3, s1 s2 s3 Necessary for traders: tools and indicators Waves automatically calculate indicators, channel trend trading Perfect trend-wave automatic calculation channel calculation , MT4 Perfect trend-wave automatic calculation channel calculation , MT5 Local Trading copying Easy And Fast Copy , MT4 Easy And Fast Copy , MT5 Local Trading copying For DEMO Easy And Fast Copy , MT4 DEMO Easy And Fast Copy , MT5 DEMO
Empfehlen dringend Trendindikatoren,
FREE

Necessary for traders: tools and indicators Waves automatically calculate indicators, channel trend trading Perfect trend-wave automatic calculation channel calculation , MT4 Perfect trend-wave automatic calculation channel calculation , MT5 Local Trading copying Easy And Fast Copy , MT4 Easy And Fast Copy , MT5 Local Trading copying For DEMO Easy And Fast Copy , MT4 DEMO Easy And Fast Copy , MT5 DEMO Fortgeschrittene Bollinger Bands:
1. Die Bollinger-Schiene ändert ihre Farbe mit der Richtun
FREE

The Level Trend PRO indicator is designed to search for reversal entry points into a local trend. It works best on intraday candlesticks M15-H1
Expert Advisor for automatic trading on indicator signals: here Advantages of Level Trend PRO Never redraws its signals;
The possibility of using it as an independent strategy;
Has a support-resistance level;
It works on the stock market, indices, oil, gold and on all timeframes;
It has a notification function on the phone;
The indicator has prov
FREE

StopLevel Die Anzeige steuert den STOPLEVEL-Pegel. Wenn sich der Pegel ändert, wird dies mit einem Alarm signalisiert. STOPLEVEL - der minimale Offset in Punkten vom aktuellen Schlusskurs für die Platzierung von Stop-Orders oder der minimal zulässige Stop-Loss / Take-Profit-Level in Punkten. Ein Nullwert von STOPLEVEL bedeutet entweder das Fehlen einer Beschränkung des Mindestabstands für Stop Loss / Take Profit oder die Tatsache, dass der Handelsserver externe Mechanismen zur dynamischen Le
FREE

Indikatoren sind für Trendfolger!
Ein Handelssystem, das aus drei gleitenden Durchschnitten aufgebaut ist. Handeln Sie mit dem Trend und lassen Sie die Gewinne laufen. Necessary for traders: tools and indicators Waves automatically calculate indicators, channel trend trading Perfect trend-wave automatic calculation channel calculation , MT4 Perfect trend-wave automatic calculation channel calculation , MT5 Local Trading copying Easy And Fast Copy , MT4 Easy And Fast Copy , MT5 Local Trading c
FREE
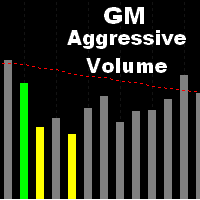
Das Volumen ist eine Ressource, die von Analysten verschiedener Methoden verwendet wird, gerade weil es die Bestätigung von Bewegungen und den Fortschritt des Marktes zeigt. Es ist ein Indikator, der die finanzielle Menge analysiert, die während eines bestimmten Zeitraums gehandelt wurde.
Dieser Indikator analysiert die Menge des Volumens für jede Kerze. Wenn diese übermäßig zunimmt, unterscheidet sie sich von den anderen durch einen farbigen Balken.
Mit dieser Anzeige können Sie nicht nur

his is a custom indicator based on double-average crossing and arrow marking.
Make multiple lists when blue arrows appear up.
Make a blank list when the red arrow appears down.
When the pink line crosses the green line upwards, the pink line is above, the green line is below, the golden fork appears, and the blue arrow appears.
When the pink line crosses down through the green line, the pink line is below, the green line is above, a dead fork appears, and a red arrow appears.
This is
FREE

Time your Entry and Exits with Average True Range (ATR) Trailing Stops ATR Trailing Stops are primarily used to protect capital and lock in profits on individual trades but they can also be used, in conjunction with a trend filter, to signal entries. The indicator will help make your calculation of stop loss easier as it will be visually aiding you in choosing where to put your stoploss level on the chart by calculating the current value of ATR indicator. For those who are unfamiliar with ATR, i
FREE

The Inno Trend indicator tracks the market trend with reasonable reliability, ignoring sharp market fluctuations and noise around the average price. The Inno Trend indicator simplifies the decision-making process by recognizing reversals using a built-in algorithm, and then confirming signals at support / resistance levels, implements a kind of technical analysis based on the idea that the market is cyclical in nature. It can be used both for pipsing on small periods and for long-term trading.
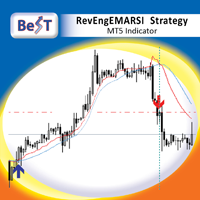
BeST_RevEngEMARSI Strategy is an MT5 Indicator that is based on the indicator RevEngEMARSI by Giorgos Siligardos that was presented in his article " Reverse Engineering RSI (II) " ( TASC_Aug 2003 ) as a new variation of his inverse-RSI indicator and which transforms the Exponential moving average of RSI into a curve in the price graph, simplifying the price projection method and improving its visual representation. BeST_RevEngEMARSI Strategy while implementing the crossings with its Moving Aver

For those traders who really care about Volume as an important vector information on Price Action, here is an exclusive idea & creation from Minions Labs: Volume Speed . The Volume Speed indicator shows you visually how much time (in seconds, minutes, hours, you choose) the Volume took to reach the Average Volume of the past bars. This way you can have the exact idea of "what is happening right now with the Volume of the current bar..." and take action accordingly with your strategy, having even

The Didi Index is an indicator that helps in the identification of the so called “Didi Needles” (Agulhada do Didi), a method created by the experienced Brazilian trader Odir Aguiar (Didi).
DIDI NEEDLES EXPLAINED
The concept of the needles is simple: 3 moving averages are added to the chart (by default 3, 8 and 20 periods, simple mode), and whenever all 3 averages pass simultaneously inside the real body of a candle, the needling occurs. It was named after the movement of passing a thread th

Секвента Демарка (Sequential) - индикатор, демонстрирующий развитие тренда, его структуру. Довольно точно отображает начальную и конечную точки, важные точки перелома. Срабатывает по открытию свечи, поэтому перерисовок не будет никогда.
Здесь нет сложных формул, только статистика, отсчёт свечей, выбранных по определённым критериям. При этом индикатор может давать очень точные сигналы для входа, особенно при поддержке какого-нибудь индикатора уровней, например, этого . Алгоритм нахождения сигнал

The Fixed Trend indicator searches for and displays the turning point price on the chart. Trend indicators are one of the main tools for analyzing trends in the Forex currency market.
The goal, which was pursued in its creation, is to obtain signals that will give less noise and respond more quickly to price changes. The Fixed Trend indicator is a trend indicator that is used to search for reversals when its boundaries break.
Trend indicators allow you to effectively determine the direction

GET THIS FULL COPY AND GET ANOTHER FREE INDICATOR ONE OF THE BEST AND USEFULL INDICATORS IN THE WORLD ..This is the one of the best usefull indicators which has chosen to be used by top traders in the world.
AUTOMATIC SUPPORT AND RESISTANCE This way of trading is also called Supply and demand, On this way of trading you can see auto colours appear where the market changes direction buying or selling Direction.
ALL KIND OF PAIRS METALS AND INDICIES ARE INCLUDED ALSO EXAMPLE, GBPUSD,GBPJPY,EU
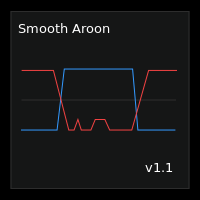
Smooth Aroon is a version of the Aroon Up and Down with smoothing and filtering.
Features :
Smoothing : You have smoothing from 0 to 99 . To smooth a signal, find the maximum value of the points in question then set the smoothing level above the maximum value. For example : If you want to smooth all signals below 30, then you should set the smoothing level above 30 This also smooths all signals above 70, since the Aroon Up and Down Oscillates between 0 and 100. Filtering : If you only
We would like to introduce you to our newly developed ZScore Dashboard Indicator for the Metatrader 5 platform. It automatically calculates and updates the ZScore values of Price (Z) and Tick Volume (ZV) as it changes in the particular timeframe chart to which the indicator is applied to. The Dashboard contains 4 columns per each average. Each average has the following columns: ZScore of Price (Z), 3 period SMA of ZScore of Price (ZMA), ZScore of Tick Volume (ZV) and a 3 period SMA of ZScore of

This plots Fibonacci deviation levels above and below a moving average of the price. Companion indicator to the " Golden Bull Wave Trader " expert advisor which uses volume\price trend to determine price reversals. https://www.mql5.com/en/market/product/56291 The expert advisor and this indicator were created in order to: Identify ideal and repeatable trade entries with high level of certainty Create a day trading strategy which doesn’t require a hard SL and TP Use alternate risk management me

Necessary for traders: tools and indicators Waves automatically calculate indicators, channel trend trading Perfect trend-wave automatic calculation channel calculation , MT4 Perfect trend-wave automatic calculation channel calculation , MT5 Local Trading copying Easy And Fast Copy , MT4 Easy And Fast Copy , MT5 Local Trading copying For DEMO Easy And Fast Copy , MT4 DEMO Easy And Fast Copy , MT5 DEMO MACD называется скользящей средней конвергенции и расхождения, которая создается на основе дво
FREE

Dieser Indikator ist ein perfekter automatischer Wellenanalyse-Indikator für den praktischen Handel! Die standardisierte Definition des Bandes ist nicht mehr eine Welle von verschiedenen Leuten, und das Ziehen von menschengemachten Interferenzen wird eliminiert, was eine Schlüsselrolle bei der gründlichen Analyse des Ansatzes spielt. =>Increase the choice of international style mode, (red fall green rise style) Derzeit Kaufrabatt! Inhalt des Index: 1. Grundwelle: Zue
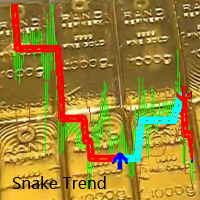
Indexinhalt: 1. Der Referenzpreis bezieht sich auf den Referenzpreis. Kurzfristig schwankt der Preis kontinuierlich und ungeordnet, und das kurzfristige Schicksal wird unvorhersehbar erscheinen 2. Referenztrendrichtung
Vorschlagen: Schwächen Sie die kurzfristigen Schwankungen der K-Linie und folgen Sie dem mittel- bis langfristigen Trend.
"Zusammen wachsen!" "Cooperative QQ: 556024" "Kooperation wechat: 556024" "Genossenschaftliche E-Mail: 556024@qq.com"
"Der Trend bildet sich

Wir müssen oft die plötzliche Trendänderung kennen, die in der Grafik auftritt, und dies kann durch Indikatoren bestätigt werden.
Dieser Indikator zeigt die Momente der Trendumkehr und wie sich der Preis in welchem Trend verschiebt.
Benutzerdefinierter Hintergrund, keine Notwendigkeit, die Farben im Diagramm zu konfigurieren, ziehen Sie einfach den Indikator!
Anzeige mit Pfeilen.
- Blauer Pfeil: Aufwärtstrend.
- Rosa Pfeil: Abwärtstrend.
HINWEIS: Kostenlose Anzeige, es kann eine W
FREE
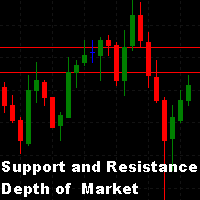
Wir suchen oft nach Unterstützungs- und Widerstandspunkten auf der Karte. Eine der Techniken, die verwendet werden können, ist die Anzahl der im Auftragsbuch angebotenen Lose. Dieser Indikator sucht nach den größten Losen im Auftragsbuch und zeichnet sie in Form von Linien in der Grafik auf. Dadurch wird ermittelt, wo zu diesem Zeitpunkt die größte Konzentration von Losen an der zentralisierten Börse angeboten wird, und so mögliche Unterstützungs- und Widerstandslinien konfiguriert.
- Die Anz

VWAP ist eine Intraday-Berechnung, die hauptsächlich von Algorithmen und institutionellen Händlern verwendet wird, um zu bewerten, wo eine Aktie im Verhältnis zu ihrem gewichteten durchschnittlichen Tagesvolumen gehandelt wird. Daytrader verwenden VWAP auch, um die Marktrichtung zu bewerten und Handelssignale herauszufiltern. Dieser Indikator wird verwendet, um den Vwap ab einem bestimmten Punkt in der Grafik zu analysieren und zu berechnen. Dieser Indikator wird häufig verwendet, um den Beginn

Eine einfache Lautstärkeanzeige entsprechend der Farbe der Kerze!
- Benutzerdefinierter Hintergrund!
- Unterstützt Volume by Ticks oder Real Volume.
Die ursprüngliche Metatrader-Volumenanzeige zeigt die Farben des Balkens nicht entsprechend der Farbe der Kerze an. Sie ändert nur die Farbe, wenn das Volumen einer Kerze größer als das vorherige ist. Dies führt manchmal zu Verwirrung bei Anfängern und kennt die Realität nicht Grund für den Farbwechsel.
Kostenlose Anzeige, es kann eine We
FREE

FIRST 10 COPIES AT 30 USD, NEXT PRICE WOULD BE 50 USD
HAWA MOMENTUM & TREND PRO (MT5) Advanced trading indicator with proper pre-defined entry and exit levels with almost 80% win rate. Its smart and advanced algorithm detects trend and trend strength using momentum for maximum profits and send signals after filtering out market noise. SETTINGS: Please make sure all inputs are NOT "false" in indicator properties otherwise it will not display identified trades. Directory Location: Download f

This indicator is created by using an exclusive algorithm to indicate you Buy or Sell in an accurate way all the possibles reversals within a normalized trending bands. The main goal for this algorithm is to achieve fast profitable movements and aggressive retracement. Thanks to the normalized bands, using the noises of the market. We have added the "Golden Trade", we define it as the perfect order: For those orders that had the perfect entry price. They were always in profit, or the final pr

This Currency Meter Calculates Strength Using a currency basket of 28 pairs? This Currency Meter uses a basket of 28 currency pair to define strength. This is very important because it gives an wholesome view of the strength of a currency by considering its reaction to all major currencies paired with it.
This Currency Meter is Multi-timeframe!!! Majority of the currency strength indicators around the market today only has a single time frame view. Even with the so called multi-timeframe versi

Dies ist die MT5-Version. Es ist ein Algorithmus, um Trendänderungen frühzeitig zu erkennen. Sie sollten mehrere Werte für den Multiplikatorparameter ausprobieren (1 <Wert <10 empfohlen). Auf den ersten Blick sehen Sie effektive Einträge. Dies ist in der Tat eine der Reihen, die Geleg Faktor ursprünglich hatte. Aber es wurde entfernt, weil es nicht mehr benötigt wurde. Die anderen Zeilen reichten für G.Faktors Effektivität aus, aber ich wollte diese noch teilen. Testen Sie es immer, bevor Sie es
FREE

Dies ist MT5 Version Hier sind mehrere Indikatoren, die zusammenarbeiten. Es funktioniert im Grunde mit gleitenden Durchschnitten und verschiedenen Ebenen von ATR, die einen dynamischen Kanal schaffen, durch den der Preis entwässert wird. Wie ich immer empfehle, sollten Sie es versuchen, bevor Sie es live verwenden, damit Sie verstehen, wie es funktioniert. Das Markteintrittssignal ist ähnlich wie bei anderen MA-Indikatoren, aber mit diesem haben Sie auch eine grafische Analyse des Moments, wenn
FREE

Dies ist die MT5-Version. Holen Sie sich Q-Math MT4 hier Schauen Sie es sich an und wenn Sie es mögen, genießen Sie es einfach. Probieren Sie verschiedene Werte aus, um die Einstellung zu finden, die am besten zu Ihrem Handel passt. Aufwärtssignal, wenn der Indikator Rasen grün und bärisches Signal gefärbt ist, wenn der Indikator grau ist. Sie können die Zeile selbst verwenden, um beim Öffnen von Aufträgen einen Nachstopp zu stopen. Dies ist nur ein Werkzeug. Eine Ergänzung. Es ist keine Strateg
FREE

Данный индикатор предназначен для мониторинга торговой активности вашего счета. Особенно полезен будет тем, кто торгует сразу на нескольких инструментах. В одном окне индикатора собрана наиболее важная информация о счете с детализацией по инструментам и мониторингом заработка. Описание настроек: Start from date history - с какой даты индикатор будет обрабатывать торговую историю Max symbol on screen - индикатор берет данные по символам из обзора рынка. В данной настройке вы можете ограничить

Time to Trade Trading timing indicator is based on market volatility through 2 ATR indicators to determine the timing of a transaction. The indicator determines the times when the market has strong volatility in trend. When histogram is greater than 0 (blue) is a strong market, when histogram is less than 0 (yellow) is a weak market. Should only trade within histograms greater than 0. Based on the histogram chart, the first histogram value is greater than 0 and the second histogram appears, this
FREE

Индикатор Analytic Trade - это полноценная торговая система. Он состоит из 4 частей: Первая - это стрелочки, показывающие наиболее оптимальные точки открытия и закрытия ордеров. Стрелка вверх - сигнал на покупку, вниз - на продажу. Вторая - это информационная панель в правом верхнем углу. Крупным шрифтом обозначена текущая цена, над ней показаны: максимум дня, расстояние от текущей цены до него и разность максимума и минимума (в пунктах). Под ней расположены: минимум дня, расстояние до минимума,
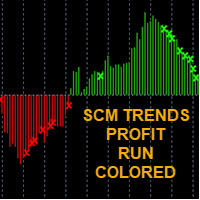
-EASY TO FOLLOW TRENDS -RED SELL / GREEN BUY -CROSS SIGNAL IS MEAN "TRENS WARNING" TO EXIT ORDER (WEAK TRENDS)
-WITH AUDIBLE ALERT ON/OFF
SCM indicator with different colors at levels 0, 100 and -100. The cross is a signal for " Exit" This exit signal is effective especially in short-term breakout trades, because it prevents early exiting at small corrections.
*****TIP EURUSD/BTC TF 10 min is work very Well****
****** GOLD TF15min is work very Well***** (after TF 15min show exit buy an

The Hybrid Stochastic indicator is a Stochastic RSI described by the famous Tushar Chande and Stanley Kroll in their book called " The New Technical Trader" . The main goal of this indicator is to generate more Overbought and Oversold signals than the traditional Relative Strength indicator (RSI). Combining these 2 indicators expands the range of the overbought and oversold territory. The idea behind it is to use the Stochastic formula over RSI values. If you want to know more about its internal
FREE

The Premier League indicator links the price in a cyclical-wave relationship. Crossing points can be used as potential market reversal points. Thus, all crossing points will be optimal points at which the movement changes taking into account the indicator period. But do not forget that the approach must be complex, the indicator signals require additional information to enter the market.
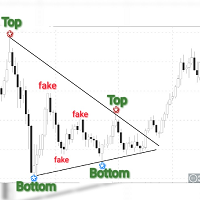
Obaforex Tops & Bottoms is a trading tool born out of a personal need to accurately filter tops and Bottoms and ensure consistency in the way tops and bottoms are picked for technical analysis. Mt4 version https://www.mql5.com/en/market/product/53637
It does not repaint (once top or bottom is printed, it don't disappear) It only prints tops and bottoms after a specified No of bars or candles to the right
This tool is expected to significantly improve the decision making of almost any form o

All in One package includes the Oscillator Predictor , MACD Predictor , Thrust Scanner and Advanced Fibonacci indicators which are mandatory for applying Dinapoli trade plans.
Please visit below links for detailed explanations of indicators. Advanced Fibonacci Indicator => https://www.mql5.com/en/market/product/107933 Thrust Scanner Indicator => https://www.mql5.com/en/market/product/52829 Overbought /Oversold Predictor indicator => https://www.mql5.com/en/market/product/52628 Macd

Description
Range Detector is an indicator that identifies impulses in the market and displays their slope angles on the chart.
Recommendations
You can use this indicator to determine a trend and, accordingly, to determine the direction of opening a position or closing an opposite position.
Parameters
===== _INDICATOR_SETTINGS_ ===== - indicator settings
Maximum History Bars - maximum number of history bars for calculating the indicator. Average True Range Period - ATR indicator peri

The indicator is the advanced form of the MetaTrader 4 standard Fibonacci tool. It is unique and very reasonable for serious Fibonacci traders. Key Features Drawing of Fibonacci retracement and expansion levels in a few seconds by using hotkeys. Auto adjusting of retracement levels once the market makes new highs/lows. Ability to edit/remove any retracement & expansion levels on chart. Auto snap to exact high and low of bars while plotting on chart. Getting very clear charts even though many ret

Very special indicator of Joe Dinapoli which is a derivative of a Detrended Oscillator. Through a set of parametric equations, a predicting oscillator is created that forecasts, one period ahead of time, overbought and oversold conditions. The resulting predictor values are expressed as bands on the bar chart, both above and below the market. It may be mistaken as a Bollinger Band but has no resemblance to it whatsoever. The Predictor bands may be used in a variety of ways to aid in entering an

Very special indicator of Joe Dinapoli which is a derivative from traditional MACD indicator. It shows the precise price, at which MACD will show line crossing and trend shifting. Also, this level is known one period ahead of time.You can constantly reassess your current position by looking at this studying a variety of timeframes. When you are in a trade, you have a feel for how much time you have for the trade to go your way by looking at the distance between the MACD Predictor line and the

What you can do with CandleStick CandleStick is a useful indicator for doing MTF analysis. This indicator displays the CandleStick of another time frame on the chart . By understanding the information in multiple time charts at the same time, it is easier to understand the overall market view. It is also a useful tool for validating and studying past quotes and trades. There are similar products made by others, but I designed and developed it so that it is easy for me to use.
Features of Candl

The indicator determines a special pattern of Joe Dinapoli. It gives very high probability buy and sell signals. Indicator does not repaint. Indicator Usage Buy Signal ''B'' Entry : Market buy order at signal bar close Stop : Low of signal bar Take Profit : First swing high Sell Signal ''S'' Entry : Market sell order at signal bar close Stop : High of signal bar Take Profit : First swing low Indicator Parameters Fast EMA : External Parameter (should be kept as default) Slow EMA: External Param
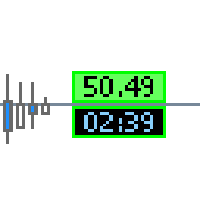
This tool gives you several informations about your broker and the current market events.
The top Infolabel shows the current spread price .
You can set whether the label should be displayed or hidden.
You can adjust price levels for automaticly change of background color.
The lower Infolabel shows the candle timer of the current time frame.
You can set whether the label should be displayed or hidden.
The bordercolor change to red if:
1. you have no connection to the tradeserver
2. y
Der MetaTrader Market ist eine einzigartige Plattform für den Verkauf von Robotern und technischen Indikatoren.
Das Merkblatt für Nutzer der MQL5.community informiert Sie über weitere Möglichkeiten: nur bei uns können Trader Handelssignale kopieren, Programme bei Freiberuflern bestellen, Zahlungen über das Handelssystem automatisch tätigen sowie das MQL5 Cloud Network nutzen.
Sie verpassen Handelsmöglichkeiten:
- Freie Handelsapplikationen
- Über 8.000 Signale zum Kopieren
- Wirtschaftsnachrichten für die Lage an den Finanzmärkte
Registrierung
Einloggen
Wenn Sie kein Benutzerkonto haben, registrieren Sie sich
Erlauben Sie die Verwendung von Cookies, um sich auf der Website MQL5.com anzumelden.
Bitte aktivieren Sie die notwendige Einstellung in Ihrem Browser, da Sie sich sonst nicht einloggen können.