Neue technische Indikatoren für den MetaTrader 5 - 7

This indicator identifies and displays zones, as it were areas of strength, where the price will unfold. The indicator can work on any chart, any instrument, at any timeframe. The indicator has two modes. The indicator is equipped with a control panel with buttons for convenience and split into two modes. Manual mode: To work with manual mode, you need to press the NEW button, a segment will appear. This segment is stretched over the movement and the LVL button is pressed. The level is displayed

The " Vertical Levels " indicator for the Forex market is a tool for displaying vertical levels on a price chart. These levels can be useful for a trader, as they help identify significant points in price movement and potential reversal or trend continuation zones.
Peculiarities:
Vertical Levels: The "Vertical Levels" indicator allows you to display vertical lines on the chart, indicating certain levels. These levels can be adjusted using input parameters. Setting options: Length : Length o

The indicator IQuantum shows trading signals for 10 symbols in the daily chart: AUDUSD, EURUSD, GBPCHF, GBPUSD, NZDUSD, USDCAD, USDCHF, USDJPY, USDNOK, and USDSEK.
Signals of the indicator are produced by 2 neural models which were trained independently from one another. The inputs for the neural models are normalised prices of the symbols, as well as prices of Gold, Silver and markers of the current day.
Each neural model was trained in 2 ways. The Ultimate mode is an overfitted neural mo
FREE

Description:
Heikin-Ashi-like swing oscillator candles. It can be used in the same way as RSI or Stochastic.
For example: Zero crossing. Above the zero line is bullish, below the zero line is bearish.
Overbought or oversold. 100 line is the extreme bought level, -100 line is the extreme sold level.
Divergences.
Time frame: Any time frame.
Instrument: Any instrument.
FREE

This indicator identifies the global trend and has a powerful algorithm for filtering out any type of noise that can interfere with trend direction identification. A special filter shows areas of sideways trend, consolidation or flat, which allows you to avoid any uncertainties in the market movement vision and gives a clear understanding of the global trend movement.
This indicator has no analogues and gives it unique advantages in the analysis of price movements and determination of the dir

This is the MT5 version of Extreme Reversal Sniper MT4 Indicator Extreme Value Sniper is a detrended price indicator Indicator finds the potential reversal levels by checking value ranges and price cycles.
***Indicator does NOT repaint so it provides accurate NO REPAINT REVERSAL SIGNALS***
MT4 Version of the Indicator: https://www.mql5.com/en/market/product/114426
It shows the overbought and oversold levels using the average range. Overbought Levels are between 4 and 10 Oversold levels a

Brief Description B4S Economic News Radar now offers enhanced features to keep traders informed and empowered. Experience comprehensive news coverage directly on your trading chart, including upcoming and past events, customizable reminders, and automatic time zone adjustments. Why News Events Matter: Market volatility triggered by economic indicators, central bank decisions, and geopolitical events can significantly impact trading outcomes. Stay ahead of these shifts with timely information and

The " Session Control " indicator is designed to display trading sessions on a price chart. This allows the trader to see at what points of activity the most important trading sessions occur: Pacific, European, American and Asian. Each of these sessions is characterized by a certain volatility and activity in the market, which is important for making trading decisions.
Peculiarities: Displaying sessions : The indicator shows time periods on the price chart corresponding to different trading s

"GoldenSwing" is a comprehensive MetaTrader 5 indicator meticulously crafted by Southern Star Trading, designed to enhance your trading strategies with precision swing high and swing low identification. Harnessing the power of swing analysis, this indicator provides traders with invaluable insights into market reversals and trend continuations, enabling them to make informed trading decisions.
With its advanced algorithm, GoldenSwing detects significant swing highs and swing lows in real-time

O indicador Supertrendingsignal imprime um sinal na tela indicando início de uma forte tendência. O sinal não mostra o ponto de entrada com melhor risco retorno, apenas faz a indicação de uma forte tendência. Foi idealizado a partir de um conjunto de médias móveis e volume. Parametros: Periodmalongo: Períodos da média longa Periodmamedio: Períodos da segunda media Periodmamedio2: Perídos da terceira media Periodmacurto: Períodos da média curta. PeriodATR: Períodos do indicador ATR para adequar
FREE

El **Heiken Ashi Smoothed** es una versión suavizada del indicador técnico Heiken Ashi, que se utiliza en el análisis de gráficos de velas para identificar tendencias del mercado y pronosticar movimientos de precios. Este indicador se basa en el promedio de datos de precios para formar un gráfico de velas que ayuda a los traders a filtrar el ruido del mercado.
**¿Para qué sirve?** Este indicador se utiliza para identificar cuándo los traders deben permanecer en una operación y cuándo está por
FREE

Brilliant Reversal Indicator for MetaTrader 5 - Your Ultimate Alert-Driven Trading Solution Unlock unparalleled trading success with the "Brilliant Reversal Indicator" tailored for MetaTrader 5. This powerful tool has been meticulously designed to empower traders by identifying critical reversal opportunities with lightning-fast alerts. Key Features: Precise Reversal Detection: The Brilliant Reversal Indicator for MT5 specializes in pinpointing potential trend reversals, providing you with a str

Brief Description: A tool to display historical Open, High, Low, and Close (OHLC) price points for various time periods. Gain insights into market behavior with data from yesterday, the day before, the previous week, and the previous month. Recognize liquidity zones effectively. Features: 1. Comprehensive Timeframe Insights: Visualize crucial OHLC points for different timeframes. Historical data for yesterday, day before yesterday, previous week, and previous month. 2. Built on ICT's Teachings:

Brief Description The indicator is a powerful tool based on Inner Circle Trader's trading theory. It strategically plots lines at key prices relative to time, highlighting crucial market moments such as Tokyo Open, New York Midnight, London Open, New York Open, New York 8:30 AM, and New York Session End. The indicator is built on the foundation of Inner Circle Trader's trading theory, emphasizing the significance of key open times as liquidity and reference zones. These zones act as magnets for
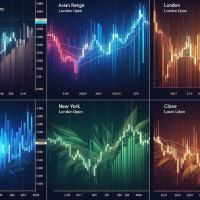
Brief Description The B4S_ICT_Killzones indicator is designed to enhance your trading strategy by highlighting key market times based on the Inner Circle Trader's (ICT) proven trading model. This indicator intelligently plots colored boxes around critical "killzone" periods, providing valuable insights into market behavior influenced by different geographical and time zone locations and time variations. Features / Indicator Settings 1. Killzone Identification Asian Range: Target the Asian tradin

Brief Description: The B4S_Institutional_Round_Number_Prices indicator identifies and marks key price levels, known as round number prices or institutional price levels, renowned for their psychological significance. These levels often influence institutional activity, attracting attention and triggering significant market moves. Features: Round Number Price Identification: The indicator excels at identifying round number prices, providing you with crucial insights into potential market moveme

Brief Description The B4S PriceLevel Watcher is a useful indicator designed to empower traders with precise price level notifications. It allows users to set customizable notifications based on specific price types, such as close, high, low, ask, bid, or either ask or bid of the current candle. Problem being solved In the ever-evolving world of trading, staying attuned to price movements is paramount. Traders need to remain vigilant, ready to act swiftly as market conditions change. However, t

Este indicador imprime 2 médias com distância de 1 ATR (Average True Range) da média principal. As demais médias móveis só são mostradas se estiverem fora desse intervalo. Parâmetros: mediaprincipal = Média que será criado o intervalo, não será mostrada. mediasec1, mediasec2, mediasec3 = médias secundárias. periodatr: periodos do ATR Este indicador faz parte do Trade System MarketStrengthRadar
FREE

Un indicador técnico de múltiples osciladores es una herramienta de análisis que combina varios osciladores para proporcionar una visión más completa de la dinámica del mercado. Los osciladores son fórmulas matemáticas que se calculan a partir de los datos de los precios y se representan gráficamente para ayudar a identificar la tendencia actual, el sentimiento del mercado y posibles puntos de giro.
**¿Para qué sirve?** Este indicador sirve para identificar condiciones de sobrecompra y sobrev
FREE

La **Media Móvil de Tercera Generación (TGMMA)** es una versión avanzada del indicador estándar de **Media Móvil (MA)**. Fue descrita por primera vez por Manfred G. Dürschner en su artículo "Gleitende Durchschnitte 3.0" (en alemán). Aquí están las características clave de la TGMMA:
1. **Reducción del Retraso**: - A diferencia de las MAs tradicionales, la TGMMA reduce significativamente el retraso. Se adapta más rápidamente a los cambios de precios, lo que la hace ideal para traders que bus
FREE

The ZigZag Wave Entry Alert** indicator, created by Azad Gorgis in 2024, is designed for MetaTrader 5 and aims to provide traders with entry signals based on ZigZag patterns. Here's a brief overview of its functionality and key features:
Functionality:
- Detection of ZigZag Patterns: The indicator identifies significant price movements and outlines potential ZigZag patterns on the chart. It detects new highs and lows based on user-defined parameters such as Depth, Deviation, and Backstep. -

Introducing the Consecutive Green/Red Candle Alert Indicator for MT5 - Your Trend Spotting Companion!
Are you ready to take your trading to the next level? We present the Consecutive Green/Red Candle Alert Indicator, a powerful tool designed to help you spot trends and potential reversals with ease. Whether you're a new trader looking for clarity in the market or an experienced pro seeking additional confirmation, this indicator is your trusted companion.
Key Features of the Consecutive Gre

Der Basic Renko-Indikator ist ein leistungsstarkes Werkzeug für Händler, die eine klare und präzise Marktperspektive suchen. Unser Indikator vereinfacht nicht nur die Visualisierung von Trends, sondern bietet auch genaue Warnungen für Umkehrungen, die Ihnen einen strategischen Vorteil bei Ihrem Handel verschaffen / Kostenlose MT4-Version
Merkmale Vollständig anpassbar: Passen Sie den Indikator mit fortschrittlichen Anpassungsoptionen an Ihre Geschäftsvorlieben an. Von den Farben bis hin
FREE
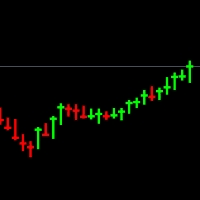
Hinweis: Sie müssen Ihren vorhandenen Diagrammtyp ausblenden. Dies können Sie tun, indem Sie die Farben des Diagramms ändern. Wenn Sie nicht wissen, wie das geht, schauen Sie sich dieses Video an – https://youtu.be/-4H6Z5Z4fKo oder kontaktieren Sie mich unter priceaction9@outlook.com
Hierbei handelt es sich um eine Art Diagramm, das anstelle Ihres Diagramms angezeigt wird. Es zeigt nur das Hoch, Tief und den Schlusskurs an und verfügt über dicke Dochte. Es hilft Ihnen, jede Kerze besser zu v

Sekundendiagramm für MetaTrader 5
Mit den Indikatoren können Sie im MetaTrader 5-Terminal Diagramme mit einem Zeitrahmen in Sekunden erstellen. Der Zeitrahmen in einem solchen Diagramm wird in Sekunden festgelegt, nicht in Minuten oder Stunden. Somit können Sie Diagramme mit einem Zeitrahmen von weniger als M1 erstellen. S15 ist beispielsweise ein Zeitrahmen mit einer Periode von 15 Sekunden. Sie können Indikatoren, Expert Advisors und Skripte auf das resultierende Diagramm anwenden.
Sie er

Erlauben Sie mir, Ihnen den Golden Sniper Indicator vorzustellen, ein leistungsstarkes MQL5-Tool, das sorgfältig für Trader entwickelt wurde, die ihre Handelserfahrung verbessern möchten. Entwickelt von einem Team erfahrener Trader mit über 6 Jahren Fachkenntnissen , bietet dieser Indikator eine zuverlässige Methode zur Identifizierung von Handelsmöglichkeiten mit bemerkenswerter Genauigkeit. Hauptmerkmale : Warnungen und Signalpfeile : Der Golden Sniper Indicator liefert rechtzeitige Warnungen
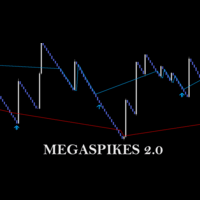
check out Megaclasic Spikes Robot here: https://www.mql5.com/en/market/product/109140 https://www.mql5.com/en/market/product/109140 MEGASPIKES BOOM AND CRASH v 2.0 NB: source codes of this indicator are available: PM me: https://t.me/Machofx The indicator is developed form a Studied combination of MA - Moving Average SAR - Parabolic Support and Resistance CCI - Commodity Channel Index
MegaSpikes 1.0 Download the 'MegaSpikes Boom and Crash' Technical Indicator for MetaTrader 5 in MetaTr
FREE

Sind Sie bereit, Ihr Trading auf die nächste Stufe zu heben? Wir stellen vor : WH Divergence Pro MT5 ,
ein erweiterter Divergenzindikator, der Ihnen die Auswahl aus einer Vielzahl beliebter technischer Indikatoren ermöglicht.
Jetzt können Sie Ihre Divergenzsignale an Ihre individuelle Handelsstrategie anpassen. Kontaktieren Sie mich nach dem Kauf, um Sie durch die Prozesse zu führen Hauptmerkmale :
Indikatorauswahl : Wählen Sie Ihren bevorzugten Indikator aus den folgenden Optione

Das Dashboard scannt die Messwerte von zwei Indikatoren: „MACD“ und „Stochastic“. Zeigt Signale in drei Spalten an: für MACD, für Stochastic und die resultierende Spalte (wenn das Signal für beide Indikatoren gleich ist). Das Scannen kann in einem oder mehreren Zeitrahmen ausgewählt werden. Wenn Sie alle Zeitrahmen deaktivieren, wird das Dashboard weiterhin geladen, jedoch mit Einstellungen speziell für solche Fälle. Signale werden immer auf den Nullbalken (der Nullbalken ist der Balken ganz rec

non-repaint free MT5 technical indicator works on all timeframes 1 minute to the monthly timeframe the trade vision buy and sell arrow is a multi currency and synthetic indicator Trade vision buy and sell arrow comes with Push Alerts purple arrow look for selling opportunities white arrow look for buying opportunities. wait for candle to close and arrow to appear before taking any trades.
FREE

The indicator works to convert normal volume into levels and determine financial liquidity control points.
It is very similar in function to Fixed Volume Profile.
But it is considered more accurate and easier to use than the one found on Trading View because it calculates the full trading volumes in each candle and in all the brokers present in MetaTrade, unlike what is found in Trading View, as it only measures the broker’s displayed prices.
To follow us on social media platforms:
tel
FREE

BEHOLD!!!
One of the best Breakout Indicator of all time is here. Multi Breakout Pattern looks at the preceding candles and timeframes to help you recognize the breakouts in real time.
The In-built function of supply and demand can help you evaluate your take profits and Stop losses
SEE THE SCREENSHOTS TO WITNESS SOME OF THE BEST BREAKOUTS
INPUTS
MaxBarsback: The max bars to look back
Slow length 1: Period lookback
Slow length 2: Period lookback
Slow length 3: Period lo
FREE

Brief Description: An advanced navigation, news display, and control panel indicator designed to revolutionize your chart analysis experience. Seamlessly navigate through timeframes, dates, and times with an intuitive control panel, and stay informed with visually represented detailed news events. Now with enhanced features and improvements for an even better trading experience. Key Features: User-Friendly Control Panel: Easily navigate through timeframes, dates, and times. Enable or disable the

The Angle Prices indicator is a tool that calculates the price angle based on price analysis, interpreting the time vector in the form of price points on the price chart. In other words, the X axis and Y axis are represented as price points, so you can actually calculate the angle with two axes of the same dimension. This allows traders to obtain information about the direction of price movement and possible entry or exit points for trades. Let's look at the main characteristics and interpretat

Descubre el poderoso aliado que te guiará en el laberinto de los mercados financieros. Este indicador revolucionario te llevará de la incertidumbre a la claridad, permitiéndote identificar con precisión los puntos de inflexión del mercado. Mejora tus decisiones de entrada y salida, optimiza tus operaciones y ¡multiplica tus ganancias con confianza.
Ahora con alertas en tu pc o móvil
¡Para más información, te invitamos a unirte a nuestro canal de Telegram en https://t.me/Profit_Evolution ¡
FREE

SPREADEX e' un indicatore per MT4 e MT5 che indica la distanza dell'ASSET dal GP. il GP e' il prezzo del vero valore dell'ASSET sottostante ottenuto per stima. Il GP e' come una calamita, attira il prezzo dell'ASSET con alta probabilita' ed all'interno della stessa giornata di trading. Quindi SPREADEX indica quali sono gli asset piu distanti dal GP al momento in tempo reale. Fornendo un punto di vista al TRADER su quali asset concentrarsi e cercare eventuali segnali di inversione dei prezzi per
FREE

I present the well-known Moving Average indicator connected to the ATR indicator.
This indicator is presented as a channel, where the upper and lower lines are equidistant from the main line by the value of the ATR indicator.
The indicator is easy to use. The basic settings of the moving average have been saved, plus the settings for the ATR have been added.
Moving Average Parameters:
MA period Shift MA Method
Moving Average Parameters:
ATR TF - from which timeframe the values are t
FREE

I present the well-known Fractal indicator.
Levels have been added to this indicator.
At the extreme points, you can see the continuation of the price line, which changes when the values of the Fractal indicator change.
The indicator is easy to use. The basic Fractal settings have been saved.
FractalLevels Parameters:
LeftBars - the number of bars on the left
RightBars - the number of bars on the right
FREE

Combination of Ichimoku and Super Trend indicators, with Signals and live notifications on Mobile App and Meta Trader Terminal. Features: Display five reliable signals of ARC Ichimoku Filter signals by their strength level (strong, neutral, weak) Send live notifications on Mobile App and Meta Trader terminal S ignals remain consistent without repainting Applicable across all time-frames Suitable for all markets Notifications format: "ARC Ichimoku | XAUUSD | BUY at 1849.79 | Tenken-Kijun cross |

Midpoint Bands is a channel-like indicator that draws two lines on the chart - an upper band and a lower band, pointing out possible reversal levels.
This is one of the indicators used in the Sapphire Strat Maker - EA Builder.
Sapphire Strat Maker - EA Builder: https://www.mql5.com/en/market/product/113907
The bands are simply calculated like this:
Upper Band = (HighestHigh[N-Periods] + LowestHigh[N-Periods])/2 Lower Band = (LowestLow[N-Periods] + HighestLow[N-Periods])/2
FREE

Combination of Ichimoku and Super Trend indicators. 1. ARC (Average Range times Constant) The concept of ARC or Volatility System was introduced by Welles Wilder Jr. in his 1978 book, New Concepts in Technical Trading Systems . It has since been adapted and modified into the popular Super Trend indicator.
The fundamental idea behind ARC is simple: to identify support and resistance levels, you multiply a constant with the Average True Range (ATR) . Then, you either subtract or add the resultin
FREE

The Trend Approximator indicator is a powerful trend indicator that helps traders identify turning points in the Forex market. Here are the main characteristics and parameters of this indicator:
Main characteristics:
Trend Indicator: Trend Approximator is a trend indicator that helps determine the direction of the current trend and identify potential reversal points.
Finding Pivot Points: It searches for and displays pivot points on a price chart, allowing traders to react to changes in t
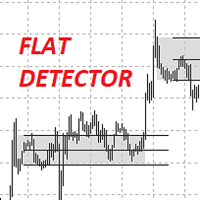
I present to you the IndFlatDetector indicator.
It belongs to the level indicators and shows the Trading Levels. This indicator combines the simplicity of intuitive settings and the accuracy of drawing levels.
Up count - the number of candlesticks up to determine the upper range
Down count - the number of candlesticks down to determine the lower range
Borders on the body or shadow - calculate the range by shadows or by body
Change the borders or not - change the boundaries of the orig

Introducing the B4S BidLine CandleTimer An insightful indicator that combines real-time bid line visualization with a dynamic countdown timer. Gain a competitive edge in your trading as you stay informed about the time remaining until the next candle starts, all displayed seamlessly on your chart. Why B4S BidLine CandleTimer? Unleash the potential of your trading strategy with the B4S BidLine CandleTimer. Here's why this indicator stands out: Real-Time Bid Line: Witness market movements like nev

El indicador técnico propuesto es un sistema de medias móviles de múltiples marcos temporales diseñado para ayudar a los operadores del mercado financiero a seguir de cerca los movimientos tendenciales. Al combinar medias móviles de diferentes períodos, este indicador ofrece una visión más completa de la dirección de la tendencia, lo que permite a los traders identificar oportunidades de trading con mayor precisión. Al utilizar este indicador, los operadores pueden maximizar sus ganancias al tom
FREE

The well-known ZigZag indicator that draws rays based on the "significant movement" specified by the pips parameter. If a ray appears, it will not disappear (the indicator is not redrawn), only its extremum will be updated until the opposite ray appears. You also can display text labels on each rays describing the width of the ray in bars and the length of the ray in points.

The Rayol Code Hour Interval Lines indicator was designed to assist your trading experience. It draws the range of hours chosen by the user directly on the chart, so that it enables traders to visualize price movements during their preferred trading hours, providing traders a more comprehensive view of price movements and market dynamics. This indicator allows the user to choose not only the Broker's time, but also the Local time. This way, the user no longer needs to calculate local time in
FREE

Simple candle countdown - never again miss how much time is left to open a new bar!
This indicator doesn't plot any line on the chart - it uses only objects and calculates the time left to open a new bar.
You can set custom colors for the panel background and border and for the text color. Simple as that, the indicator is ready to use.
If you find any bugs, feel free to contact me.
FREE
Limited time offer, 30 usd only!!!
Discover the unparalleled capabilities of MentFX's structural rules , now optimized for MT5 ! Our state-of-the-art algorithm is engineered to commence calculations from a robust dataset spanning 1500 bars from the current position . This meticulous approach ensures unparalleled accuracy and dependability in your trading endeavors. Experience the seamless integration of MentFX with MT5 , empowering you to analyze markets with precision and confidence. With Me
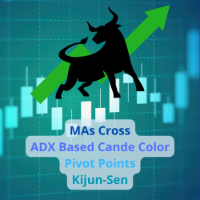
The set of most common indicators for day trading and long-term trading.
MAs Cross (Global Trend) ADX Based Candle Color (Local Trend) Pivot Points (Entry Levels) Kijun-Sen You can use this indicator in different ways, one of it is opening positions in trend direction on pivot points levels. Contact
If you have some questions or if you need help, contact me via Private Message.
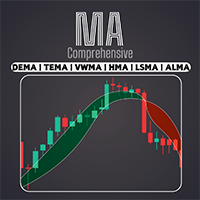
Greifen Sie mit unserem professionellen Comprehensive Moving Average -Indikator auf eine breite Palette gleitender Durchschnitte zu, darunter EMA, SMA, WMA und viele mehr. Passen Sie Ihre technische Analyse mit der perfekten Kombination von gleitenden Durchschnitten an Ihren individuellen Handelsstil an / MT4 Version
Merkmale
Möglichkeit, zwei MAs mit unterschiedlichen Einstellungen zu aktivieren. Möglichkeit zur Anpassung der Chart-Einstellungen. Möglichkeit, die Farbe der Candlesticks
FREE

Echtzeit-Multiwährungs-Volatilitätsscanner Hallo, Trader. Ich präsentiere Ihnen eine einzigartige Lösung: den Echtzeit-Multiwährungs-Volatilitätsscanner. Dieser Indikator ist eines der Ergebnisse meiner persönlichen Marktbeobachtung über viele Jahre hinweg. Er behandelt mehrere Schlüsselprobleme, mit denen Trader konfrontiert sind: Echtzeit-Volatilitätsverfolgung: Eliminiert die Notwendigkeit, ständig zu aktualisieren oder zwischen Diagrammen zu wechseln, um zu sehen, wo signifikante Bewegungen

Goldziele sind der beste Trendindikator. Der einzigartige Algorithmus des Indikators analysiert die Bewegung des Vermögenspreises unter Berücksichtigung von Faktoren der technischen und mathematischen Analyse, ermittelt die profitabelsten Einstiegspunkte, gibt ein Signal in Form eines Pfeils und des Preisniveaus (KAUF-Einstieg / VERKAUF-Einstieg) aus eine Bestellung eröffnen. Der Indikator zeigt außerdem sofort das Preisniveau für Stop Loss und fünf Preisniveaus für Take Profit an.
ACHTUNG:

Der Indikator zeigt eine bullische und bärische Divergenz. Der Indikator selbst (wie die normale Stochastik) wird in einem Unterfenster angezeigt. Grafische Oberfläche : Im Hauptfenster werden grafische Objekte „Trendlinie“ erstellt – vom „Tief“-Preis zum „Tief“-Preis (für bullische Divergenz) und vom „Hoch“-Preis zum „Hoch“-Preis (für bärische Divergenz). ). Der Indikator zeichnet sein Fenster ausschließlich mit grafischen Puffern: „Main“, „Signal“, „Dot“, „Buy“ und „Sell“. Die Puffer „Kauf“

Indikator zeigt „Unterstützungs“- und „Widerstands“-Linien (diese Linien werden mit dem Zeichenstil DRAW_LINE gezeichnet, d. h. sie sind keine grafischen Objekte). Links und rechts des „Signalbalkens“ wird nach neuen Minima und Maxima gesucht – der „Signalbalken“ ist die konventionelle Mitte jeder neuen Konstruktion. Warum ist das Wort „Flexibel“ im Namen des Indikators enthalten? Denn wir haben die Möglichkeit, eine unterschiedliche Anzahl an Balken links ('Left Bars') und rechts ('Right

Simplify your trading experience with Trend Signals Professional indicator. Easy trend recognition. Precise market enter and exit signals. Bollinger Bands trend confirmation support. ATR-based trend confirmation support. (By default this option is OFF to keep interface clean. You can turn it ON in indicator settings.) Easy to spot flat market conditions with ATR-based trend confirmation lines. Highly customizable settings. Fast and responsive. Note: Do not confuse ATR-based trend confirmation
FREE

What is MACD?
MACD is an acronym for Moving Average Convergence Divergence .
This technical indicator is a tool that’s used to identify moving averages that are indicating a new trend, whether it’s bullish or bearish.
There is a common misconception when it comes to the lines of the MACD.
There are two lines:
The " MACD Line " The " Signal Line "
The two lines that are drawn are NOT moving averages of the price.
The MACD Line is the difference (or distance) between two moving
FREE

Volume Horizon is a horizontal volume indicator that allows you to observe the density of market participants' volumes across various price and time intervals. Volume histograms can be constructed based on ascending or descending market waves, as well as individual bars. This tool enables more precise determination of entry or exit points, relying on levels of maximum volumes or volume-weighted average prices (VWAP).
What makes Volume Horizon unique? 1. Segmentation into ascending and descend
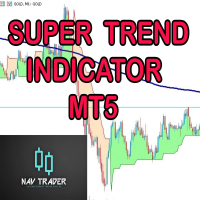
SUPERTREND; Es handelt sich um einen Trendfolgeindikator, der auf dem von Nav erstellten SuperTrend ATR basiert. Es kann verwendet werden, um Änderungen in der Trendrichtung zu erkennen und Stopps zu lokalisieren. Wenn der Preis unter die Indikatorkurve fällt, wird er rot und zeigt einen Abwärtstrend an. Wenn sich der Preis hingegen über die Kurve bewegt, wird der Indikator grün, was einen Aufwärtstrend anzeigt.
KAUF/VERKAUF-Signale;
Methode 1; Eine Standardstrategie mit einem einzelnen S

I present the well-known Moving Average indicator.
This indicator is presented as a channel, where the upper and lower lines are equidistant from the main line by a percentage set by the user.
The indicator is easy to use. The basic settings of the moving average have been saved and a percentage parameter (Channel%) has been added.
Basic parameters:
Channel% - shows how much we want to deviate from the main line.
The indicator is freely available.
FREE

Descubre el poderoso aliado que te guiará en el laberinto de los mercados financieros. Este indicador revolucionario te llevará de la incertidumbre a la claridad, permitiéndote identificar con precisión los puntos de inflexión del mercado. Mejora tus decisiones de entrada y salida, optimiza tus operaciones y ¡multiplica tus ganancias con confianza.
¡Para más información, te invitamos a unirte a nuestro canal de Telegram en https://t.me/Profit_Evolution ¡Allí encontrarás contenido exclusivo, a
FREE

Trend Shift is a very interesting trend indicator. The Trend Shift indicator helps you identify either a new or existing trend. One of the advantages of the indicator is that it quickly adjusts and reacts to various chart changes. Of course, this depends on the settings. The larger it is, the smoother the wave the trend line will be. The shorter the period, the more market noise will be taken into account when creating the indicator. The goal that was pursued during its creation is to obtain si

Graphic Shapes -using history, it projects four types of graphical shapes at the moment, allowing you to determine the main ranges of price movement in the future, as well as gives an understanding of the main market reversals, while giving entry points by priority!The panel contains three types of figure sizes expressed by timeframes. They allow you to conduct a complete market analysis without using additional tools! The indicator is a powerful tool for forecasting price movements in the forex

The Inversion Fair Value Gaps (IFVG) indicator is based on the inversion FVG concept by ICT and provides support and resistance zones based on mitigated Fair Value Gaps (FVGs). Image 1
USAGE Once mitigation of an FVG occurs, we detect the zone as an "Inverted FVG". This would now be looked upon for potential support or resistance.
Mitigation occurs when the price closes above or below the FVG area in the opposite direction of its bias. (Image 2)
Inverted Bullish FVGs Turn into P

To get access to MT4 version please click here . This is the exact conversion from TradingView: "Schaff Trend Cycle" by "everget". This is a light-load processing indicator. This is a non-repaint indicator. Buffers are available for processing in EAs. All input fields are available except fillings(due to graphical aesthetics). You can message in private chat for further changes you need. Thanks for downloading
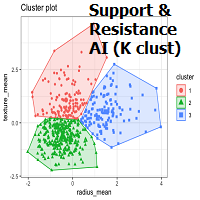
OVERVIEW
K-means is a clustering algorithm commonly used in machine learning to group data points into distinct clusters based on their similarities. While K-means is not typically used directly for identifying support and resistance levels in financial markets, it can serve as a tool in a broader analysis approach.
Support and resistance levels are price levels in financial markets where the price tends to react or reverse. Support is a level where the price tends to stop falling

Order Blocks are supply or demand zones in which big traders can find the comfort of placing large buy and sell orders and completing a big, very big transaction. Order blocks are a unique trading strategy that helps traders find a direction in the market. Usually, it allows traders to find out what financial institutions are planning to do in a particular market and better indicate the next price movement.

This indicator, named Edyx_Candle_Size, is designed to be used with the MetaTrader 5 trading platform. It displays the size of the candlestick body for the current timeframe as a histogram. The indicator does not provide any specific trading signals or recommendations
Measures the size of of the candlestick. That is the difference between the open and close as the case may be for either a bullish or a bearish candle. This can be use to filter out entry position as to maximise profit and minimi
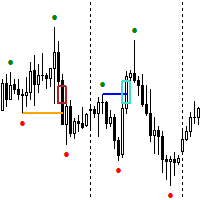
YouTube Channel: https://www.youtube.com/@trenddaytrader FREE EA for GOLD , M1 Gold Trader can be found here: https://www.mql5.com/en/market/product/120543
FREE EA for GOLD , ICT Kill Zone Trader can be found here: https://www.mql5.com/en/market/product/118262 The Expert Advisor for this Indicator can be found here: https://www.mql5.com/en/market/product/115476 The Break of Structure (BoS) and Change of Character indicator with Fair Value Gap (FVG) filter is a specialized tool des
FREE
Top Bottom Tracker ist ein auf hochentwickelten Algorithmen basierender Indikator, der den Markttrend analysiert und die Hochs und Tiefs des Trends erkennen kann / MT4 Version .
Der Preis wird schrittweise steigen, bis er 500$ erreicht. Nächster Preis --> $99
Eigenschaften Kein Repainting
Dieser Indikator ändert seine Werte nicht, wenn neue Daten eintreffen
Handelspaare
Alle Forex-Paare
Zeitrahmen
Alle Zeitrahmen
Parameter ==== Indikator-Konfiguration ====
Konfigurat
MetaTrader Market bietet jedem Entwickler eine einfache und bequeme Plattform für den Verkauf von Programmen.
Wir unterstützen Sie bei der Veröffentlichung des Produkts und beraten Sie gerne, wie man eine Beschreibung für den Market vorbereitet. Alle Produkte, die im Market verkauft werden, sind durch eine zusätzliche Verschlüsselung geschützt und können nur auf dem Rechner des Kunden gestartet werden. Illegales Kopieren ist ausgeschlossen.
Sie verpassen Handelsmöglichkeiten:
- Freie Handelsapplikationen
- Über 8.000 Signale zum Kopieren
- Wirtschaftsnachrichten für die Lage an den Finanzmärkte
Registrierung
Einloggen
Wenn Sie kein Benutzerkonto haben, registrieren Sie sich
Erlauben Sie die Verwendung von Cookies, um sich auf der Website MQL5.com anzumelden.
Bitte aktivieren Sie die notwendige Einstellung in Ihrem Browser, da Sie sich sonst nicht einloggen können.