Neue technische Indikatoren für den MetaTrader 5 - 38

Volatility Vision: Essential for Forex and Stock Markets
Entdecken Sie Volatility Vision: Ihre Handelsrevolution Perfekt für Anfänger und erfahrene Trader Einfache Startanleitung: Erfahren Sie, wie Sie es effektiv nutzen mit unserem Benutzerhandbuch .
Der Volatility Vision Indikator ist ein leistungsstarkes Werkzeug, das präzise Volatilitätsniveaus auf Ihren Charts abbildet. Dieses vielseitige Werkzeug ist unerlässlich für die Integration in Ihre Handelsstrategie und kompatibel mit allen Währ

Indicator developed by the Brazilian and analyst Odir Aguiar (Didi), consists of "Moving Averages", famously known as "Didi needles", where it allows the viewing of reversal points.
The concept is very simple, when you enter 3 Moving Averages on display, a period equal to 3, one equal to 8 and the other equal to 20, then the formation of the indicator that works in axis or line center equal to 0 (zero) appears. ). Moving averages must intersect when approaching line 0.
The scanner monitor
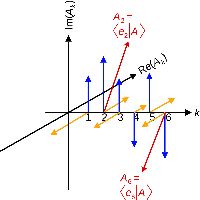
ComplexVectorHL is an indicator that characterizes the change in short-term market trends. The indicator is based on market analysis using the mathematical apparatus of complex numbers. The essence of the indicator is that it, with clear impulses, indicates the points in time when it is necessary to make decisions. The impulses are like a cardiogram showing the heartbeat of the market. The indicator has pulses only in one direction (unlike the previous development of ComplexVector), the pulses

HEIKEN PLUS is the only indicator you really need to be a successful trader , without in depth knowledge of the forex trading or any tools.
Also there is automatically trading EA available now: https://www.mql5.com/en/market/product/89517? with superb SL/TP management! and sky high profit targets !!!
Very suitable tool for new traders or advanced traders too. This is MT5 version. For MT4 version visit : https://www.mql5.com/en/market/product/85235?source=Site
HEIKEN+ is a combination o
The indicator plots the Up and Down arrows on every price swing made by the classic Zigzag indicator. When Zigzag makes a new swing low, a green arrow is plotted. Likewise, a red arrow is plotted when Zigzag makes a new swing high.
Features
Compared to the classic ZigZag, it marks the swing points more effectively. It helps to identify the forming chart patterns in advance. It comes with a Multi-Timeframe scanner which shows the Zigzag direction on each timeframe. All Metatrader alerts includ

This indicator shows the bullish/bearish market regime using the no. of bars moved above and below the overbought/oversold region of RSI. The green histogram depicts the Bull power, while the red depicts the Bear power.
Features
It can be used to enter new trades or validates trades from other strategies or indicators. It comes with a multi-timeframe scanner that scans the bulls/bears power across all the time frames. It's a perfect choice to boost the confidence of new traders via validatin
The indicator measures the buying and selling force between the buyers and sellers in the form of a histogram/oscillator by using a BOP equation:
BOP = Moving Average of [close – open)/(high – low)]
Igor Levshin first introduced the Balance of power in the August 2001 issue of Technical Analysis of Stocks & Commodities magazine.
Features
Quickly find the buying and selling pressure among the traders. It comes with simple inputs and an interface. All Metatrader alerts included.
Appli
SSL stands for Semaphore Signal Level channel. It consists of two moving averages applied to high and low, respectively, to form a price following envelope. Buy Signal: When the price closes above the higher moving average. Sell Signal: When the price closes below the lower moving average.
Features It comes with a multi-timeframe scanner that scans for the new signals across all the timeframes. A straightforward personal implementation of the classic SSL effortlessly finds the trend directio

Back to the Future это индикатор который определяет направление тренда. Определяет четыре уровня для роста и падения 1-й уровень флета 2 -й уровень коррекции 3-й уровень продолжения тренда и 4-й уровень возможного разворота. Индикатор рисует трендовые линии краткострочного и долгострочного тренда. Так же индикатор определяет динамические сел и бай зоны в виде прямоугольников. От ближайшего максимума или минимума рисует фибо уровни для определения целей движения. В меню индикатора отключа

It's a modified, and improved version of the classic HMA developed initially by Alan Hull in 2005. It uses a combination of three weighted moving averages to reduce the lag. Long Entry: When HMA turns blue from red with an upward slope. Short Entry: When HMA turns red from blue with a downward slope.
Features It comes with a multi-timeframe scanner which scans for the new signals across all the timeframes. HMA reduces lags which usually come with the traditional moving averages. Effectively

Numa folha qualquer
Eu desenho um sol amarelo
E com cinco ou seis retas
É fácil fazer um castelo
Corro o lápis em torno da mão e me dou uma luva
E se faço chover com dois riscos, tenho um guarda-chuva
Se um pinguinho de tinta
Cai num pedacinho azul do papel
Num instante imagino uma linda gaivota a voar no céu
Vai voando, contornando
A imensa curva norte-sul
Vou com ela viajando
Havai, Pequim ou Istambul
Pinto um barco à vela
Branco navegando
É tanto céu e mar num beijo azul
Entr
FREE
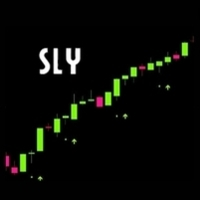
indicador para opciones binarias que siempre funciona en favor de la tendencia principal , por favor identifiquela en temporalidades altas para poder tomar operaciones en las temporalidades bajas , puede usar una media movil de cualquier periodo para identificarla , recomendada la de 50 periodos exponencial ideal para operar el mercado de indices sinteticos del broker deriv y/o divisas, se puede acompañar de cualquier oscilador usando unicamente el nivel 50 para validar tendencia alcista o baji

MASpeed ist ein universeller gleitender Durchschnitt mit einer Geschwindigkeitsanzeige. Punkte auf einer Linie erscheinen, wenn sich der Durchschnitt schneller als der Schwellenwert bewegt. Sie können den Schwellenwert in den Einstellungen festlegen. Auf der Grundlage dieses Indikators können Sie eine Vielzahl von Handelsstrategien erstellen. Der Indikator bietet enorme Möglichkeiten zur Anpassung des gleitenden Durchschnitts - 10 Arten von Glättung. 12 preisoptionen für den Aufbau. Es wurde die
FREE

DYJ ChameleonTrend arbeitet auf Basis von Trend Following und Counter Trend System. DYJ ChameleonTrend ist ein Indikator mit hoher Wahrscheinlichkeit. Dieser Indikator verwendet einen einzigartigen Mix-Indikator, der anspruchsvolle Indikator mit Benutzerdiskretion kombiniert. Dieser Indikator ist einer der fortschrittlichsten Ma Cross Adn ATR und Varianz Algorithmen. Der Indikator zeigt zwei farbige Richtungspfeile und Trend-Scrollbälle an, die die besten Entry- und Exit-Positionen für Trader a

Gleitender Durchschnitt des Entfernungspreises
Dies ist ein Indikator, der in Echtzeit den Abstand vom Preis zum gleitenden Durchschnitt berechnet.
Damit können Sie die maximale Abweichung des Preises vom gleitenden Durchschnitt in einem bestimmten, von Ihnen gewählten Zeitraum überwachen, beispielsweise die Distanz gemäß der maximalen Abweichung der letzten 30 Tage überwachen.
Es ist möglich, den Zeitraum und die Art des gleitenden Durchschnitts zu wählen.
Um es noch besser zu machen
FREE

The worktime indicator helps you identify the most important times to day to trade the currency pairs. It was created based on the ICT day trading free tutorials that are freely vailable on his youtube channel. You can use this indicator together with my other indicators that i have shared freely with you like the true day, custom periods, daily month, weekly open lines - they together complement each other very well.
Nuggets from this indicator: 1. Draws the asian session box showinng you th
FREE
The Higher timeframe candle tracker is used to get a glimpse of what the selected higher time frame candle is like. It plot the candle after the current price. It can come in handy for day traders and short term traders that often worry about how the current higher timeframe candle may look like. You can select the higher time frame or lower time frame from the options provided: By default the color for bears is red and for bulls is green. You are able to change the width of the candle, its wick
FREE
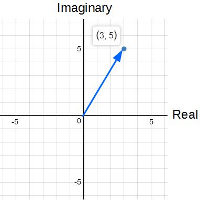
ComplexVector is an indicator based on market analysis using the mathematical apparatus of complex numbers. The essence of the indicator is that it, with clear impulses, indicates the points in time when it is necessary to make decisions. The impulses are like a cardiogram showing the heartbeat of the market.
For example: it may be the moment of planning a new entry. this may be the moment to exit the position. if you work with a series that is in a drawdown, you are recommended to close it i

Excellent tracking performance and minimal noise! This trend detection indicator that avoids whipsaws and uncertain market noise and is also agile enough to react to changes in trend.
It is also designed to adapt to dynamic markets.
Functions mainly as a filter to help you trade in the direction of the trend.
Features.
Simple and easy to use. Low load and easy to try out The excellent tracking performance and smooth lines that make it ideal for market analysis Can be used as a trend filter
FREE

The Outside The Box (OTB) is a complete trading system that provides the user with immense trading ability by highlighting on the chart areas where the trader should prepare to Re-enter the trend after pullbacks (Pullback trading strategy) Take partial/complete profit(Profit taking strategy), and Trade breakouts (Stock breakout strategy) - We have updated the indicator to show/hide Micro breakout areas around the major breakouts (Micro Breakouts). The above is supported by an alert system to no
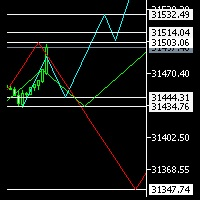
Hello Everyone ,
I am not an Elliot pro , but I promise to let you see it in a different way , have you ever considered to see 3 probabilities of different time frames on same chart ? this will not only enhance your trades entry , but will give you confidence and certainty when everything is not clear.
in my indicator you will be able to select 3 time frames of your choice , define number of candles per each time frame , give the color per each trend (Bearish or Bullish), not only that , yo

AIS MT5 INDICATOR 5 ALL INCLLUSIVE SET
GUIDE
CHAPTER 1 IMPORTANT INFORMATION <1> THIS INDICATOR IS ONE OF THE SERIES OF NEW AIS INDICATORS AIS MT5 INDICATOR 1 =ADVANCED CLASSIC= AIS MT5 INDICATOR 2 =MULTIFRAMES= AIS MT5 INDICATOR 3 =LINES= AIS MT5 INDICATOR 4 =MARKET PROFILES= AIS MT5 INDICATOR 5 =ALL INCLUSIVE SET
CHAPTER 2 GENERAL FEATURES OF THE SERIES
<1> AIS MT5 INDICATOR 1 =ADVANCED CLASSIC= < DEVELOPMENT PAUSED > DISPLAYS MAIN TIME POINTS AND PRICE LEVELS OF THE CHART

Volality 75 Fractal Scalper Non-repaint The arrows appear on the current candle. momentum and trend based strategy Works on all timeframes from the 1 Minute to the Monthly timeframe Bollinger bands have been added to show the trend direction whether its bullish or bearish Blue fractal arrow is your buy entry Orange fractal arrow is your sell entry you can use the Vix 75 fractal scalper in combination with other indicators.

Trend Panel ist ein einfaches, praktisches Tool, das eine bestätigte Trendrichtung der Zeitrahmen M1 - D1 unter Verwendung von zehn vom Benutzer ausgewählten Paaren anzeigt.
Der Indikator ist so konzipiert, dass er jeder Strategie/Vorlage eine Richtungsbestätigung hinzufügt und dann auch als saubere interaktive Schnittstelle funktioniert, um den Chart schnell auf ein anderes Paar oder einen anderen Zeitrahmen zu ändern. Gruppenchat: https://www.mql5.com/en/users/conorstephenson Bitte kontakt
FREE

Dieser Indikator verwendet die sogenannten "bösen" Zahlen als Gewichtskoeffizienten. Ihr Gegenteil sind "abscheuliche" Zahlen, die auch in diesem Indikator dargestellt werden. Die Unterteilung von Zahlen in diese beiden Klassen ist mit dem Hamming-Gewicht verbunden, das durch die Anzahl der Einheiten in der binären Schreibweise einer bestimmten Zahl bestimmt wird. Die Verwendung dieser Zahlen als Gewichtungsfaktoren ergibt einen Trendfolgeindikator. Darüber hinaus geben abscheuliche Zahlen eine

The indicator plots a trend channel using the technique by Gilbert Raff. The channel axis is a first-order regression. The upper and lower lines show the maximum distance the Close line had moved away from the axis line. Therefore, the upper and lower lines can be considered as resistance and support lines, respectively. A similar version of the indicator for the MT4 terminal
As a rule, most movements of the price occur within a channel, going beyond the support or resistance line only for a s
FREE

This indicator is very useful for day traders or short term traders. (MT5 version) No need to calculate the number of pips manually, just look at the chart and you will see the Virtual Take Profit / Virtual Stop Loss target line and evaluate whether the entry point is feasible to reach the intended target or not.
Enter the intended Take Profit / Stop Loss pips for your trade. The indicator will display Virtual Take Profit / Virtual Stop Loss lines for you to easily see if the target i
FREE

The idea of a Value Chart indicator was presented in the very good book I read back in 2020 , " Dynamic Trading Indicators: Winning with Value Charts and Price Action Profile ", from the authors Mark Helweg and David Stendahl. The idea is simple and the result is pure genius: Present candlestick Price analysis in a detrended way!
HOW TO READ THIS INDICATOR
Look for Overbought and Oversold levels. Of course, you will need to test the settings a lot to find the "correct" one for your approach.
FREE

Think of the Super Fractal Indicator as the Bill WIlliams Indicator on Steroids. Indicator Abilities: 1. Adjust Candle around Fractal High or Low. 2. Adjust Lookback period and only plot for a specific number of history candles avoiding cluttering your trading desk. 3. The Indicator uses buffers so you call and use it from any EA.
Note : The higher the candles around Fractal, the stronger the Turning point anfd viceversa is true.
FREE

The ADX indicator (average directional index) is a technical tool designed to measure the strength of a market trend. The ADX indicator is used for various purposes such as measuring the strength of a trend, finding a trend and a trading range, and as a filter for various Forex trading strategies.
Some of the best trading strategies are based on following the market trend. There are also strategies through which traders make profit by trading against the trend. In any case, if you can identif

The purpose of the inidcator is to identify the reversal point.
The blue arrow is buy signal and the yellow star is its stop loss. The red arrow is sell signal and the yellow star is its stop loss. Please note that the singal is against trend,it could be continual fail. Alert feature: if there is a signal, the indicator will send alerts of popup window,email or mobile push. Inputs: Popup Window Alert: it is false in default Email Alert : it is false in default Mobile Push Alert: it is false in

Very powerful indicator! converted from TradingView with upgraded alerts and added notifications. Ideal use in EAs.
Use as a supplementary Indicator to confirm your entries, but it is as good on it's own.
The indicator consists of 3 different Trend Meters and a 2 Trend Bars which are used to confirm trend
How to Use:
The more Trend meters are lit up the better =>>
-more GREEN COLOR at one bar means more confirmation to open buy trade,
- more RED COLOR signals for one bar = more

The Spots Indicator can be used for Entering and Exiting your trades based on the common candlestick patterns such as: engulfing, hanging man, doji etc. It is designed to publish desktop and mobile notification every time a signal is triggered. However, it is worth noting that this indicator is recommended to be used with other indicator for confirming the entries. It is best to use it with the Investment Castle Trend Lines indicator and the Supply and Demand indicator .
FREE

Indicator alerts for Dual Relative strength index rsi. Large rsi preset at 14 is below 30 small rsi preset at 4 is below 10 for buy bullish signals .
Large rsi preset are 14 is above 70 small rsi preset at 4 is above 90 for sell bearish signals . Includes mobile and terminal alerts. draws lines when alerts.
This indicator can help identify extremes and then the tops or bottoms of those extremes .
FREE

Funciona como bandas de bollinger normais. Criado por Joe Ross, é um setup de maior risco por ser contra-tendência. Pode ser usado para Day Trade, Swing Trade e Position. Para identificar, é necessário inserir no gráfico as Bandas de Bollinger, com uma Média Móvel Simples de 20 períodos e largura (desvio) 2. Verifica-se um fechamento de determinado candle abaixo da banda inferior de Bollinger. Se o próximo candle fechar dentro das Bandas, marca-se a máxima dele. O rompimento dessa máxima será o
FREE
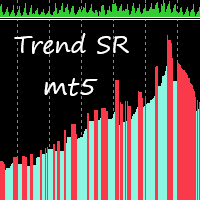
This indicator takes input from Support and Resistance levels, combined with a special trend filter. Easily spot tops and bottoms, and trade with more confidence. Great for scalping. This indicator can be used on all time frames and pairs. Features alert function.
No need to set up the indicator.
How to use: Simply attach to any chart. Zoom chart out completely. Red histogram line color = Selling opportunities. Blue histogram line color = Buying opportunities. See pictures below. To spot high
Tool converted from tradingview indicator. Modified version with pivot points calculated in a more intuitive way.
This tool displays relative volatility and directional trend. Excellent way to pickup diversions and reversals. Length can be lowered to 11 or 13 in settings to show price range.
Can be used to identify patterns such as parallel channels and likely direction of price action.
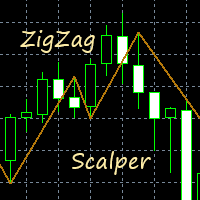
This indicator gives you a modified ZigZag, combined with a trend filter. Great for scalping. Perfect for channel trading. Features alert functions. No need to set up the indicator. How to use: Simply attach to any chart. Buy when the golden line stops below the price. Sell when the golden line stops above the price. It also helps to keep the audible alert set to true. Best results when checking two or more timeframes before entering trades on the lower time frames. Use as you see fit for your

Die Ebenen des zentralen Pivot-Bereichs werden um einen zentralen Pivot-Punkt herum gebildet.
Diese Niveaus in Bezug auf den zentralen Pivot können verwendet werden, um zahlreiche Marktverhalten und mögliche Ergebnisse zu bestimmen.
Die Entfernung vom zentralen Pivot und der Preis, den sich neue Niveaus im Verhältnis zu den Niveaus des Vortages bilden, können verwendet werden, um die Trendrichtung und -stärke der folgenden Tage zu bestimmen.
Central Pivot Ranges können als Unterstützung u
FREE

Institutionelle Ebenen / Bankebenen ... Psychologische Ebenen / Quartierstheorie.
Dieser Indikator zeichnet automatisch die Ebenen „000, 200, 500 und 800“, was ich als „institutionelle Ebenen“ kenne, ODER kann auch die Ebenen „000, 250, 500 und 750“ auf das Diagramm zeichnen.
Je nachdem, wo Sie den Handel auf institutioneller Ebene / die Theorie der Quartale gelernt haben, kennen Sie diese möglicherweise als unterschiedliche Namen. Die Kernidee besteht im Wesentlichen darin, dass diese Ebe
FREE

ROC Price Histogram Alert ist ein Momentum-basierter technischer Indikator, der die prozentuale Preisänderung zwischen dem aktuellen Preis und dem Preis vor einer bestimmten Anzahl von Perioden misst. ROC wird mit einem Histogramm gegen Null aufgetragen, wobei sich der Indikator nach oben in den positiven Bereich bewegt, wenn Preisänderungen nach oben gehen, und sich in den negativen Bereich bewegt, wenn Preisänderungen nach unten gehen.
Der Hauptschritt bei der Berechnung des ROC-Zeitraums i

Der TickCounter-Indikator zählt Aufwärts- und Abwärtsticks auf jedem neuen Balken.
Die Berechnung beginnt ab dem Moment, in dem der Indikator auf dem Chart platziert wird.
Histogrammbalken stellen dar: Gelbe Balken - Gesamtzahl der Ticks; Blaue Balken - Ticks UP; Rote Balken – Ticks NACH UNTEN. Wenn der blaue Balken nicht sichtbar ist, gibt es mehr Abwärtsticks und der rote Balken wird über dem blauen angezeigt (die rote Ebene befindet sich über der blauen). MT4 version: https://www.mql5.c

WA_PV_BOX_EFFORT X ERGEBNIS für MT5 Der WAPV Box Effort x Result Indicator ist Teil der Package Indicators-Gruppe (Wyckoff Academy Wave Market). Der WAPV Box Effort x Result Indicator für MT5 hilft Ihnen beim Lesen von Preis und Volumen. Seine Lektüre besteht darin, bei der Identifizierung von Aufwand x Ergebnis zu helfen in Wellen, die durch den Graphen erzeugt werden. Der WAPV Box Effort x Result Indicator für MT5 bedeutet, wenn das Kästchen grün ist, dass das Volumen der Nachfrage entspricht,

Der WAPV Price and Volume Indicator for MT5 ist Teil des Toolsets (Wyckoff Academy Wave Market) und (Wyckoff Academy Price and Volume). Der WAPV-Preis- und Volumenindikator für MT5 wurde entwickelt, um die Volumenbewegung auf dem Chart auf intuitive Weise einfach zu visualisieren. Damit können Sie die Momente des Spitzenvolumens und Momente beobachten, in denen der Markt kein professionelles Interesse hat Identifizieren Sie Momente, in denen sich der Markt durch Trägheit bewegt und nicht durch d

Der WAPV ADH Supply and Demand Indikator ist Teil einer Reihe von Indikatoren namens (Wyckoff Academy Wave Market) Der WAPV ADH Supply and Demand Indicator for MT5 soll die Gewinnerseite zwischen Käufern und Verkäufern identifizieren. Seine Lesung ist sehr einfach, wenn die grüne Linie über der roten Linie liegt, herrscht Nachfrage, wenn die rote Linie über der grünen Linie liegt, herrscht Versorgung. Je positiver die grünen und roten Linien, desto höher die Eingangslautstärke, je näher an Null

Der WAPV ADH Supply and Demand Forex Indicator ist Teil einer Reihe von Indikatoren namens (Wyckoff Academy Wave Market) Der WAPV ADH Forex Supply and Demand Indicator for MT5 soll die Gewinnerseite zwischen Käufern und Verkäufern identifizieren. Seine Lesung ist sehr einfach, wenn die grüne Linie über der roten Linie liegt, herrscht Nachfrage, wenn die rote Linie über der grünen Linie liegt, herrscht Versorgung. Je positiver die grünen und roten Linien, desto höher die Eingangslautstärke, je nä

Der Weis Wave Bouble Side Indicator für MT5 ist Teil des Toolkits (Wyckoff Academy Wave Market) Der Weis Wave Bouble Side Indicator für MT5 wurde basierend auf dem bereits etablierten Weis Wave von David Weis entwickelt. Der Weis Wave Double Side Indikator liest den Markt in Wellen, wie er gemacht wurde von R. Wyckoff im Jahr 1900. Es hilft bei der Identifizierung von Aufwand x Ergebnis, Ursache und Wirkung sowie Angebot und Nachfrage Sein Unterschied besteht darin, dass es unterhalb der Nullach

Der Weis Wave Bouble Side Indicator für MT5 ist Teil des Toolkits (Wyckoff Academy Wave Market) Der Weis Wave Bouble Side Indicator für MT5 wurde basierend auf dem bereits etablierten Weis Wave von David Weis entwickelt. Der Weis Wave Double Side Indikator liest den Markt in Wellen, wie es R. Wyckoff im Jahr 1900 tat. Es hilft bei der Identifizierung von Aufwand x Ergebnis, Ursache und Wirkung sowie Angebot und Nachfrage Sein Unterschied besteht darin, dass es unterhalb der Nullachse verwendet w

VSA Candle Signal für MT5 ist Teil des Toolsets (Preis und Volumen der Wyckoff Academy). Seine Funktion besteht darin, die Korrelation von Preis und Volumen bei der Bildung der Kerze zu identifizieren. Seine Erstellung basiert auf den Prämissen von R. Wyckoff , einem Vorläufer in der Analyse von Preis und Volumen. Das VSA-Kerzensignal für MT5 hilft bei der Entscheidungsfindung und hinterlässt Ihre Lektüre klarer und flüssiger. Siehe die Bilder unten.

Der Force and Weakness Indicator for MT5 Real Volume ist Teil des (Wyckoff Academy Price and Volume) Toolsets Der Force and Weakness Indicator for MT5 Real Volume wurde entwickelt, um die Stärke und Schwäche des Volumens auf kumulierte Weise zu identifizieren. Die Vision eines Panoramas zwischen Preis und Volumen ermöglichen. Der Indikator kann als Oszillator und als Histogramm verwendet werden. Als Fantasie hat es alle Prämissen der drei Gesetze von R. Wyckoff , wenn man es mit dem Preis kombin

Der Force and Weakness Indicator for MT5 Forex ist Teil des (Wyckoff Academy Price and Volume) Toolkits Der Force and Weakness Indicator for MT5 Forex wurde entwickelt, um die Stärke und Schwäche des Volumens auf kumulierte Weise zu identifizieren. Die Vision eines Panoramas zwischen Preis und Volumen ermöglichen. Der Indikator kann als Oszillator und als Histogramm verwendet werden. Wie üblich hat es alle Prämissen der drei Gesetze von R. Wyckoff, wenn es mit dem Preis kombiniert wird: Ursache

Resistance and Support is an easy to use indicator to apply horizontal lines of resistance and support. There are two windows for adding levels. When you press the button, a line appears on the price chart. It is possible to move this line with the mouse, thereby changing the indicator readings. In the indicator menu there is a choice of possible alerts - no alert, alert on touching the level and an alert for closing the candle after the level.
FREE

Everyone knows how to analyze the market , which level to buy / sell this is an easy job , which leads to unusual horrible loses , very little few people knows WHEN then enter the market , time is Money , this is the key!!!
This version is a Proof of concept limited version of ZamanCYcles founded here: https://www.mql5.com/en/market/product/81883?source=Site +Market+Product+Page This works Only on 3 Minutes Time frame for 45 Candles Get rest of planets and more than 10 other algorithms to pre
FREE

Andrew Pitch fork is one of the most interesting string trend & Channel & Fibo technical analysis , it's like ALL in ONE tool would be very enough for you.
FYI, This indicator will expire by end of July 2022.
Using 2 Andrew pitch Forks with 2 different time frames on same chart is really very hard working and might be impossible , but with this indicator is possible now , moreover , using this method as Candle Volume based analysis give strong trust for your trade.
I assume if you are hav
FREE

John Bollinger created this indicator in 2010 as a way to read the original indicator (Bollinger Bands) in a more "technical" way, shown as an oscillator. The typical range of the Bollinger Bands %B is 0 - 0.5 - 1.0, where "0" represents the lower band, the "0.5" the middle band, and "1" the upper band. The line on the indicator represents the Closing prices. As simple as that.
SETTINGS
Bollinger Bands period of analysis Standard Deviation multiplier Shift Price type to be analyzed
If you
FREE
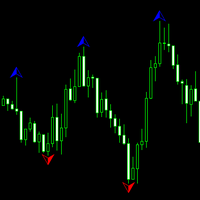
An indicator for all timeframes with a configurable number of bars for calculating fractals. Suitable for determining extremes of both lower and higher order, by which it is possible to determine the patterns of technical analysis, as well as divergences.
The indicator has one adjustable parameter - the number of bars for extremum calculation. It is also possible to change the color characteristics.

The idea behind this indicator is very simple , First it contains 2 mechanisms to place your trades:
1- Enter the Pips you want to duplicate to price levels. 2- Automatically let the indicator specify the largest Buy / Sell Volume Candle and place duplicated levels based on the candle itself.
How it works: 1- Enter the Pips you want to duplicate to price levels: 1- once the indicator is loaded you will need first to Specify the number of pips in the indicator Configuration window ,you can

A ideia do indicador é mudar de cores assim que o candle viole a banda; Caso o candle viole a banda superior, pinta o candle de vermelho, Caso o candle viole a banda inferior , pinta o candle de verde, Se o candle passar em algum momento pela média, ele assume uma cor acinzentada; Os candles que não passem pela média, nem violem a banda, apresentarão cor verde fraca, se for de alta e cor vermelha fraca se for de baixa. Projeto concebido no canal Aprenda a programar, keltner cores.
FREE

I always wondered if I can have multiple time frame Moving average on same chart , it is not possible , now with my Indicator is possible , As you know Moving average is lagging not leading indicator , but how can I predict future levels of it ?
I came with this idea , I hope you will like it , I made a Mirror of Moving average , the other side of specific time will be shown in the other side of the chart where the price didnt reach yet , that will help you to know the levels you can start sel
FREE
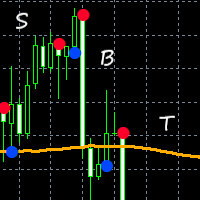
This indicator combines input from two trend filters and the ADX. You can change the trend line on chart to your preference. Great for scalping and channels. Features alert function and parameter TrendLinePeriod.
How to use: Simply attach to any chart. Sell on red bullets, with trend line above price. Enter on bullets closest to this line. Buy on blue bullets, with trend line below price. Enter on bullets closest to this line. Best results when checking the higher time frames before entering t

Ichimoku Trend Finder is a multi symbol multi timeframe trend dashboard that helps traders to monitor and identify potential market trends from one chart. This panel scans the Ichimoku Kinko Hyo indicator in 28 configurable instruments and 9 timeframes for classic Ichimoku trend signals with a deep scan feature to scan all market watch symbols (up to 1000 instruments!).
Download Demo here (Scans only M1 and M6) Settings description here MT4 version here
After the purchase, don't fo
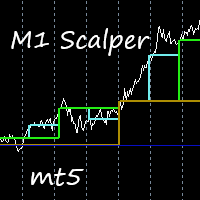
This indicator is excellent for scalping on the M1 or M5 chart. Uses a special algorithm for the lines. No need to set up the indicator. Does not feature any alerts and is best used manually after visually confirming the line displays. NB: Make sure to download M1 history before testing and use.
How to use: Simply attach to M1 or M5 chart. Zoom chart out completely. Sell when all lines above the white line (PriceLine). Sniper line crosses above white line. Buy when all lines below the white li

This indicator gives you arrows, two SR lines and a golden trend line. Uses a special trend algorithm to plot the arrows, combined with support and resistance inputs. Perfect for channel trading. Features alert functions.
Parameter TrendArrowPeriod. Parameter TrendLinePeriod. (Change to your preference) How to use: Simply attach to any chart with default settings. Zoom in the chart, to see the two blue SR lines and arrows more clearly. When the blue SR line is below the price, golden trend line

The Price Elevator indicator is developed to help you figure out the general long-term trend of the market. If the price is above the Green separator line, this is a clear indication the bulls are in control. Similarly, the bears are in control if the price continues to trend below the red separator line. Download Price Elevator MT4
Trend Re-entry In this case you would plan your buy entries above the green dotted box (make sure to set the Buy / Sell Retracement Floor=30). The SL should be

Nehmen Sie am Handel mit dem WolfeWaveBuilder-Indikator teil! Dies ist ein einzigartiges Tool, das speziell dafür entwickelt wurde, die erfolgreichsten und profitabelsten Investitionsentscheidungen zu treffen. Es ist ideal für Live-Konten und profitiert von einer gründlich getesteten und praktisch garantierten Handelsstrategie. Verpassen Sie nicht Ihre Gelegenheit! Fangen Sie an, mit dem WolfeWaveBuilder-Indikator Geld zu verdienen!
MT5-Version https://www.mql5.com/ru/market/product/8920
In
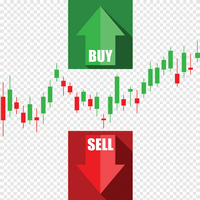
Dieser Indikator verwendet lokale Hochs und Tiefs der Preisreihe. Nach dem Hervorheben der Extrema werden ihre Werte geglättet. Dadurch werden zwei Kanäle aufgebaut - extern und intern. Der interne Kanal zeigt die Grenzen, wenn die Preisbewegung strikt einem linearen Trend folgt. Der äußere Kanal zeigt die Grenzen für die Preisbewegung mit einem logarithmischen Trend. Nach der Berechnung der Kanäle analysiert der Indikator die tatsächliche Preisbewegung und bietet Empfehlungen zum Öffnen und Sc

MetaBands verwendet leistungsstarke und einzigartige Algorithmen, um Kanäle zu zeichnen und Trends zu erkennen, sodass es Tradern potenzielle Punkte für den Einstieg und Ausstieg aus Trades bieten kann. Es ist ein Kanalindikator sowie ein leistungsstarker Trendindikator. Es umfasst verschiedene Arten von Kanälen, die einfach durch Verwendung der Eingabeparameter zusammengeführt werden können. MetaBands verwendet alle Arten von Warnmeldungen, um Benutzer über Marktereignisse zu informieren. Funkt

Wasserzeichen zentralisiert
Fügt ein Wasserzeichen hinzu, das mit dem Asset-Namen und dem ausgewählten Zeitraum zentriert ist.
Schriftart, Schriftgröße, Schriftfarbe und Trennzeichen können überschrieben werden.
Das Wasserzeichen wird hinter den Kerzen positioniert und stört die Visualisierung nicht.
Es hat eine automatische Neuzentrierung, wenn die Größe des Fensters geändert wird.
Ich hoffe, dieser Indikator hilft Ihnen, gutes Trading ;)
FREE

Demand and supply zones Support and Resistance areas Show broken zones Show tested and untested zones Show weak zones Fractal factors Notifications when price reaches point of Interest with Push notifications and pop ups Customizable History Clickable Works on all Timeframes Works on all pairs.
Free for a while till further notice and changes. The demand and supply bot coming soon
FREE

The Market Entropy indicator was created to measure the order of price changes over time. consists of two lines and a histogram where the lines are responsible for measuring the price movement and the histogram measures the strength of the analyzed movement. It can be used to find a trend (Image 2) or price reversal (Image 3).
Blue Line: Buy Entropy Red Line: Sell Entropy Historgram: Market Entropy
Interpretation: Buy Line above the Sell Line indicates that in the analyzed period buyers wer
Ist Ihnen bekannt, warum der MetaTrader Market die beste Plattform für den Verkauf von Handelsstrategien und technischer Indikatoren ist? Der Entwickler braucht sich nicht mit Werbung, Programmschutz und Abrechnung mit Kunden zu beschäftigen. Alles ist bereits erledigt.
Sie verpassen Handelsmöglichkeiten:
- Freie Handelsapplikationen
- Über 8.000 Signale zum Kopieren
- Wirtschaftsnachrichten für die Lage an den Finanzmärkte
Registrierung
Einloggen
Wenn Sie kein Benutzerkonto haben, registrieren Sie sich
Erlauben Sie die Verwendung von Cookies, um sich auf der Website MQL5.com anzumelden.
Bitte aktivieren Sie die notwendige Einstellung in Ihrem Browser, da Sie sich sonst nicht einloggen können.