Neue technische Indikatoren für den MetaTrader 5 - 22

Channel Vertex is a price action pattern formed by price Chanel and a triangle pattern . Price channels basically indicates possible support and resistance zones around a price movement and retracement or breakout at these levels can indicate possible trend continuation or reversal .
Majority of the times price fluctuations forms triangle patterns defined by 3 vertexes , these triangle patterns most times defines a trend continuation. A triangle pattern is a trend continuation pattern that
The VSA Scanner Dashboard is a multi-symbol, multi-timeframe scanner that displays VSA signals. It is based on the Volume Plus and VSA Signals indicator. Features Displays the VSA signal of the last closed candle. Monitors 28 customizable instruments (symbols) and up to 21 timeframes at the same time. Easily arrange symbols in any order. Each signal has a tooltip that displays the name and time of appearance. Click on each signal to open a new chart. All types of alerts (sound, pop-up, email,
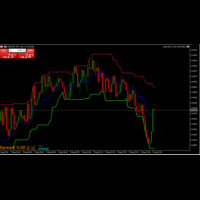
The Donchian Channel Indicator I created is a powerful tool for analyzing price trends and volatility. By plotting the highest high and lowest low over a specified period, it helps identify potential breakout opportunities and trend reversals. This indicator is valuable for traders seeking to understand market dynamics and make informed decisions based on price movements. Its simplicity and effectiveness make it an essential addition to any trading strategy.
FREE
You can use the indicator in trend following to detect trend changes. Each color change is a trading signal. It should be used on at least 1 hour charts. It is recommended to use it on 1-day charts. However, it should be noted that the number of meaningful candles (without gap) on your chart should be at least 80.
The calculation method is based on ATR, MA and CCI indicators. However, for a significant part of the calculation I have developed my own algorithm based on standard deviation and re

Fractals Aydmaxx 2024 Overview: Fractals Aydmaxx 2024 is a custom indicator designed for the MQL5 trading platform, developed by Aydmaxx. This indicator identifies and displays fractal patterns on your trading chart, which are essential for recognizing potential market reversals. The indicator highlights both bull and bear fractals, making it easier for traders to spot key levels of support and resistance. Features: Customizable Fractals: Allows the user to set the number of bars on the left and
FREE
Darvas Flow Indicator is a revolutionary trading indicator that combines the classic Darvas Box method with modern market flow analysis. Developed for serious traders, Darvas Flow offers a powerful and intuitive tool for identifying trading opportunities. Key Features:
Darvas Box Method Implementation: Darvas Flow automatically identifies Darvas boxes, allowing you to see crucial support and resistance levels. This helps in pinpointing optimal entry and exit points in your trades. Dynamic Flow
FREE
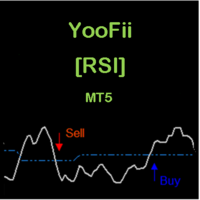
CONSTITUTION YooFii [RSI] is an indicator consisting of an oscillator and three dynamic levels. The oscillator, dynamic levels and warning signals can be adjusted via the inputs. It is designed for the MT5 platform only. APPLICATION This indicator should be used with a trend filter [for FOREX you can use the Currency Strength Meter; for CDF's you can use two moving averages (MA 200 and MA 55)]. With the trend already determined, through Yoofii [RSI] we detect points of exhaustion of correction m
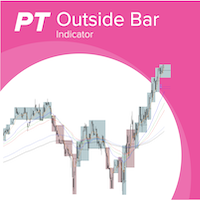
Aussenstab are important in professional price action trading and were made popular by Michael Voigt. Highs and lows of outside bars ( Aussenstäbe ) can be utilized as entry and exit for trades following different strategies. Examples for strategies with inside/outside bars are Reversal Trend continuation Breakout Ranges This indicator allows to displays outside bars on the current and configurable higher timeframes. E.g. you can display the M5 outside bars on a M1 timeframe to see the bigg

Average Session Range: Calculate and Average the Sessions High-Low Range of Specific Time Sessions Over Multiple Days. The Session Average Range is a sophisticated and precise tool designed to calculate the volatility of specific time sessions within the trading day. By meticulously analyzing the range between the high and low prices of a defined trading session over multiple days, this tool provides traders with a clear and actionable average range. **Note:** When the trading platform is closed
FREE
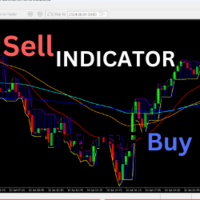
Welcome to a highly versatile and customizable trading indicator designed to elevate your trading strategy. This indicator integrates four moving averages (MAs) and order blocks, providing you with a powerful tool for market analysis and decision-making. Key Features: Four Moving Averages (MAs): This indicator allows you to utilize up to four different moving averages simultaneously. You can adjust each MA's period, color, and style to tailor the indicator to your specific trading needs. Whether
FREE
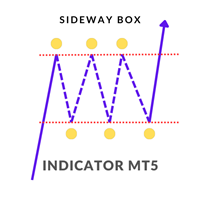
Sideway Box Indicator
The Sideway Box Indicator is an advanced trading tool designed to help traders identify and capitalize on sideways market conditions. This powerful indicator detects periods when the market is in a sideways (ranging) phase, providing traders with clear visual cues. Key Features
Sideways Market Detection : The Sideway Box Indicator accurately identifies sideways market conditions, allowing traders to recognize when the price is consolidating within a specific range. Buy/Sel

DTFX Algo Zones are auto-generated Fibonacci Retracements based on market structure shifts.
These retracement levels are intended to be used as support and resistance levels to look for price to bounce off of to confirm direction.
USAGE Figure 1 Due to the retracement levels only being generated from identified market structure shifts, the retracements are confined to only draw from areas considered more important due to the technical Break of Structure (BOS) or Change of Character (CHo

This indicator/dashboard , is place on a single symbol. It shows the percentage of movement withing all time frames from M1 to W1.The text will change green if all % are in the positive for a buy signal.The text will change red if all % are below zero and in negative for a sell signal. There are audible notifications, as well as on screen notifications along with push notifications that can be turned on and ON/OFF in the settings.
This is a sure way to Find trends quickly and efficiently, with

Introducing the BOOM CRASH MASTER Indicator: Unleash the Power of Precision Trading! Step into the world of unparalleled trading with the BOOM CRASH Master Indicator, exclusively designed for the Boom and Crash indices offered by Deriv broker. This cutting-edge tool is your gateway to mastering the art of spike detection and anti-spike entries, ensuring you stay ahead of the market’s every move. Recommendations: Symbols: Any Boom or Crash Index
Timeframe: 1 minute / 5 minutes
Stop Loss: Recent

This MQL5 Speed Indicator script calculates the average speed of price movements for a selected financial instrument over a specified period. It uses the arithmetic mean to determine the average speed, which is computed by dividing the distance (change in price) by the time interval. The indicator then displays this value as a histogram in a separate window. Average Speed Calculation : The speed is calculated using the formula v = d t v = \frac{d}{t} v = t d , where d d d is the price differen
The "Order Block Indicator for MetaTrader 5" is an advanced trading tool designed to help traders identify key order block zones in the financial markets. Order blocks are areas of institutional buying and selling, often marking significant price levels where market reversals or continuations are likely to occur. This indicator provides a visual representation of these zones directly on the chart, enabling traders to make more informed trading decisions. Key Features: Accurate Order Block Identi
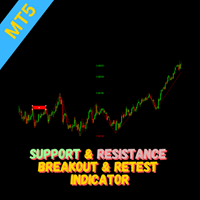
Overview The Breakout and Retest indicator is designed to identify potential trading opportunities by detecting price breakouts from significant support and resistance levels followed by a retest of the broken level. How it Works The indicator analyzes price data to determine key support and resistance areas. When the price decisively breaks through one of these levels and then retest it, then a potential breakout is signaled when it breakout again. To increase the probability of a successful t

Price and Spread Indicator
Version: 1.0 Developer: Creative Tech Solutions Website: https://www.creativetechsolutions.co.uk
Overview The Price and Spread Indicator is a great tool for MetaTrader 5 that displays the Ask and Bid prices along with the spread directly on the chart. This indicator provides real-time updates and allows traders to make informed decisions based on accurate price information.
Features - Real-time Price Updates: Continuously updates Ask and Bid prices. - Spread Disp
FREE
MT5用 サブウィンドウにスプレッドとBUY SWAP(BS)とSELL SWAP(SS)を表示するインジケーターです。
表示の文字フォントの大きさと色の設定、スプレッドの表示をPIPS表示もしくはPOINTS表示切替が可能ですので、チャートの色設定などに合わせて、お好みでご利用いただけます。 サブウィンドウの表示サイズに合わせて、その中央に表示するようになっています。
(ご協力お願いします!) こちらは無料でご利用いただけます。どうぞご自由にご利用ください。 もしよければ MS High Low indicator も紹介していますので、どうぞご参照の上、DEMO版のダウンロードをお試しください!
Happy Trading :)
FREE
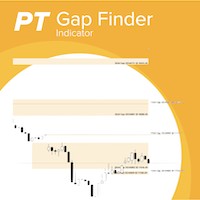
With the gaps finder indicator gaps between trading session are automatically added to you chart and you will never miss a gap which you can use in your trading strategies. Gaps often act as a magnet where the markets returns to or when a gap is closed often constitutes a reversal point.You don't have to draw manually gaps anymore. Key Features: Support for multiple trading sessions in a single chart, e.g market session and future session Configurable number of days to look back for gaps Highly

Elder Impulse Indicator Overview: The Elder Impulse Indicator is a powerful tool designed for traders who want to combine the strengths of trend-following and momentum strategies. Developed by Dr. Alexander Elder, this indicator helps traders identify potential entry and exit points by analyzing both price direction and momentum. It’s an essential tool for making informed decisions in various market conditions, whether you're trend-trading, swing trading, or looking for momentum shifts. Key Fea
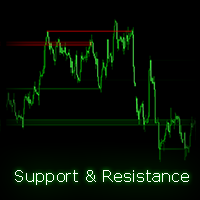
Dieser Indikator findet und plottet automatisch Support- und Widerstandskanäle auf Ihrem Chart, um wichtige Level einfach zu identifizieren. Der Indikator unterstützt mehrere Zeitrahmen, sodass Sie Kanäle aus verschiedenen Zeitrahmen auf Ihrem aktuellen Chart anzeigen können. Darüber hinaus bietet er transparente Farben für verbesserte visuelle Klarheit und ermöglicht es Ihnen, die Farben der Kanäle nach Ihren Wünschen anzupassen. Wie funktioniert dieser Indikator? Der Indikator findet Schwingun
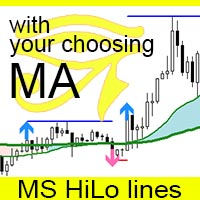
The MS High Low Lines indicator is a tool designed to enhance trend visualization for MT5. It displays high and low prices as lines, using your preferred Moving Average (MA) settings (either SMA or EMA, with customizable periods). The indicator shows configured signals when prices break above or below these MAs. By setting it up with highly functional MAs, traders can better understand market trends and make trades with a statistical edge. You can modify settings and place multiple indicators o

SolarTrade Suite Finanzindikator: Jupiter Market Indicator – Ihr zuverlässiger Führer in der Welt der Finanzmärkte!
Dies ist ein Trendindikator, der spezielle innovative und fortschrittliche Algorithmen zur Berechnung seines Wertes verwendet und zudem ein ansprechendes Design aufweist.
Die Messwerte dieses Indikators sind sehr leicht zu verstehen: Blau – Kaufen, Rot – Verkaufen.
Sehen Sie sich unsere anderen Produkte aus der SolarTrade Suite-Reihe am Ende der Beschreibung an.
Möchten Sie si

SolarTrade Suite Finanzindikator: Saturn Market Indicator – Ihr zuverlässiger Führer in der Welt der Finanzmärkte!
Dies ist ein Preiskanalindikator, der spezielle innovative und fortschrittliche Algorithmen zur Berechnung seines Wertes verwendet und zudem ein ansprechendes Design aufweist.
Das Verstehen der Messwerte dieses Indikators ist sehr einfach: Handeln Sie von den Grenzen aus sowohl bei einem Ausbruch als auch bei einem Rebound.
Sehen Sie sich unsere anderen Produkte aus der SolarTra

Finanzindikator SolarTrade Suite: Uranus Market Indicator – Ihr zuverlässiger Führer in der Welt der Finanzmärkte! Unser Forex-Handelsprogramm ist mit einer leistungsstarken künstlichen Intelligenz ausgestattet, die Marktdaten in Echtzeit analysiert. Es sagt Preisbewegungen genau voraus und hilft Händlern, fundierte Entscheidungen zu treffen. Mit fortschrittlichen Algorithmen optimiert unser Indikator Strategien und minimiert Risiken für Händler. Dies sind zwei gleitende Durchschnitte, die spez

Finanzindikator SolarTrade Suite: Neptune Market Indicator – Ihr zuverlässiger Führer in der Welt der Finanzmärkte! Unser Forex-Handelsprogramm ist mit einer leistungsstarken künstlichen Intelligenz ausgestattet, die Marktdaten in Echtzeit analysiert. Es sagt Preisbewegungen genau voraus und hilft Händlern, fundierte Entscheidungen zu treffen. Mit fortschrittlichen Algorithmen optimiert unser Indikator Strategien und minimiert Risiken für Händler. Dies sind sechs gleitende Durchschnitte, die sp

SolarTrade Suite Finanzindikator: Venus Market Indicator – Ihr zuverlässiger Führer in der Welt der Finanzmärkte! Unser Forex-Handelsprogramm ist mit einer leistungsstarken künstlichen Intelligenz ausgestattet, die Marktdaten in Echtzeit analysiert. Es sagt Preisbewegungen genau voraus und hilft Händlern, fundierte Entscheidungen zu treffen. Mit fortschrittlichen Algorithmen optimiert unser Indikator Strategien und minimiert Risiken für Händler. Dies ist ein Oszillator, der spezielle innovative

Finanzindikator SolarTrade Suite: Mars Market Indicator – Ihr zuverlässiger Führer in der Welt der Finanzmärkte! Unser Forex-Handelsprogramm ist mit einer leistungsstarken künstlichen Intelligenz ausgestattet, die Marktdaten in Echtzeit analysiert. Es sagt Preisbewegungen genau voraus und hilft Händlern, fundierte Entscheidungen zu treffen. Mit fortschrittlichen Algorithmen optimiert unser Indikator Strategien und minimiert Risiken für Händler. Dies ist ein Oszillator, der spezielle innovative
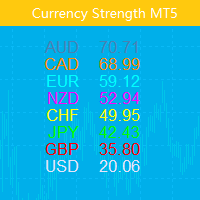
Dieser Indikator zeigt die relative Stärke von acht Hauptwährungen (USD, EUR, GBP, AUD, NZD, CAD, CHF, JPY). Kraftwerte werden im Bereich von 0 bis 100 normalisiert. Werte über 60 bedeuten stark. Ein Wert unter 40 deutet auf Schwäche hin.
Fahrkarte Only Show Current Pair - Bei „true“ wird nur das aktuelle Diagrammpaar angezeigt. Ansonsten werden alle acht Kurven angezeigt. Bars To Show – Anzahl der Balken zur Anzeige der Kraftkurve. Ma Periods To Smooth Curves : Gleitende Durch

Für einen kostenlosen Download, treten Sie unserer Gruppe bei. Begrenztes Angebot! Überblick: Erkennen Sie die stärksten Währungen auf einen Blick mit dem Currency Strength Chart für MetaTrader 5. Dieser leistungsstarke Indikator bietet eine klare, visuelle Darstellung der relativen Stärke der wichtigsten Währungen über die letzten 30 Tage, sodass Sie fundiertere Handelsentscheidungen treffen können. Hauptmerkmale: 30-tägige Vergleichsanalyse: Vergleichen Sie die Stärke jeder Hauptwährung über e

Für einen kostenlosen Download, treten Sie unserer Gruppe bei. Angebot für begrenzte Zeit! Wir stellen unser innovatives MQL5-Indikator vor, das entwickelt wurde, um Ihr Handelserlebnis zu verbessern, indem es klare visuelle Hinweise auf die täglichen Kerzengrenzen in niedrigeren Zeitrahmen bietet. Dieses Tool ist perfekt für Trader, die über den Fortschritt der täglichen Kerze informiert bleiben möchten, um bessere Entscheidungen zu treffen und Strategien zu implementieren. Hauptmerkmale Visual

VolaMetrics VSA | Ein Mächtiger Verbündeter in der Technischen Analyse Der VolaMetrics VSA ist ein technischer Analyseindikator, der die Volume Spread Analysis (VSA) Methode mit einer detaillierten Analyse des Handelsvolumens kombiniert. Entwickelt, um signifikante Preisbewegungen zu identifizieren und zu verfolgen , nutzt der VolaMetrics VSA die Interaktion zwischen Volumen und Preisspread , um wertvolle Einblicke zu bieten, die bei Handelsentscheidungen unterstützen können. Grundlagen der V

** All Symbols x All Timeframes scan just by pressing scanner button ** *** Contact me to send you instruction and add you in "Head & Shoulders Scanner group" for sharing or seeing experiences with other users. Introduction: Head and Shoulders Pattern is a very repetitive common type of price reversal patterns. The pattern appears on all time frames and can be used by all types of traders and investors. The Head and Shoulders Scanner indicator Scans All charts just by pressing

The ICT Immediate Rebalance Toolkit is a comprehensive suite of tools crafted to aid traders in pinpointing crucial trading zones and patterns within the market.
The ICT Immediate Rebalance, although frequently overlooked, emerges as one of ICT's most influential concepts, particularly when considered within a specific context. The toolkit integrates commonly used price action tools to be utilized in conjunction with the Immediate Rebalance patterns, enriching the capacity to discern conte

Candle Time CountDown By BokaroTraderFx The Candle Timer Countdown Indicator is a versatile tool designed for the MetaTrader 5 (MT5) trading platform. It provides traders with a visual countdown of the remaining time for the current candle on a chart. The key features include:
Customizable Position: Place the countdown timer in any corner of the chart for optimal visibility. Default Text Color: Set to red for clear visibility, with options for further customization. Minimal Display: Shows only
FREE

Balanced Work Indicator: Your Gateway to Trend Trading Balanced Work is a trend-following indicator designed to simplify market analysis and trading decisions. This algorithmic tool draws two-colored dots along the price chart, connected by lines, offering a clear visual representation of market trends. The simplicity of this indicator lies in its color-coded signals: buy when a blue dot appears and sell when a red dot appears. It is particularly effective for scalping and pipsing, and it has p
Amazing RSI + ATR Dashboard Indicators are useful for traders, but when you put them into a dashboard and can scan 28 symbols at once they become even better, and when you can also combine different indicators and timeframes to give you synchronized alerts they become awesome. When this product gets 20 reviews I will add another indcator free to this dashboard as a thank you. This easy to use dashboard provides you with the RSI and ATR indicators, use them individually or together to create p
FREE
Optimized for Asia- London- US- Open-Session true Momentum - time-based Indicator
Filter
Daytime Weekdays Moving Averages Keltner-Channel MACD Advantages Optimised for Asia- London- US- Open-Session choose your personal times to trade - select Daytime and Weekdays Keltner-Channel => to reduce market noise - sideways movement will be hidden 3x Moving Averages => for the Trend, including Price MACD fits best with Trend MA Candles Signal after close - no repaint Alerts
Email Screen-A
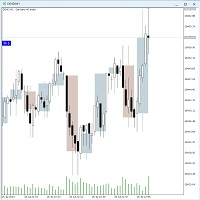
Der Twotimeframe-Candles (RFrame) - Indikator für MT5 zeigt die Kerzen eines höheren Zeitrahmens als Overlay auf dem aktuellen Zeitrahmen.
Sie können die Anzahl der Candles und die Farbe der Overlays wählen.
Der Indikator berechnet die aktuelle Kerze bei jedem Tick.
Wenn Ihnen der Indikator gefällt, hinterlassen Sie bitte einen Kommentar. Version 1.1: Der zweite Timeframe kann jetzt eingestellt werden.
Stichwörter: Candlestick, Multitimeframe, Two Timeframes
FREE
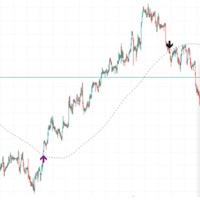
If the price is cutting above the slow length moving average, a breakout may occur. If the price is cutting below, a pullback may occur in the market. This was known for a long time, but there aren't many indicators which signal on the event. Candlestick pattern validation is also used in this indicator so that signals will not be drawn on doji candles or small "uncertainty" candles. The length of the moving average period can be defined by the user (default is 200). The number of price movement
FREE
CLICK HERE TO JOIN OUR WHATSAPP GROUP.
This trading indicator Automatically identifies and plots contract blocks, which are essential zones marked by significant levels of support and resistance. This powerful tool provides traders with a clear and intuitive visualization of critical market points where prices are likely to bounce or reverse. The contract blocks, represented by distinct colored rectangles, highlight support zones (at the bottom) and resistance zones (at the top), enabling trad
FREE
A simple indicator for plotting a tick chart.
This indicator will allow you to track the spread dynamics and the price behavior in general.
In the settings, you can select the price to display on the chart - Bid, Ask or both prices at the same time.
Tick Chart Indicator will definitely be useful when using scalping strategies. The MT4 version is available here . Good luck to everyone and successful trading!
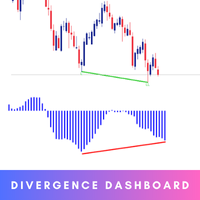
The Smart Divergence Dashboard is your ultimate tool for identifying high-probability trading opportunities. This cutting-edge indicator is meticulously designed to detect Regular Divergences, offering traders a clear and actionable advantage. MT4 Version - https://www.mql5.com/en/market/product/120702/ Key Features: Real-time Divergence Detection: Instantly pinpoints Higher High/Lower Low and Oscillator Higher Low divergences across multiple currency pairs and timeframes using Awesome Os
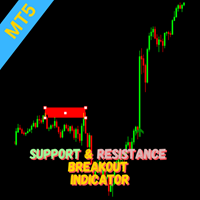
Indicator Overview This indicator utilizes the Zigzag indicator to identify potential support and resistance levels. When the price action breaks through one of these levels, a trading signal is generated. How it Works The Zigzag indicator is employed to pinpoint significant price highs and lows, forming potential support and resistance areas. A signal is triggered when the current candle closes beyond a previously established support or resistance level. Traders can consider entering a position
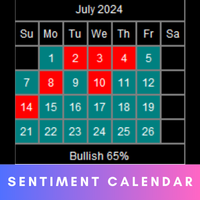
The Market Sentiment calendar provides a visual representation of market sentiment for each day or month. It will display daily and monthly BIAS . The calendar also highlights the percentage of bullish days or months within a given month or year. MT4 version - https://www.mql5.com/en/market/product/120767/ Inputs Frequency: Choose between "Daily" and "Monthly" calendar views. Sentiment Method: Select the method to determine daily or monthly sentiment: " L inear Regression ", " Accumu

The trendlines with breaks indicator return pivot point based trendlines with highlighted breakouts. Users can control the steepness of the trendlines as well as their slope calculation method.
Trendline breakouts occur in real-time and are not subject to backpainting. Trendlines can however be subject to repainting unless turned off from the user settings.
The indicator includes integrated alerts for trendline breakouts. Any valid trendlines methodology can be used with the indicator, users
Introducing the Gold Market Arrow Indicator, specifically designed for the 15-minute chart. This advanced tool provides clear and actionable buy and sell arrows, enabling traders to make timely and informed decisions in the gold market. Whether you're a seasoned trader or a novice, our indicator simplifies complex market data into straightforward signals, ensuring you never miss an opportunity to capitalize on gold price movements." This indicator works with a custom build in strategy The indic
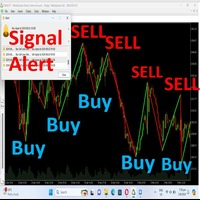
Hello Traders, *-For your bonus one indicator with SL,TP zone* just give your review, comment.Once finish developing I will give you**** Trend identification Indicator This is a indicator that will identify trend zone as bearish and bullish zone . This indicator can use for all pairs and any timeframe you can use it . *Green lime mean buy.Red line mean sell.You will receive alert sound when signal generate. The create best on high, low point and moving average calculation. You can customize valu

Description of the Indicator Trend Stop shows the highest/lowest value of the last N periods. Can help traders identify the trend direction and potential stop levels. Use Trend Stop indicator to detects the trend direction.
Downtrend if the price crosses the Trend Stop line upwards Uptrend if the price crosses the Trend Stop line downwards
Use Trend Stop indicator to define optimal stop levels. Downtrend Place your stops above the Trend Stop line Uptrend Place your stops below the Tren

Easy Fibonacci ist ein Indikator für MT5, mit dem Sie Fibonacci-Retracements einfach zeichnen können. Funktionen Bis zu 10 Fibonacci-Level können in den Indikatoreinstellungen festgelegt werden. Jedes Level kann einen anderen Linienstil, Linienfarbe, Linienbreite und andere anpassbare Einstellungen haben. Sie können eine Maus mit zusätzlichen Tasten verwenden, um die Tasten V und B zuzuweisen und bequem Fibonacci zu zeichnen. Tastenaktionen: B und V: Fibonacci oben/unten im sichtbaren Bereich de
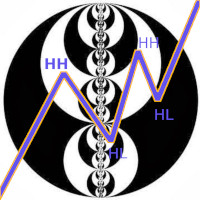
Der Indikator für die Marktstruktur im aktuellen Zeitrahmen findet:
1. Trend (aufsteigende und absteigende Wellen). Die Änderung der Richtung der Welle erfolgt nach dem Ausfall des Extremums (Liquiditätsabzug von der gegenüberliegenden Seite). Das Rendern eines Trends erfolgt unter Berücksichtigung der äußeren Balken (es kann 2 Extreme an einer äußeren Leiste geben). Der Trend kann sich mit der minimalen Anzahl von Balken in der Welle (2 oder mehr) abbilden. Wird durch den Parameter QTY_bars_f

Fractal Levels based on Higher Timeframe ist ein leistungsfähiges Tool, das genaue Unterstützungs- und Widerstandsniveaus auf der Grundlage von Fraktalen des höheren Zeitrahmens erstellt und Ihnen Kauf- und Verkaufssignale mit praktischen Warnhinweisen liefert.
Funktionsweise: Der Indikator analysiert Fraktal-Levels auf dem übergeordneten Zeitrahmen und zeigt sie auf Ihrem aktuellen Chart an. Sie können den übergeordneten Zeitrahmen in den Eigenschaften des Indikators leicht anpassen, um maxim

AtBot: Wie es funktioniert und wie man es benutzt ### Wie es funktioniert Der "AtBot"-Indikator für die MT5-Plattform generiert Kauf- und Verkaufssignale mithilfe einer Kombination von technischen Analysetools. Er integriert den einfachen gleitenden Durchschnitt (SMA), den exponentiellen gleitenden Durchschnitt (EMA) und den Durchschnitt der wahren Reichweite (ATR)-Index, um Handelsmöglichkeiten zu identifizieren. Darüber hinaus kann er Heikin Ashi-Kerzen verwenden, um die Signalgenauigkeit zu

Präsentieren wir den Gold Blitz Scalping Indikator, das ultimative Werkzeug für das Scalping von Gold auf den Zeitrahmen M1, M5 und M15. Entwickelt mit fortschrittlichen AI-Neuronalen Netzwerken, garantiert dieser Nicht-Repaint-Indikator konsistente Rentabilität und überlegene Handelsergebnisse. Der Gold Blitz Scalping Indikator ist für Präzision und Effizienz optimiert und liefert die besten Ergebnisse auf dem M15-Zeitrahmen. Hauptmerkmale: Fortschrittliche AI-Neuronale Netzwerke: Nutzen Sie d

Finanzindikator SolarTrade Suite: Pluto Market Indicator – Ihr zuverlässiger Führer in der Welt der Finanzmärkte!
Es handelt sich um einen Volatilitätsoszillator, der spezielle innovative und fortschrittliche Algorithmen zur Berechnung seines Wertes verwendet und zudem ein ansprechendes Design aufweist.
Die Messwerte dieses Indikators sind sehr einfach zu verstehen: grüne Farbe – geringe Volatilität und der beste Zeitpunkt zum Eröffnen eines Handelsgeschäfts, orange Farbe – hohe Volatilität u
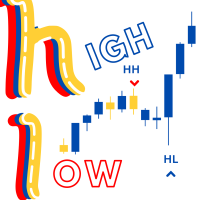
Swing High/Low Identifier
The Swing High/Low Identifier is a custom MetaTrader 5 (MT5) indicator designed to highlight significant swing points on your chart. This indicator identifies and marks swing highs and swing lows based on a configurable range of bars.
- Swing Highs are marked with red arrows above the respective candles. - Swing Lows are marked with blue arrows below the respective candles.
This tool helps traders quickly spot important price levels and patterns, which c
FREE

Finanzindikator SolarTrade Suite: Mercury Market Indicator – Ihr zuverlässiger Führer in der Welt der Finanzmärkte! Unser Forex-Handelsprogramm ist mit einer leistungsstarken künstlichen Intelligenz ausgestattet, die Marktdaten in Echtzeit analysiert. Es sagt Preisbewegungen genau voraus und hilft Händlern, fundierte Entscheidungen zu treffen. Mit fortschrittlichen Algorithmen optimiert unser Indikator Strategien und minimiert Risiken für Händler. Es handelt sich um einen gleitenden Durchschnit

Finanzindikator SolarTrade Suite: Earth Market Indicator – Ihr zuverlässiger Führer in der Welt der Finanzmärkte! Unser Forex-Handelsprogramm ist mit einer leistungsstarken künstlichen Intelligenz ausgestattet, die Marktdaten in Echtzeit analysiert. Es sagt Preisbewegungen genau voraus und hilft Händlern, fundierte Entscheidungen zu treffen. Mit fortschrittlichen Algorithmen optimiert unser Indikator Strategien und minimiert Risiken für Händler. Dies ist ein Ersatz für die standardmäßigen graue
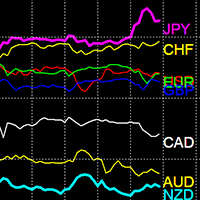
Währungsstärkeindikator
Der Währungsstärkeindikator ist ein leistungsstarkes Tool zur Erkennung von Trends. Er vergleicht die Stärke und Schwäche verschiedener Währungen und erleichtert das Auffinden trendiger Währungspaare.
Verkaufspreis: 49 $
Funktionen
Unterscheidet effektiv zwischen starken und schwachen Währungen Erkennt automatisch trendige Währungen Mehrere Zeitrahmen Lädt 28 Währungspaare Leistungsoptimiert
Indikatorverwendung Starke Währungen: Währungen über 80 gelten als stark.

IQ FX Gann Levels a precision trading indicator based on W.D. Gann’s square root methods. It plots real-time, non-repainting support and resistance levels to help traders confidently spot intraday and scalping opportunities with high accuracy. William Delbert Gann (W.D. Gann) was an exceptional market analyst, whose trading technique was based on a complex blend of mathematics, geometry, astrology, and ancient mathematics which proved to be extremely accurate. Download the Metatrader 4 Version M
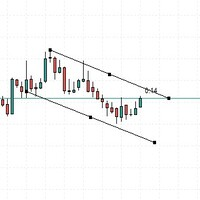
This indicator serves to give sound alerts when the price passes the manually placed line. A very useful tool, which allows you not to spend too much time sitting in front of the computer.
Note that the alert issued will always refer to the current candle, you can use multiple lines on the past chart to analyze.
This indicator will always receive better updates.
FREE

Moving pivot Average Fibonacci
The indicator compares the selected period with its counterpart from the previous period. The indicator determines the moving Fibonacci levels for the day or any time interval to assess the price movement range from the time average. The indicator helps predict the expected high or low for the day based on historical time data. The pivot line can be considered an average trend line and use it in a variety of trading strategies.
If you have any question about the
Session Bias This Strategy of bias useful for those who follow TRADESHARE on youtube. This script is designed by BokaroTraderFx for traders who want assistance in determining their session bias, particularly for those who trade within sessions typically represented by a single 4-hour candle. The method involves using price action to establish a daily bias, guiding decisions on whether to focus on buys, sells, or both. The analysis is based on the previous daily and 4-hour candle closes, fo
FREE

First and foremost, the Insight Flow Indicator stands out as a Non-Repainting, Non-Redrawing, and Non-Lagging tool. This makes it a prime choice for both manual and algorithmic trading, ensuring reliable and consistent signals. User Manual: Settings, Inputs, and Strategy The Insight Flow Indicator leverages price action, strength, and momentum to provide a clear edge in the market. Equipped with advanced filters, it eliminates noise and false signals, enhancing trading potential. By using multip

Translator MeraMera Custom Indicator for MetaTrader 5
Overview:
The MeraMera indicator is a powerful tool designed for MetaTrader 5, aimed at traders who prefer a decisive, high-risk-high-reward trading strategy. Its motto, "GO Full Margin or GO Home," encapsulates its aggressive approach to trading. This custom indicator analyzes market conditions to identify potential bullish and bearish signals, helping traders make informed decisions based on historical price patterns.
Key Features:
1. Bu

Version 1.5: manual color change added
This indicator helps to trade price action and momentum strategies like Guerrilla Trading or similar strategies.
The indicator displays: most recent highs and lows number of consecutive breaks past breaks of most recent highs and lows retest lines flag formations manual color change User can change colors. Go to Indictor Properties/Input, set "Auto Color" to false and change the colors. Set "Auto color" back to true to go back to pre-set colors. Please wa
FREE
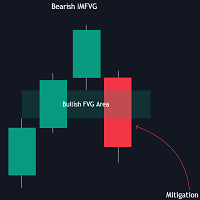
The FVG Instantaneous Mitigation Signals indicator detects and highlights "instantaneously" mitigated fair value gaps (FVG), that is FVGs that get mitigated one bar after their creation, returning signals upon mitigation.
Take profit/stop loss areas, as well as a trailing stop loss are also included to complement the signals.
USAGE Figure 1 Instantaneous Fair Value Gap mitigation is a new concept introduced in this script and refers to the event of price mitigating a fair value gap one

Here is a version for MetaTrader 5 of the famous Wave Trend indicator. Introducing the Wave Trend Oscillator Indicator for MT5 We are excited to present our Wave Trend Oscillator Indicator, exclusively designed for MetaTrader 5. This advanced tool is a must-have for traders who seek precision and efficiency in their trading journey. Our oscillator is built on the principles of wave trend analysis, capturing the ebb and flow of market trends with unparalleled accuracy. It helps traders identify p

The indicator places a buy or sell signal when the conditions of the strategy it was designed with are met. The strategy is guaranteed, strong, and has been tested for 9 years. The indicator is for binary options and can be converted into a bot by linking it to MT2Trading, where it sends the signal to this platform. This platform automatically opens a trade on the trading platform you are using, whether it is Pocket Option, IQ Option, or any other binary options platforms. The entry is on the n
Der MetaTrader Market ist die beste Plattform für den Verkauf von Handelsroboter und technischen Indikatoren.
Sie brauchen nur ein gefragtes Programm für die MetaTrader Plattform schreiben und schön gestalten sowie eine Beschreibung hinzufügen. Wir helfen Ihnen, das Produkt im Market Service zu veröffentlichen, wo Millionen von MetaTrader Benutzern es kaufen können. Konzentrieren Sie sich auf dem Wesentlichen - schreiben Sie Programme für Autotrading.
Sie verpassen Handelsmöglichkeiten:
- Freie Handelsapplikationen
- Über 8.000 Signale zum Kopieren
- Wirtschaftsnachrichten für die Lage an den Finanzmärkte
Registrierung
Einloggen
Wenn Sie kein Benutzerkonto haben, registrieren Sie sich
Erlauben Sie die Verwendung von Cookies, um sich auf der Website MQL5.com anzumelden.
Bitte aktivieren Sie die notwendige Einstellung in Ihrem Browser, da Sie sich sonst nicht einloggen können.