Neue technische Indikatoren für den MetaTrader 5 - 16

Golden Spikes Detector Acknowledgement and Dedications: The name of this indicator was Inspired by an Original; Mr Grant Koopman; a Knowledgeable and experienced Synthetics trader. I dedicate this indicator to Mr Grant. Overview: The Golden Spikes Premium is a groundbreaking trading indicator meticulously crafted for the Boom and Crash indices on the Deriv market. Tailored to meet the needs of discerning traders, this powerful tool operates exclusively on the one-minute timeframe, providing

Introducing Your Ultimate Trading Edge: Dynamic Support & Resistance, Advance Entry Levels Indicator for MT5 platform Unlock the power of precision trading with our cutting-edge Dynamic Support & Resistance Indicator. Designed to give traders unparalleled clarity, this indicator is your roadmap to identifying exactly where to buy and sell, maximizing your potential for consistent, sustainable profits. Why Choose Our Indicator? Crystal Clear Entry and Exit Points : No more guesswork. Our indicat
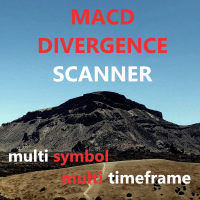
This indicator helps you monitor multiple currency pairs and timeframes all at once. It displays the occurrence of divergences between price and the MACD indicator in a clear and easy-to-read table. Monitoring multiple timeframes and currency pairs in one place helps traders identify a divergence without needing to switch between charts. Divergences can be bullish or bearish. For example, if the price forms a higher high while the MACD forms a lower high, this indicates bearish divergence. On th

The ATR (Average True Range) Indicator is a powerful tool designed to measure market volatility. This indicator provides accurate data on price movement ranges, helping traders manage risk more effectively and make well-informed trading decisions. Based on the widely-used ATR indicator, it’s suitable for both professional and beginner traders to analyze market volatility. The ATR Indicator allows you to track the current price movement range and use this information to set stop-losses, select en
FREE

Description : In the world of trading, candlestick patterns are a popular technical analysis tool used by many traders. There are numerous candlestick patterns, ranging from reversal patterns to continuation patterns. However, remembering all these patterns can be challenging, especially for novice traders. This often leads to traders having to manually memorize and identify candlestick patterns, which can be time-consuming and prone to errors. Candle Pattern Pro is a powerful indicator desig
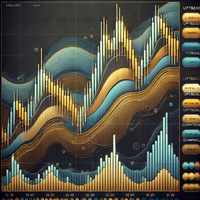
MrGoldTrend is a sophisticated trend-following indicator designed exclusively for XAUUSD (Gold) traders on the MQL5 platform. With clear, easy-to-interpret visual signals, this indicator helps you quickly identify the prevailing trend and make informed trading decisions on the H1 timeframe. MrGoldTrend’s gold lines indicate an uptrend, while blue lines signify a downtrend, providing immediate visual clarity for trend direction. Key Features: Clear Trend Visualization : Gold lines for uptrends, b
FREE
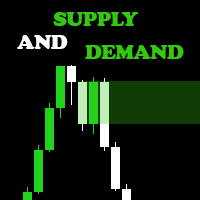
Are you ready to elevate your Forex trading game? Introducing the Supply and Demand Indicator , a powerful tool designed to help traders identify key market zones and make informed decisions with confidence! Key Features: Accurate Zone Identification : Our indicator pinpoints critical supply and demand zones, allowing you to spot potential reversal points and areas of price consolidation. User-Friendly Interface : With an intuitive design, you'll easily navigate through the settings and customiz

The Zero-Lag MA Trend Levels indicator combines a Zero-Lag Moving Average (ZLMA) with a standard Exponential Moving Average (EMA) to provide a dynamic view of the market trend. This indicator automatically plots the EMA and ZLMA lines on the chart. The colors of the lines represent the market trend.
With EMA: ++ green (uptrend) when EMA > zlma ++ red (downtrend) when EMA < zlma With ZLMA: ++ green (uptrend) when the line is trending up ++ red (downtrend) when the line is trending down
When th

During volatile market conditions brokers tend to increase spread. int OnCalculate ( const int rates_total, const int prev_calculated, const datetime &time[], const double &open[], const double &high[], const double &low[], const double &close[], const long &tick_volume[], const long &volume[], const int &spread[]) { int spread_array[];
FREE

This SMT (Smart Money Technique) divergence indicator identifies discrepancies in price movement between two different trading symbols, helping traders detect potential market reversals. This tool compares the price action of two correlated assets, such as two currency pairs or indices, to spot divergences where one asset's price moves in the opposite direction of the other. For example, while one symbol may be making higher highs, the other might be making lower highs, signaling a divergence. T
FREE
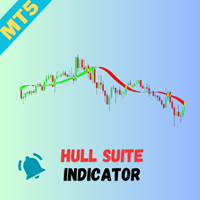
Overview
The Hull Suite is a highly responsive and smooth moving average indicator based on the Hull Moving Average (HMA), developed by Alan Hull in 2005. Known for its minimal lag and clear curves, the HMA has become a widely used technical analysis tool. This script brings together multiple Hull variations into one flexible and customizable indicator, ideal for traders looking for enhanced visual representation and trend analysis. Key Features
The Hull Suite offers three variations of the Hu

The first 100 units are gone for FREE! Now, grab the next 50 units at just $30 each. Act fast, because once they're gone, the price will jump to $99. Don’t wait
The *Rich Scalping* indicator is a powerful tool designed for traders who seek to maximize profits through fast-paced, short-term trading. Specifically tailored for scalping, it accurately identifies entry and exit points by detecting quick price movements and market trends.
With user-friendly signals and real-time alerts, Rich

Multi-Timeframe Fractal Indicator Description for MQL5 Introducing the Multi-Timeframe Fractal Indicator! Key Features: Multi-Timeframe Analysis: Analyze Fractals on a timeframe independent of your chart's current timeframe. Gain insights from higher timeframes for informed trading decisions. Customizable Parameters: Timeframe: Choose the timeframe on which Fractals will be calculated (e.g., Daily, H4, etc.). Number of Bars: Specify the number of bars considered around a potential Fractal for c

# Indicador MultiZigZag Pro para MetaTrader 5
O MultiZigZag Pro é um poderoso indicador técnico para a plataforma MetaTrader 5 que identifica, de forma inteligente e flexível, os principais pontos de inflexão e tendências nos gráficos de preços.
## Características principais: - Algoritmo avançado que filtra ruídos e movimentos irrelevantes do mercado - Múltiplos timeframes para análise de tendências de curto a longo prazo - Parâmetros de profundidade e desvio personalizáveis para adaptação a
Note 1:To get access to MT4 version please contact via private message. Note 2: Multi time frame option is not available with this indicator. To order multi time frame please contact via private message. This is the exact conversion from TradingView: "Supply and Demand Visible Range by LuxAlgo". The screenshot shows similar results from tradingview and Metatrader when tested on ICMarkets on both platforms. This is a light-load processing. Updates are made based on new candle open and chart updat
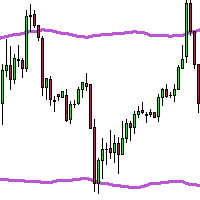
TMA & ATR Adjusted Indicator The TMA & ATR Adjusted indicator for MetaTrader 5 is a powerful tool that combines the Triangular Moving Average (TMA) with the Average True Range (ATR) to provide dynamic market insights. This advanced indicator adapts to market volatility and offers a clear visualization of trends with customizable upper and lower bands. Key Features: Triangular Moving Average (TMA): A smooth moving average that gives more weight to central data points, providing a refined trend an

The Simple Market Sessions Indicator helps traders visualize the current status of major forex market sessions: Asian , London , New York , and Sydney . It shows whether each market is Open , Active (based on volume) , or Closed directly on the chart. With customizable session times and a volume threshold, this tool helps traders monitor session activity and volume strength, making it easier to decide the best times to trade.
Key features: Displays status: Open, Active (High Volume), or Closed
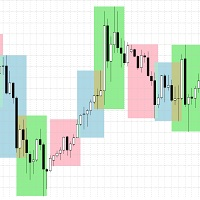
Session Boxes - Advanced Market Sessions Visualization Indicator
Overview The Session Boxes indicator is a powerful and highly customizable tool designed to help traders visualize major trading sessions directly on their charts. By clearly displaying the Asian, London, New York, Sydney, and Frankfurt sessions, traders can easily identify optimal trading times and potential market volatility periods.
Key Features
Multiple Session Support - Asian Session (Default: 00:00-09:00) - London Session

A buy signal can be seen on the dashboard when the previous signal is red and the next signal is green, then the SAR is green and the RSI is green.
A Sell Signal can be seen on the dashboard when the previous Signal is green and the Signal after it is red, then the SAR is red and the RSI is red.
Line function - shows on the chart the lines of Opening, Stop Loss, Take Profit. With this function, it is easy to create a new order and see its additional characteristics before opening. TP and SL
FREE

Wir stellen Quantum TrendPulse vor, das ultimative Handelstool, das die Leistung von SuperTrend , RSI und Stochastic in einem umfassenden Indikator vereint, um Ihr Handelspotenzial zu maximieren. Dieser Indikator wurde für Händler entwickelt, die Präzision und Effizienz suchen, und hilft Ihnen dabei, Markttrends, Momentumverschiebungen und optimale Ein- und Ausstiegspunkte sicher zu erkennen. Hauptmerkmale: SuperTrend-Integration: Folgen Sie problemlos dem vorherrschenden Markt
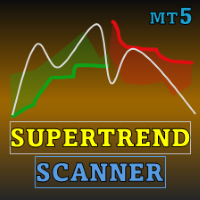
Special offer : ALL TOOLS , just $35 each! New tools will be $30 for the first week or the first 3 purchases ! Trading Tools Channel on MQL5 : Join my MQL5 channel to update the latest news from me Wir präsentieren den SuperTrend ATR Multiplier with Scanner for MT5 – ein vielseitiges und leistungsstarkes Werkzeug, das Ihnen hilft, den Markttrends voraus zu sein, mit anpassbaren Funktionen und Echtzeitwarnungen. Dieses Tool basiert auf der bewährten SuperTrend -Logik von Kivanc Ozbi
FREE
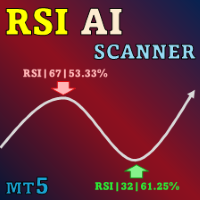
Special offer : ALL TOOLS , just $35 each! New tools will be $30 for the first week or the first 3 purchases ! Trading Tools Channel on MQL5 : Join my MQL5 channel to update the latest news from me Wir stellen den revolutionären RSI Kernel Optimized with Scanner für MT5 vor, ein hochmodernes Tool, das die traditionelle RSI-Analyse durch die Integration des leistungsstarken Kernel-Density-Estimation-Algorithmus (KDE) neu definiert. Dieser fortschrittliche Indikator bietet nicht nur

Der MT5 CCI Dashboard Scanner Der MT5 CCI Dashboard Scanner ist ein Tool, das hilft, die Werte des Commodity Channel Index (CCI) über verschiedene Zeitrahmen und Instrumente zu verfolgen und in Echtzeit Warnungen zu geben, wenn ein neues Signal erkannt wird. Es ist benutzerfreundlich und benötigt wenig Rechenleistung, was eine reibungslose Leistung auf jedem Computer gewährleistet. Hauptmerkmale Automatische Instrumentengruppierung : Der Scanner sammelt alle Instrumente aus Ihrer Marktbeobachtun
FREE
This indicator is the mql version of the SSLHybrid indicator. Find out more here: https://www.mql5.com/en/users/rashedsamir/seller
Description of TradingView version: This script is designed for the NNFX Method, so it is recommended for Daily charts only.
Tried to implement a few VP NNFX Rules
This script has a SSL / Baseline (you can choose between the SSL or MA), a secondary SSL for continiuation trades and a third SSL for exit trades.
Alerts added for Baseline entries, SSL2 continuatio
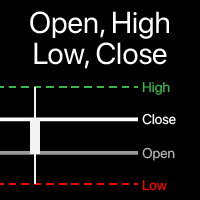
Visualisierung der Open, High, Low, Close - Niveaus auf dem Chart Sie können jeden Zeitraum wählen , nicht nur den aktuellen. Der Offset des berechneten Balkens kann angepasst werden : der aktuelle (schwebende) Balken , oder eine festgelegte Anzahl von zurückliegenden Balken. Multifunktionswerkzeug : beinhaltet 66+ Funktionen | Kontaktieren Sie mich bei Fragen | MT4-Version In den Indikatoreinstellungen können Sie folgendes konfigurieren: Offset des berechneten Balkens: 0 = aktueller Ba

Suitable for the EurTrendSniper trend indicator. Please download and place it in the Indicators folder of MT5.
A key element in trading is identifying the areas or levels where decisions are made to buy or sell financial instruments. Although major participants attempt to hide their presence in the market, they inevitably leave traces. Our task is to learn how to identify these traces and interpret them correctly. Bullish Signal:
The price (candlestick) is above the band-colored block, the ban
FREE

The Accumulation/Distribution (AD) Technical Indicator is a tool used in technical analysis to determine whether an asset is being accumulated (bought) or distributed (sold) in the market. Key Characteristics of the AD Indicator: Purpose: The AD indicator is used to assess the balance between buying (accumulation) and selling (distribution) of an asset. This helps traders and investors evaluate the strength of the current trend and potential reversals. Interpretation: Rising Indicator: Whe

The Accelerator Oscillator (AC) technical indicator measures the acceleration or deceleration of the current market strength. It is designed to identify potential trend reversal points and is used to determine the moment of buying or selling assets. The indicator helps traders make decisions based on changes in market dynamics. This implementation of the indicator is its creative version. Since the standard version is very limited by its built-in settings, this implementation has significantly

The AO (Accumulation/Distribution) technical indicator is a successful indicator for measuring market dynamics, which reflects specific changes in the market's driving force, which helps determine the strength of a trend, including its formation and reversal points. The AO indicator is a technical analysis tool that will help you trade more effectively. Main characteristics of the AO indicator: Purpose: The AO indicator is used to assess the balance between purchases (accumulation) and sales (di
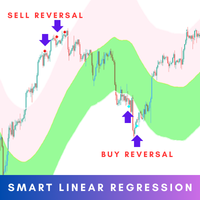
The Smart Linear Regression indicator is a powerful, non-repainting tool designed for traders looking for enhanced accuracy in market analysis. Unlike the typical linear regression channels that often repaint, this indicator provides reliable insights without changing past values, making it more trustworthy for forecasting future price movements. MT4 Version - https://www.mql5.com/en/market/product/124893/ Overview: The Smart Linear Regression Indicator goes beyond the basic linear regr

Trading Session Indicator for MT5 This Session Indicator for MT5 visually highlights key trading sessions directly on your chart with customized colors, making it easier to track market movements during different time zones. The indicator automatically detects and displays the Asian, European, and US trading sessions, offering clear visual separation for each session using user-defined color schemes. Key Features: Automatically plots the major trading sessions (Asian, European, and US) on the ch
FREE

Antabod Genius Indicator—an advanced trading tool designed to give you accurate buy and sell signals directly on your MetaTrader 5 platform. Harnessing the combined power of Moving Averages (MA) and the Stochastic Oscillator, this indicator helps you identify optimal entry and exit points with ease. Key Features: • Precision with Dual Moving Averages: The Genius Indicator uses a fast and slow MA to detect key market momentum shifts. Crossovers between the MAs serve as reliable indicators for pot

Antabod Multiplier , the ultimate trading indicator designed to simplify your decision-making process and maximize your trading potential. Built with a robust combination of moving averages and stochastic oscillators, this tool provides clear, actionable signals for both buy and sell opportunities. The Antabod Multiplier stands out with its dynamic trend detection and precision filtering, giving you real-time visual signals to catch trend reversals and optimal entry/exit points with ease. Whethe

Automatic Trendline Indicator The Automatic Trendline Indicator is a powerful tool designed to simplify technical analysis by automatically identifying and drawing trendlines on a price chart. It analyzes price movements to detect key support and resistance levels, plotting ascending and descending trendlines based on historical price action. This indicator helps traders identify market trends, potential breakout points, and reversal areas with minimal effort. Key features: Automatic Detection
FREE
A Renko Tick chart based on continuously adjusting percentage.
Live Renko bricks formed by tick data
Adjustable brick width expert for indicator attached Scalp with a Renko, get weird.
The settings can and will break the script if you turn them up too high. Turning off outline mode will not look as nice, but can potentially allow for a larger number of bricks.
FREE

Automatic Fibonacci Levels Indicator The Automatic Fibonacci Levels Indicator is an essential tool for traders seeking to incorporate Fibonacci retracement and extension levels into their technical analysis seamlessly. This innovative indicator automatically identifies significant price movements and calculates key Fibonacci levels, providing traders with valuable insights into potential support and resistance areas. Key features: Automatic Calculation : Effortlessly plots Fibonacci levels base
FREE
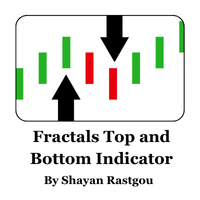
Discover the power of fractals to uncover significant market reversals! This custom Fractals Indicator for MetaTrader 5 is designed to help traders quickly and effectively spot potential swing highs and lows, providing visual cues that make trading decisions easier. Key Features: Clear Buy & Sell Signals: Green and red arrows highlight bullish and bearish fractals, helping you effortlessly identify significant price pivots. Customizable Analysis Depth: Choose the number of bars to evaluate for f
FREE

Tyr Bands Indicator (IC MARKETS GOLD). Just drag and drop. This indicators gets you entry points for the market. it is for gold, but you can configure for any other currency. Tyr Band works with BB and 3 different deviations, plus the Stochastic confirmation. So when the price closes below/above the BB Reversal Band (Red) and the Stochcastic is in the confirmation zone, then the arrow (buy/sell) appears. This arrow indicates that we can entry to the market up/down on the next opening. Since it i
FREE
This non-repainting indicator, inspired by Larry Williams’ renowned "VIX Fix", replicates the power of the VIX (Volatility Index) but works across all asset classes—making it a versatile tool for traders. Originally designed for stock indices, this version adapts to any market, including forex, commodities, and crypto, providing valuable insights into potential market bottoms.
For more details, check out this pdf: https://www.ireallytrade.com/newsletters/VIXFix.pdf
Key Features: Based on the w
FREE

This is a very simple multiple moving average indicator.
It can display 12 moving averages. The time axis of the moving averages can be changed in the input field of the indicator. The process is faster than the 12 moving averages included with MT5.
We also have a buffer set up so you can access it from an Expert Advisor. *For advanced users.
If you have any questions or requests, please message me.
Thank you.
MT4 Version: https://www.mql5.com/en/market/product/122857
FREE
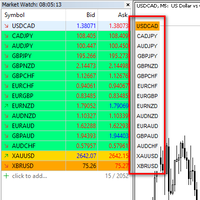
I want to quickly view the chart, so I created a small tool. I hope it can help you. Functions:
Use up/down arrow keys or mouse clicks to quickly open charts for currency pairs. Use left/right arrow keys to change the timeframe of the current chart. Automatically update the order based on the Market Watch
If you have any request or errors please tell me to help it better.
Donate us , Thank u!
Telegram: 0388894014
FREE

Overview The Time Trading Indicator AWT is designed for traders who often miss or overlook their trading opportunities. This tool helps users stay on top of their trading windows by providing timely alerts. Key Features User-friendly interface: Simple and intuitive design for easy navigation. Easy to use: Set it up quickly and start receiving notifications instantly. Alert and Push Notifications: Stay informed with real-time alerts and push notifications. Customizable Objects: Adjust the i
FREE
MT5 Drawdown Tracker – Track Your EA’s Performance with Precision! Take your trading analysis to the next level with our MT5 indicator designed to monitor, record, and report the drawdown of any Expert Advisor. Whether you’re fine-tuning your strategies or optimizing risk management, this tool gives you the insights you need. Key Features: Effortless Tracking: Automatically monitors the drawdown levels of your EAs with precision. Comprehensive Data Storage: Accurately logs each drawdown event,

Special Fair Value Gap (SFVG) Indicator
Unlock your trading potential with the Special Fair Value Gap (SFVG) Indicator! This innovative tool identifies critical price imbalances in the market, helping you pinpoint potential buying and selling opportunities with precision.
Key Features: - Multi Timeframe - Smart Money Tool - Identifies Key Price Levels: Automatically detects STRONG HIGH PROBABILITY gaps in price action where retracements are likely to occur, allowing you to make informed tra

The "Profit and Fee" indicator was developed in MQL5 to help traders clearly visualize the fees involved in operations on the stock exchange (B3). It calculates and displays, in real time, the fees for emoluments and registration, allowing traders to understand the impact of these fees on their profit or loss.
Advantages and Features:
1. Financial Transparency: The indicator shows exactly how much you are paying in fees, providing a clear view of the real value of your operations. This helps

The Area of Interest (AOI) Indicator is a powerful tool designed to help traders identify key market zones where price reactions are highly probable. This indicator specifically highlights two critical zones: Seller AOI (Area of Interest) : This zone represents areas where sellers are likely to enter the market, often acting as resistance. When the price approaches or touches this zone, it signals that a potential sell-off could occur. Buyer A OI (Area of Interest) : The BOI zone identifie
FREE

Haben Sie eine Handelsidee oder einen Insider, aber verpassen Sie ständig den Einstiegspunkt? Das EasyEntry–Signal zeigt den optimalen Einstiegspunkt an, um sich richtig zu öffnen. Hochpräzise Signale am Anfang der Bewegung. Der Indikator wird von der einzigartigen künstlichen Intelligenz von ForexAI erstellt. Das Prinzip der Positionseröffnung basiert auf einem einzigartigen adaptiven Algorithmus zur Erkennung von Kerzenmustern. Analysiert gleichzeitig Daten von 7 Hauptwährungspaaren. Verwendet
FREE
Der FVG-Zonenindikator MT5 ist ein leistungsstarkes Tool zur Identifizierung von Fair Value Gaps (FVG) auf dem Markt, das Preisungleichgewichte zwischen fairem Wert und Marktpreis aufzeigt. Diese präzise Identifizierung von Lücken ermöglicht es Händlern, potenzielle Markteinstiegs- und -ausstiegspunkte zu erkennen, was ihre Fähigkeit, fundierte Handelsentscheidungen zu treffen, erheblich verbessert. Mit seiner intuitiven und benutzerfreundlichen Oberfläche durchsucht der FVG Zone Ind

Der Unterstützung Widerstand Whisperer MT5 ist ein leistungsstarkes Tool, das Händlern dabei hilft, wichtige Unterstützungs- und Widerstandsniveaus auf dem Markt zu identifizieren. Dieser Indikator verwendet Preisaktionen, um dynamisch rote Widerstandslinien und grüne Unterstützungslinien in Ihr Diagramm einzuzeichnen und bietet eine klare und visuelle Darstellung wichtiger Preiszonen, in denen potenzielle Marktumkehrungen oder Ausbrüche auftreten können. Im Gegensatz zu herkömmliche

Tagespreisbereich-Indikator Der Tagespreisbereich-Indikator ist ein leistungsstarkes Werkzeug, das entwickelt wurde, um wichtige Preisniveaus für jeden Handelstag anzuzeigen. Er hilft Tradern, fundierte Entscheidungen auf Grundlage der Marktdynamik zu treffen. Dieser Indikator zeichnet automatisch Rechtecke im Chart und hebt visuell drei wesentliche Preisniveaus hervor: Eröffnungskurs des Tages : Mit einer speziellen Farbe markiert, um den Startpunkt des Marktes für jeden Tag leicht zu erkennen.

YOU CAN NOW DOWNLOAD FREE VERSIONS OF OUR PAID INDICATORS . IT'S OUR WAY OF GIVING BACK TO THE COMMUNITY ! >>> GO HERE TO DOWNLOAD
This system is an Heiken Ashi system based on RSI calculations . The system is a free open source script originally published on TradingView by JayRogers . We have taken the liberty of converting the pine script to Mq4 indicator . We have also added a new feature which enables to filter signals and reduces noise on the arrow signals.
Background
HEIKEN ASHI
Th
FREE

Viking_Strategy_Signal Indicator is a solution I offer to beginner, amateur, and professional traders. My scalping robot : https://www.mql5.com/fr/market/product/133191 By purchasing this indicator, you will first save time because it automatically analyzes the market based on Dow Theory and the Smart Money Concept (High (H), Low (L), Higher High (HH), Lower Low (LL), Break of Structure (BOS) to determine market structure and trend). It is built on my strategy, which relies on the NRTR theory t

Der Neuro Trend-Indikator nutzt modernste Technologie, um frühe Signale für Trendwenden in den Märkten zu liefern. Durch die präzise Farbkodierung zeigt der Indikator die aktuelle Trendrichtung an: Grün signalisiert steigende Kurse (bullischer Trend), während Rot auf fallende Kurse (bärischer Trend) hinweist. Je weiter der Indikator vom Nullpunkt entfernt ist, desto stärker ausgeprägt ist der Trend. Werte über null deuten auf einen starken Aufwärtstrend hin, während Werte unter null

Advanced Dynamic RSI – Die Evolution des klassischen RSI Advanced Dynamic RSI basiert auf den Arbeiten des technischen Analysten J. Welles Wilder und wurde weiterentwickelt. Dieser verbesserte Indikator vereint Wilders bewährte RSI-Berechnung mit modernen Features und einer dynamischen Glättungsmethode, die präzisere und flexibel anpassbare Signale liefert. So können Trader die Marktvolatilität und Preisbewegungen noch gezielter analysieren.
Funktionen und Hauptmerkmale Dynamische Level: Der Ad
FREE
This indicator is the mql version of the Linear Regression Candles indicator. There are many linear regression indicators out there, most of them draw lines or channels, but this one actually draws a chart.This script includes features such as linear regression for open, high, low, and close prices, signal smoothing with simple or exponential moving averages. Find out more here: https://www.mql5.com/en/users/rashedsamir/seller I welcome your suggestion for improving the indicator
To incre
FREE

MT5 Enveloping Pattern Detector: Your competitive advantage in trading Are you looking for a tool to help you accurately identify the best trading opportunities in the forex market? Our Engulfing Pattern Detector provides you with a highly reliable buy or sell signal, based on one of the most recognized and effective Japanese candlestick patterns: the engulfing pattern. With an average success rate of 70%, this indicator will allow you to make safer and more profitable investment decisions. Don'
FREE

MT5 Hammer Pattern Detector: Your guide to more profitable operations
Tired of searching for the best trading opportunities? Our innovative indicator gives you a competitive advantage by automatically identifying hammer patterns on your charts. Known for its high probability of success, the hammer pattern has been a fundamental tool in the arsenal of experienced traders for decades. Our indicator, designed to accurately detect this key pattern, will allow you to:
Identify trend reversals earl
FREE

Support Resistance Indicator The "Support Resistance" indicator is a versatile tool designed to help traders identify key support and resistance levels based on an underlying algorithm. These levels indicate price points where an asset historically experiences buying (support) or selling (resistance) pressure. The indicator allows traders to visualize these levels on their charts, making it easier to make informed decisions. All Products | Contact PARAMETERS: Timeframe :
Users can select the
FREE

An indicator based on time-tested trading methods that gives a signal that the market is overbought or oversold in a certain period of time
The indicator does not disappear when it appears, easy to use
Suitable for any trade
It can be used on any currency pair or crypto
He performed best in the period H1,H4,daily
After the purchase, you will also receive a seller's template with settings
The seller uses it more for trading on cryptocurrency
After the purchase, I also keep in touch with c
ZigZag function
The first zigzag was proposed by Arthur A. Merrill in 1977 and is based on the vertical axis (price range %). The second zigzag is based on the horizontal axis (period), which is widely known in MT4 and MT5. this is the third zigzag designed from a completely new perspective. However, it is not based on originality, but on more fundamental theory.
First, I created the smallest zigzag 0. I bundled zigzag 0 together in accordance with Dow Theory to create zigzag 1. I bundled z

Attention all Boom and Crash traders! Elevate your market monitoring with the cutting-edge RSI indicator, Market Watch . - Customize alert settings for periods, volatility thresholds, and price spikes - Receive voice notifications when your targets are hit - Seamless integration with MetaTrader5 for real-time data
The indicator works on all five Boom and Crash Markets!
Default settings: Number of timeframes: Timeframe 1 - True Timeframe 2 - True Timeframe 3 - True Timeframe 4 - True Timeframe
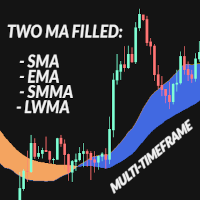
The Two MA Filled is a two moving averages indicator designed for traders seeking a more sophisticated and visual technical analysis. This indicator combines two customizable moving averages with a filling visual between them, allowing you to quickly visualize market trends and identify entry and exit opportunities. Key Features: Customizable Moving Averages: Set the periods and types of moving averages (SMA, EMA, SMMA, LWMA) for the fast and slow averages, tailoring the indicator to your tradin

This indicator is based on the strategy shared by TheMas7er on his youtube channel.
The IDR/DR range will help you identify the high and low of the day once a candle closes above or below the the DR levels.
The IDR/DR range is determined 1 hour after session open, 09:30 am est.
I have incorporated the fibonacci tool to help you mark the retracement for a good entry in the premium or discount zone.
Important
This indicator is designed for the indices and M5 timeframe, but you
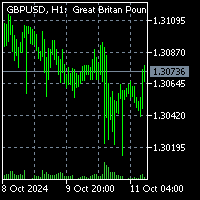
To get access to MT4 version please click here . This is the exact conversion from TradingView: "VolATR" by "barrettdenning" The screenshot shows similar results from tradingview and Metatrader when tested on ICMarkets on both platforms. This is a light-load processing. This is a non-repaint indicator. All input options are available. Buffers are available for processing in EAs. You can message in private chat for further changes you need. Here is the source code of a sample EA operating based
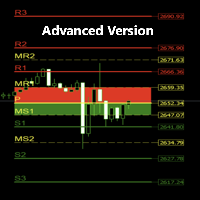
Detailed Description: The Pivot Points Buy Zone Advanced Indicator takes the concept of pivot points to a whole new level, providing traders with enhanced functionality, customizations, and in-depth visualizations. Unlike the free basic version, this advanced indicator allows users to customize more settings, analyze current and historical pivot points, enable potential buy (green) and sell (red) set-ups on the chart, use alerts and pop-up messages, ... etc. Extra Key Advanced Features: Fully C

About indicator > The indicator is a function based on one value (open/high prices up to now) and then it is a mathematical representation of the whole function that is totally independent from any else values. So, if you ask yourself will the future be as it is on the graph... I can tell you - as it was the same as the trading function up to the moment "now"... In conclusion, the point of the indicator is to try to show the future of the trading function into eternity.
The graphic is sometime
Daily Drawdown Indicator for MT5
Unlock your trading potential with our Daily Drawdown Indicator! This powerful tool provides real-time monitoring of daily drawdown levels, allowing traders to stay informed and make smarter decisions. Easily track your performance and manage risk by visualizing drawdown in a clear, user-friendly interface. Whether you're a beginner or an experienced trader, this indicator is essential for maintaining discipline and optimizing your trading strategy. Elevate you

Introducing Order Blocks Breaker , a brand-new way to identify and leverage order blocks in your trading strategy. After developing multiple order block tools with unique concepts, I’m proud to present this tool that takes things to the next level. Unlike previous tools, Order Blocks Breaker not only identifies order blocks but also highlights Breaker Order Blocks —key areas where the price is likely to retest after a breakout. MT4 - https://www.mql5.com/en/market/product/124101/ This t

The Supply and Demand Zone Indicator is a powerful and easy-to-use tool designed to help traders identify critical supply and demand zones on the chart. These zones can provide valuable insight into potential market reversals, breakouts, and important price levels where buyers or sellers are likely to take control. Key Features: Automatic Zone Detection : The indicator automatically identifies supply and demand zones based on historical price action and support/resistance levels, taking the gues
FREE

Der Gann Box Indikator ist ein leistungsstarkes und vielseitiges Werkzeug, das dazu entwickelt wurde, Händlern zu helfen, die Schlüsselniveaus des Marktes zu identifizieren und zu nutzen. Dieser Indikator ermöglicht es, ein Rechteck im Diagramm zu zeichnen, das automatisch in mehrere Zonen mit strategischen Niveaus 0, 0.25, 0.50, 0.75, 1 unterteilt wird. Wenn der Preis eines dieser Niveaus erreicht, werden Warnungen ausgelöst, was eine wertvolle Hilfe bei Handelsentscheidungen bietet. Sie wissen
Der MetaTrader Market ist die beste Plattform für den Verkauf von Handelsroboter und technischen Indikatoren.
Sie brauchen nur ein gefragtes Programm für die MetaTrader Plattform schreiben und schön gestalten sowie eine Beschreibung hinzufügen. Wir helfen Ihnen, das Produkt im Market Service zu veröffentlichen, wo Millionen von MetaTrader Benutzern es kaufen können. Konzentrieren Sie sich auf dem Wesentlichen - schreiben Sie Programme für Autotrading.
Sie verpassen Handelsmöglichkeiten:
- Freie Handelsapplikationen
- Über 8.000 Signale zum Kopieren
- Wirtschaftsnachrichten für die Lage an den Finanzmärkte
Registrierung
Einloggen
Wenn Sie kein Benutzerkonto haben, registrieren Sie sich
Erlauben Sie die Verwendung von Cookies, um sich auf der Website MQL5.com anzumelden.
Bitte aktivieren Sie die notwendige Einstellung in Ihrem Browser, da Sie sich sonst nicht einloggen können.