
MQL5 Wizard Techniques you should know (Part 42): ADX Oscillator
Introduction
The ADX indicator is an oscillator that is meant to measure how strong a given trend in the market is for the security to which it is attached. This article thus, like some that were preceding it, examines the various patterns exhibited by this indicator in a custom signal class file, for wizard assembled Expert Advisors. We review one pattern at a time as we have in the previous articles covering RSI, Bollinger Bands, and the RSI and then conclude with a test that includes all patterns to get a sense of which has the highest weighting.
Before we start on this, though, we had not wrapped-up the look at the parabolic SAR, and so we begin by covering the concluding chapters to that.
SAR and Volume Divergence
To recap from that article, the Parabolic SAR is primarily used to identify potential reversal points and to trail stop-losses in trending markets. They are ‘potential reversal points’ because if price breaches them then the indicator would flip by marking its dots on the opposite end of the high-low range, thus the generated points on a price chart are potential reversal levels in price action. These points, that are marked as dots, follow the price either below (in an uptrend) or above (in a downtrend), allowing traders to be on the lookout for these reversals.
Volume divergence is when price and volume are headed in opposite directions. For forex-traders, ‘volume’ data is not a practical concept, given its dis-aggregation across multiple brokers and platforms. A compromise proxy for this is price bar-range or volatility. Therefore, a price extension, in any direction that is paired with dropping volatility, could serve as a signal indicator in the form of a continuation.
For example, if the Parabolic SAR flips from below the price to above (indicating a sell signal) and this is accompanied by dropping price-bar-range, this can be construed as a weak sell signal and more as a harbinger for a continuation in the previous long trend. Likewise, when price reaches the upper SAR point (above the price in a downtrend) and a volatility divergence is observed (price-bar-range decreasing), this signals a possible strengthening of the downtrend or the beginning of a downward continuation. We code this pattern as follows:
//+------------------------------------------------------------------+
//| Check for Pattern 7.                                             |
//+------------------------------------------------------------------+
bool CSignalSAR::IsPattern_7(ENUM_POSITION_TYPE T)
{  m_sar.Refresh(-1);
   m_sar_alt.Refresh(-1);
   if(T == POSITION_TYPE_BUY && Base(StartIndex() + 1) < Low(StartIndex() + 1) && Base(StartIndex()) > High(StartIndex()))
   {  return(Range(StartIndex()) < Range(StartIndex() + 1) && Range(StartIndex() + 1) < Range(StartIndex() + 2));
   }
   else if(T == POSITION_TYPE_SELL && Base(StartIndex() + 1) > High(StartIndex() + 1) && Base(StartIndex()) < Low(StartIndex()))
   {  return(Range(StartIndex()) < Range(StartIndex() + 1) && Range(StartIndex() + 1) < Range(StartIndex() + 2));
   }
   return(false);
}
Noteworthy, from our source above, is we are now focusing on the larger previous trend and not using the signal in the same simple way we were in patterns such as the very first pattern, 0. Effectively, this is a counter trend signal because we are hunting for continuation patterns on a weak flip. This ‘weak’ flip is confirmed by dropping price bar range over 3 bars. This length of 3 is adjustable, but we are going to stick to it for testing purposes.
Conversely, if the price hits either of the SAR dot thresholds on rising volatility, that should signal as a confirmation of the flip in the SAR. This signal, which also is based on the volume divergence thesis, would in essence be like pattern 0 that we covered in this earlier article on SAR, plus a check for increasing price bar range. This particular pattern is not coded or tested but as always, the reader is welcome to look into it.
In addition, though, with this pattern, traders can use volume divergence alongside Parabolic SAR to place strategic stop-loss adjustments. If we revert to our first volume divergence setup mentioned above where we were looking for weak flips that point to a strong continuation, these signals imply a pausing in a trend and can indicate major support or resistance levels. By having them identified thanks to the weak SAR flip and falling volatility, traders can place or move their stop losses to their open positions that are following the dominant trend to be just above these zones, if the position is short or just below them if the position is long.
The Parabolic SAR can generate many false signals in ranging or choppy markets, which is why, on paper, the volume divergence check can be a boon. Particularly in cases of increasing volatility, it can help to avoid pre-mature entries into the market since the rising volatility, by piercing the SAR’s markers, does often indicate significant momentum to a developing trend. And if this is insufficient, it can be combined with other indicators.
These combinations could be more suitable with oscillator indicators such as the RSI and since we have only coded the first implementation of SAR volume divergence that affirms continuation rather than confirming reversal the reader needs to be prepared to code for these extra indicator checks, on reversal. Testing with pattern 7 for the forex pair EUR USD over the year 2022 on the daily time frame presents us with the following results:

The bitmap pattern integer we use for pattern 7 is 0x80 which translates to the decimal value and input integer of 128 and once it is set the Expert Advisor only places trades using pattern 7.
Inverted SAR on Higher Timeframe
The parabolic SAR on a higher time frame can be very good at providing a broader trend perspective and help filter out the noise from false flips that is prevalent in smaller time frames. If the SAR on a weekly chart signals a strong uptrend, a trader using a 4-hour chart can prioritize long positions and ignore lower timeframe sell signals as potential noise or short-term pullbacks.
In cases where signal on two time-frames are aligned, it does present an even stronger signal. If the 4-hour time frame is bullish and the 15-minute time frame does indicate a flip where the SAR dots the lower end of the price range, this particular point can present not only a strong signal but also a ‘sharper’ entry. There are also strategies that use counter-trend trades, but these can be fraught with risk since the maxim, ‘the trend is your friend’ has arguably served many traders well. By relying on the confirmation of the SAR on multiple time-frames, risky on unreliable counter-trend entries can be avoided.
The SAR not only serves as an entry signal but also an exit indicator. By using wizard assembled Expert Advisors and their attendant classes, that exploit opening and closing thresholds, we are better poised to actually implement this without having to provide any supplementary code. The use of the code attached at the end of this article and its assembly into an Expert Advisor is covered in articles here and here for new readers. The MQ5 extension files are simply included to show what the assembled file would look like after running the wizard, and also to properly reference any necessary files that need to be present when assembling the Expert Advisor. So checks on more than one time frame ensue that exits are more precise, which on paper should yield better performance.
Traders can also use the SAR levels on the higher timeframe to set stop-loss levels for positions taken on lower timeframes. This approach ensures that the stop is placed at a significant level, reducing the chance of being prematurely stopped out by short-term volatility. Higher timeframe SAR trends can indicate longer-lasting market trends, while lower timeframes capture entry points for capitalizing on these major moves. We implement this as follows in MQL5:
//+------------------------------------------------------------------+
//| Check for Pattern 8.                                             |
//+------------------------------------------------------------------+
bool CSignalSAR::IsPattern_8(ENUM_POSITION_TYPE T)
{  m_sar.Refresh(-1);
   m_sar_alt.Refresh(-1);
   if(T == POSITION_TYPE_BUY && Base(StartIndex() + 1) > High(StartIndex() + 1) && Base(StartIndex()) < Low(StartIndex()))
   {  return(Alt(StartIndex()) < LowAlt(StartIndex()));
   }
   else if(T == POSITION_TYPE_SELL && Base(StartIndex() + 1) < Low(StartIndex() + 1) && Base(StartIndex()) > High(StartIndex()))
   {  return(Alt(StartIndex()) > HighAlt(StartIndex()));
   }
   return(false);
}
We perform tests with similar test settings as above with pattern 7 but using the weekly time frame as our alternate time frame and do produce the following results:

We use the input bitmap of 256 to represent the ninth pattern, pattern-8. In summary, therefore, Higher timeframe SAR helps traders understand the larger market context within which the lower timeframe signals are operating. This contextual view helps avoid over-trading or acting on insignificant signals that do not align with the broader trend.
SAR and RSI Overlap
The RSI is, as highlighted in a recent article in this series, is an oscillator that measures the speed and change of price movements, typically used to detect overbought and oversold conditions. It operates on a scale of 0 to 100, where readings above 70 indicate overbought conditions, and below 30 indicate oversold. This, when paired with the SAR, can allow mutual complementation, and serve to identify trends.
Parabolic SAR is effective at identifying the current trend or potential trend reversals, but it can also generate false signals in choppy or sideways markets. This is why the RSI could add a layer of momentum analysis, helping to confirm whether the market is indeed overbought or oversold, thus re-affirming the strength or weakness of the trend identified by SAR. So, when the Parabolic SAR flips below the price, signalling an uptrend, and the RSI shows a reading around 30 (indicating oversold conditions), it strengthens the signal that the trend reversal is likely genuine and has upward momentum.
The combination with the SAR though can take on two-folds. Recall, RSI is a momentum gauge and often there are bursts in the market where momentum or a given rend can be persistent. To this end, even though by default, as argued above we would use the SAR to confirm ‘over-bought’ situations, more often than not it can also serve to confirm prevalent momentum, especially if one considers zooms out of the flip indicator-situations of the SAR and looks at the dot-price gaps or dot changes along each trend. These clearly do present an alternative to the SAR-RSI pairing. We do not implement this though, but just present it here as a talking point. Instead, we use the ‘traditional’ approach, which we implement in MQL5 as follows:
//+------------------------------------------------------------------+
//| Check for Pattern 9.                                             |
//+------------------------------------------------------------------+
bool CSignalSAR::IsPattern_9(ENUM_POSITION_TYPE T)
{  if(T == POSITION_TYPE_BUY && Base(StartIndex()) < Low(StartIndex()))
   {  return(RSI(StartIndex()) <= 30.0);
   }
   else if(T == POSITION_TYPE_SELL && Base(StartIndex()) > High(StartIndex()))
   {  return(RSI(StartIndex()) >= 70.0);
   }
   return(false);
}
Testing with the listing we have above does not give us a lot of trades since on the daily time frame tends to persist, which all goes to make the case for the 2nd way we could implement this SAR-RSI combination as highlighted above. The results from these tests are presented below:

As has been the case when looking at indicators across various patterns, we have been concluding with an optimized test report that cherry-picks multiple patterns with custom thresholds for each pattern over our test window period. These similar test results for the parabolic SAR are presented below:


Using multiple patterns, each with its ideal threshold, in my opinion, is suitable if these threshold values are not cherry-picked or optimized over some narrow period without forward tests. It is better they are used or tested with preset values based on one’s assessment of their performance from live usage.
ADX Overview
The ADX oscillator measures the strength of a given trend by using 3 buffers. Of these, the DI+ and DI- can be conceived as separate indicators because they measure the strength of price in a preset direction. The DI+ (aka Positive Directional Index) measures the strength of upward movement, while the DI- (Negative Directional Index) puts a number to the strength of downward price movements. Therefore, when DI+ is above DI- it indicates buyers are having more sway than sellers and vice versa.
The DI+ buffer gets derived from historical price movements that are above the previous high, meaning if today’s high is greater than yesterday’s, then a positive DI+ value gets logged. Conversely, DI- is got from the portion of the current low that is below the previous day’s low such that a buffer value for DI- gets logged if we get a low below the prior day’s, assuming a daily time frame is being used.
The formulae for DI+ and DI- are:
DI+ = (Smoothed positive directional movement / Average True Range) × 100
DI- = (Smoothed negative directional movement / Average True Range) × 100
The Average True Range or TR component is a key part of these buffers, as it acts to normalize the indicator values by taking into account the prevalent volatility at that time. This is because, as one would expect, large changes in highs or lows tend to happen a lot in volatile environments, therefore by normalizing to the True Range (TR), only the large moves (in spite of TR) get weighted appropriately in the indicator buffers. The TR is computed by selecting the greatest of 3 options, namely the current high less the current low, the current high less the previous close, and the previous close less the current low. The signals from these buffers are then observed from their crossings as well as with a combination of other indicators, as we’ll see below.
ADX Crossover with DI+ and DI-
For our first pattern, pattern-0, a Bullish Signal is indicated when DI+ crosses above DI-, it signals that buying pressure is stronger than selling pressure, potentially marking the start of an uptrend. Conversely, the bearish Signal (DI- > DI+) When DI- crosses above DI+, it signals that selling pressure is stronger than buying pressure, potentially marking the start of a downtrend. We implement this pattern as follows in MQL5:
//+------------------------------------------------------------------+
//| Check for Pattern 0.                                             |
//+------------------------------------------------------------------+
bool CSignalADX::IsPattern_0(ENUM_POSITION_TYPE T)
{  if(T == POSITION_TYPE_BUY && BasePlus(X() + 1) < BaseMinus(X() + 1) && BasePlus(X()) > BaseMinus(X()))
   {  return(true);
   }
   else if(T == POSITION_TYPE_SELL && BasePlus(X() + 1) > BaseMinus(X() + 1) && BasePlus(X()) < BaseMinus(X()))
   {  return(true);
   }
   return(false);
}
The ADX main buffer measures the strength of the trend rather than its direction. It oscillates between 0 and 100, with readings above 25 indicating a strong trend, while values below 25 suggest a weak or non-trending market. It is important to re-emphasize, the ADX does not indicate whether the trend is bullish or bearish; it simply measures the strength of the trend. When ADX is rising and DI+ is above DI-, it indicates a strong bullish trend. If ADX is rising and DI- is above DI+, it points to a strong bearish trend.
Optimization of this pattern for opening and closing thresholds, as well as take profit levels, on the daily timeframe for the year 2022 on the forex pair EUR CHF gives us these results in one of the ‘ideal’ settings:

ADX Above 25 - Strong Trend Entry
We have looked at the two DMI buffers above, DI+ and DI-, but the 3rd buffer of the ADX is its main buffer. It does also provide readings in the range of 0 to 100. It is computed by first determining the directional index, which is given by the formula below:
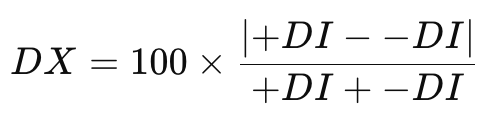
Where:
- DX is the sought directional index
- +DI is the already determined plus directional movement whose formula is shown above
- -DI is the negative counterpart, whose formula is also above
Once we have the directional index (DX), getting the Average Directional Index simply involves getting the Exponential Moving Average of the past 14 directional index values. Alternatively, a smoothing approach can be used that follows the formula shared below:
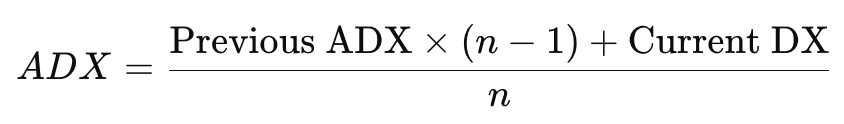
Where:
- n is 14, or any suitable averaging period that is inputted into the ADX indicator.
We implement this in MQL5 as follows:
//+------------------------------------------------------------------+
//| Check for Pattern 1.                                             |
//+------------------------------------------------------------------+
bool CSignalADX::IsPattern_1(ENUM_POSITION_TYPE T)
{  if(T == POSITION_TYPE_BUY && Base(X()) > 25.0 && BasePlus(X()) > BaseMinus(X()))
   {  return(true);
   }
   else if(T == POSITION_TYPE_SELL && Base(X()) > 25.0 && BasePlus(X()) < BaseMinus(X()))
   {  return(true);
   }
   return(false);
}
On optimizing, with similar environment settings as we had with pattern 0, where our symbol is EUR CHF on the daily time fame for the year 2022, we get the following results:

ADX Falling Below 25 - Trend Weakness
Pattern-2 capitalizes on the reverse of patten-1, by looking for instances where the ADX main buffer crosses to below 25, to go against the current trend as indicated by the DI+ to DI- spread. So, whenever the ADX crosses to below 25 from above and the DI- has been above the DI+, this is interpreted as bullish given that is a sign of weakening bearish momentum. Likewise, if the same ADX cross happened when DI+ was above the DI-, that would be bearish, again as an early sign. We implement this in MQL5 as follows:
//+------------------------------------------------------------------+
//| Check for Pattern 2.                                             |
//+------------------------------------------------------------------+
bool CSignalADX::IsPattern_2(ENUM_POSITION_TYPE T)
{  if(T == POSITION_TYPE_BUY && Base(X()+1) > 25.0 && Base(X()) < 25.0 && BasePlus(X()) < BaseMinus(X()))
   {  return(true);
   }
   else if(T == POSITION_TYPE_SELL && Base(X()+1) > 25.0 && Base(X()) < 25.0 && BasePlus(X()) > BaseMinus(X()))
   {  return(true);
   }
   return(false);
}
Optimization test runs with settings as in the patterns above, do give us the following results for pattern 2:

ADX Crossover with Moving Average
For pattern-3, the supplemental moving average that is applied is not your typical price-moving average, but rather another buffer of moving average values for the ADX main buffer. Even this can be tracked as a parallel buffer to the ADX and when the ADX crosses it in the same way price usually crosses moving average buffers on a price chart, this is often a powerful signal. Recall ADX itself is directional neutral, but it only indicates the strength of the prevalent signal whether long or short, by a similar crossover. We implement this in code as follows:
//+------------------------------------------------------------------+
//| Check for Pattern 3.                                             |
//+------------------------------------------------------------------+
bool CSignalADX::IsPattern_3(ENUM_POSITION_TYPE T)
{  if(T == POSITION_TYPE_BUY && Base(X()+1) < BaseAverage(X()+1) && Base(X()) > BaseAverage(X()) && BasePlus(X()) > BaseMinus(X()))
   {  return(true);
   }
   else if(T == POSITION_TYPE_SELL && Base(X()+1) < BaseAverage(X()+1) && Base(X()) > BaseAverage(X()) && BasePlus(X()) < BaseMinus(X()))
   {  return(true);
   }
   return(false);
}
Test runs from select optimization results, in similar settings to what we have used with the patterns above, are presented below:

ADX and Price Divergence
Divergence with the ADX is based on the prevalent price action on the main security’s price chart. This ‘divergence’ though, is a bit quirky in that one is always looking for a decline in the main ADX buffer against a strong trend on the price chart in either direction. So, a bullish divergence would be marked by a drop, in price, on the security’s price chart happening alongside a drop in the ADX on the oscillator main buffer. And a bearish divergence would be characterized by a bullish trend on the price chart while also having a decline in the oscillator ADX. We implement this in MQL5 as follows:
//+------------------------------------------------------------------+
//| Check for Pattern 4.                                             |
//+------------------------------------------------------------------+
bool CSignalADX::IsPattern_4(ENUM_POSITION_TYPE T)
{  if(T == POSITION_TYPE_BUY && Close(X()+2) > Close(X()+1) && Close(X()+1) > Close(X()) && Base(X()+2) > Base(X()+1) && Base(X()+1) > Base(X()) && Base(X()) <= 25)
   {  return(true);
   }
   else if(T == POSITION_TYPE_SELL && Close(X()+2) < Close(X()+1) && Close(X()+1) < Close(X()) && Base(X()+2) > Base(X()+1) && Base(X()+1) > Base(X()) && Base(X()) <= 25)
   {  return(true);
   }
   return(false);
}
Test run of some of its optimal settings give us the following results:

ADX and Range Breakout
Pattern-5, like 4 above, relies on price action from the security’s price chart to develop and confirm its signal. With this case, though, we are looking for break-outs in price after extended periods of consolidation that are backed by spikes in the ADX above the 25 threshold. A bullish signal is a rise in price through the resistance that happens concurrently with a rise in the ADX to above 25. Likewise, a bearish signal is a drop, in price, through the support that is also backed by a rise in the ADX through 25. We implement this in MQL5 as follows:
//+------------------------------------------------------------------+
//| Check for Pattern 5.                                             |
//+------------------------------------------------------------------+
bool CSignalADX::IsPattern_5(ENUM_POSITION_TYPE T)
{  if(T == POSITION_TYPE_BUY && ATRAverage(X()+1) > ATR(X()+1) && ATRAverage(X()) < ATR(X()) && ATR(X()) < High(X())-Low(X()) && Base(X()+1) < 25 && Base(X()) > 25 && Close(X()+1) < Close(X()))
   {  return(true);
   }
   else if(T == POSITION_TYPE_SELL && ATRAverage(X()+1) > ATR(X()+1) && ATRAverage(X()) < ATR(X()) && ATR(X()) < High(X())-Low(X()) && Base(X()+1) < 25 && Base(X()) > 25 && Close(X()+1) > Close(X()))
   {  return(true);
   }
   return(false);
}
Concisely defining consolidations and breakouts in code is very cumbersome, even though for manual traders this is straightforward. Our work around this is going to be by relying on the ATR indicator and taking its readings over a considerable stretch in history and comparing them with the recent price bar range. If the ATR had remained subdued for a reasonable amount of time, and it was less than the recent price bar range, then that could imply a break-out. This is not precise by any means, and I am certain more thorough implementations can be made but for our purposes, in this article, it will have to suffice! Test runs, in settings similar to the patterns already covered above, of the best optimization results do give us the following reports:

Even though we strive to have similar testing environments and settings for all patterns, this particular pattern hardly produced any trades when using the daily time frame. That’s why an exception was made to optimize for the hourly time frame and see if more breakouts could be seen and therefore trades could be placed. The results above are therefore based on the hourly and not the daily, as was the case with the other patterns above.
Conclusion
We will have to pause our look at ADX, here, as there are 3 more patterns that will be considered as part of the next indicator we will consider. To recap though, we have examined the ADX on a pattern basis, which is something the signal class of wizard assembled Expert Advisors allows since there is already some code in the ‘Expert Signal’ class that helps these to be handled. The wizard assembly classes that are used in assembling Expert Advisors provide a lot of functions and methods that clearly negate the need for one to code from zero, especially when exploring or testing out ideas, at a preliminary phase. Besides pattern usage there are other areas we are yet to consider within these series like the use of pending orders, customizing the order-flow or the number of concurrent positions that can be opened at any time, the use of indicators such as ATR in guiding price gap input parameters of not just the trailing stop but also the initial stop loss and take profit level, and many more. Hopefully, we will get to look at these and more sometime in the future, in the meantime, we will dwell on the basics. Patterns and common indicators.
 Features of Experts Advisors
- Free trading apps
- Over 8,000 signals for copying
- Economic news for exploring financial markets
You agree to website policy and terms of use