
MQL5 Wizard Techniques you should know (Part 39): Relative Strength Index
Introduction
In the last article, we started looking at Bollinger Bands in use within a custom signal class for wizard assembled Expert Advisors. We looked at up to 6 of the intended 8 possible setups that can be useful to a trader within a custom signal class in weighting long and short conditions. Because the article was running too long, the final two setups as well as a combined testing of all possible Bollinger Bands setups or patterns as we referred to them then. Let’s continue therefore by looking at pattern 6.
Bands Widening After Downtrend or After Uptrend
Our seventh setup, labelled pattern 6, is primarily hinged around rising volatility. The widening of the gap between the upper and lower bands of the Bollinger is always taken as an indication of rising volatility. In the case of this pattern because this volatility rise comes at the end of a trend, a lot of whipsawing in price action tends to characterize the markets and this is what leads to the presumption of pending reversals from the previous trend.
Therefore, in interpreting this setup, a widening gap between the upper and lower band after a bullish run is considered a bearish signal while similar widening gaps after a bearish run are indicative of a long signal. It is therefore a contrarian signal that looks for opportunities to open positions that are the opposite of the recent dominant trend. We implement this pattern as follows in MQL5:
//+------------------------------------------------------------------+
//| Check for Pattern 6.                                             |
//+------------------------------------------------------------------+
bool CSignalBollingerBands::IsPattern_6(ENUM_POSITION_TYPE T)
{  m_bands.Refresh(-1);
   m_close.Refresh(-1);
   m_high.Refresh(-1);
   m_low.Refresh(-1);
   if(Gap(StartIndex()) > Gap(StartIndex() + 1) && Gap(StartIndex() + 1) > Gap(StartIndex() + 2))
   {  if(T == POSITION_TYPE_BUY && m_close.GetData(StartIndex() + 2) < m_close.GetData(StartIndex() + 3) && m_close.GetData(StartIndex() + 3) < m_close.GetData(StartIndex() + 4))
      {  return(true);
      }
      else if(T == POSITION_TYPE_SELL && m_close.GetData(StartIndex() + 2) > m_close.GetData(StartIndex() + 3) && m_close.GetData(StartIndex() + 3) > m_close.GetData(StartIndex() + 4))
      {  return(true);
      }
   }
   return(false);
}
As can be seen from our code above, the check for expanding volatility is a prerequisite for both bullish and bearish setups. Once this check is passed, we then consider the previous trend from when the volatility expansion begun, not the current trend. We do not look at the current trend because as argued above in this volatile environment the direction is not definitive, however often the trend prior to the volatility spike was clearer.
This situation therefore where the current trends are not clear-cut does always present a risk of breakout continuation where, rather than reverse as one would expect, the price simply breaks out from this ‘consolidation zone’ and continues with the previous trend prior to the volatility spike. This therefore warrants integration with volume analysis such that if the bands widen with falling volume, this serves as a confirmation of the trend reversal thesis. If volume is not contracting, then it’s better for traders to wait for a more suitable reversal point. As we saw in pattern 2 in the previous article, this was the bulk of our thesis.
And as mentioned then volume information is hard to come by which is why we relied primarily on price bar ranges as a proxy. An alternative indicator such as the RSI, which we look at below, can also be used to serve as a confirmation of over bought and over sold price points. From testing of our wizard assembled Expert Advisor, we do get the following results:


Bands Orientation and Angle Changes
The final pattern we consider for Bollinger Bands is related to a skew between the upper and lower bands. When the lower band is rising faster than the upper band by a multiple equal to or greater than the Bollinger Band's deviation input parameter, we interpret this as a bullish signal. This is because this sort of setup portends a break-out on the upside, through the upper band resistance. Confirmation in the form of an actual price break out can supplement this signal in order to sharpen the entry points. The bearish setup mirrors this, whereby if the highs are falling at a faster pace than the lows, the lower bands act as a support that is about to be breached. Again, a confirmation signal for this breach such as when the price closes below the lower bands can be used. We implement this in MQL5 as follows:
//+------------------------------------------------------------------+
//| Check for Pattern 7.                                             |
//+------------------------------------------------------------------+
bool CSignalBollingerBands::IsPattern_7(ENUM_POSITION_TYPE T)
{  m_bands.Refresh(-1);
   m_close.Refresh(-1);
   m_high.Refresh(-1);
   m_low.Refresh(-1);
   if
   (
      T == POSITION_TYPE_BUY &&
      Lower(StartIndex()) > Lower(StartIndex() + 1) &&
      Lower(StartIndex() + 1) > Lower(StartIndex() + 2) &&
      Upper(StartIndex()) >= Upper(StartIndex() + 1) &&
      Upper(StartIndex() + 1) >= Upper(StartIndex() + 2) &&
      Lower(StartIndex()) - Lower(StartIndex() + 2) >= m_deviation * (Upper(StartIndex()) - Upper(StartIndex() + 2))
   )
   {  return(true);
   }
   else if
   (
      T == POSITION_TYPE_SELL &&
      Upper(StartIndex()) < Upper(StartIndex() + 1) &&
      Upper(StartIndex() + 1) < Upper(StartIndex() + 2) &&
      Lower(StartIndex()) <= Lower(StartIndex() + 1) &&
      Lower(StartIndex() + 1) <= Lower(StartIndex() + 2) &&
      Upper(StartIndex() + 2) - Upper(StartIndex()) >= m_deviation * (Lower(StartIndex() + 2) - Lower(StartIndex()))
   )
   {  return(true);
   }
   return(false);
}
This source as mentioned above can be supplemented with price breakout confirmation and the reader can do this since complete source code is attached at the bottom of the article. When we test our assembled Expert Advisor with input map for patterns used as 80 which corresponds to strictly the 8th pattern, we get the following results:


This is from one of the best optimization runs with just pattern 7. However, as mentioned, we modified our custom signal, by breaking from convention, and allowing the use of multiple patterns concurrently. If we therefore make a few optimization runs in search for the best combination of patterns and their respective opening/ closing thresholds, we obtain a number of plausible test results, of which we have the following:


There is a difference in these results and therefore the case could be made for exploiting multiple pattern use with Bollinger Bands and this could be plausibly provided one keeps in mind that these signals while adapting to different market environments, they will also be cancelling each other out. This makes this system harder to prove or cross validate, however if this can be achieved with decent quality test data then the system can be taken further. The long and short conditions that sift through the input map for patterns used for this Bollinger Bands custom signal class is identical to the one we use below with the RSI custom class. The typical listing of the long condition, which is simply mirrored by the short condition, is shared below:
//+------------------------------------------------------------------+
//| "Voting" that price will grow.                                   |
//+------------------------------------------------------------------+
int CSignalRSI::LongCondition(void)
{  int result  = 0, results = 0;
//--- if the model 0 is used and "Price Crossing the Upper Band or the Lower Band"
   if(((m_patterns_used & 0x01) != 0) && IsPattern_0(POSITION_TYPE_BUY))
   {  result += m_pattern_0;
      results++;
   }
//--- if the model 1 is used and "Price Bouncing Off Lower Band or Upper Band "
   if(((m_patterns_used & 0x02) != 0) && IsPattern_1(POSITION_TYPE_BUY))
   {  result += m_pattern_1;
      results++;
   }
//--- if the model 2 is used and "Price Squeeze Followed by a Breakout Above Upper Band or Below Lower Band "
   if(((m_patterns_used & 0x04) != 0) && IsPattern_2(POSITION_TYPE_BUY))
   {  result += m_pattern_2;
      results++;
   }
//--- if the model 3 is used and "Price Double Bottoms Near Lower Band or Double Top Near Upper Band "
   if(((m_patterns_used & 0x08) != 0) && IsPattern_3(POSITION_TYPE_BUY))
   {  result += m_pattern_3;
      results++;
   }
//--- if the model 4 is used and "Price Bounces Off the Middle Band from Above & Bounce Off from Below "
   if(((m_patterns_used & 0x10) != 0) && IsPattern_4(POSITION_TYPE_BUY))
   {  result += m_pattern_4;
      results++;
   }
//--- if the model 5 is used and "Volume Divergence at Lower Band or Upper Band  "
   if(((m_patterns_used & 0x20) != 0) && IsPattern_5(POSITION_TYPE_BUY))
   {  result += m_pattern_5;
      results++;
   }
//--- if the model 6 is used and "Bands Widening After Downtrend or After Uptrend "
   if(((m_patterns_used & 0x40) != 0) && IsPattern_6(POSITION_TYPE_BUY))
   {  result += m_pattern_6;
      results++;
   }
//--- if the model 7 is used and "Bands Orientation and Angle Changes "
   if(((m_patterns_used & 0x80) != 0) && IsPattern_7(POSITION_TYPE_BUY))
   {  result += m_pattern_7;
      results++;
   }
//--- return the result
   if(results > 0)
   {  return(int(round(result / results)));
   }
   return(0);
}
In both conditions, we use bitwise operations to check if the input map for patterns used allows the use of a given pattern. As we have seen with Bollinger Bands the 8 patterns have their distinct indices 1, 2, 4, 8, 10, 20, 40, & 80. Since the input map for patterns used is an integer in the range 0 - 255, we simply check if each of these patterns is selected based on the input value. For example, an input map value of 107 implies only the patterns 0, 1, 3, 5, & 6 are selected. Our last run for the Bollinger Bands we were primarily optimizing for this input map besides other thresholds. We now continue our article by looking at the RSI below.
The Relative Strength Index
The RSI is a very popular oscillator that quite a few traders rely on when placing and closing trades. As described in the article summary notes and in the shared link, it is an index concerned with tracking the rate of change in price so as to anticipate any pending reversals for a given price-trend. If you take a step back and think about this the EURUSD has been, technically, range-bound between 0.95 and 1.60 since 2002 June to present day, and it can be argued that over the next 22 years it could still keep within this range. These are obviously huge moves as they represent a lot of pips; however, it is unlike equity indices, that have almost all traded upwards off of their levels of 2002. So, the importance of forestalling when a forex pair is overbought or oversold remains a vital skill for many traders. Its formula is given by:
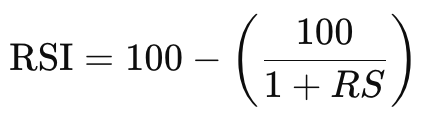
Where:
- RS is the Relative Strength, defined as the ratio of average gains to average losses over a specified period:
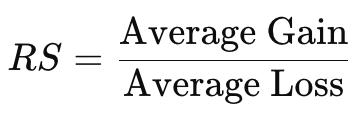
The period over which these average gains/ losses are computed is an input parameter to the RSI indicator. The implementation of this in MQL5 is already handled by library code. Keeping with our theme of the last article, let us look at 8 more patterns of the RSI. We look at each of these patterns in a mode similar to what we had in the last article, where test results from testing each individual pattern are presented along the pattern’s description. We test on the daily time frame with the forex pair USDJPY for the year 2023.
Overbought/Oversold Levels (Traditional)
Our pattern 0 for the RSI is the traditional breaks below or above the oscillator levels of 30 and 70 respectively. This is the predominant way this indicator is used, and given the popularity of this oscillator, it stands to reason it must be a reliable setup. So, breaks below the 30 level indicate an oversold security and often signal a bullish entry, while breaks above the 70 signal the reverse. We implement this within our custom signal class as follows:
//+------------------------------------------------------------------+
//| Check for Pattern 0.                                             |
//+------------------------------------------------------------------+
bool CSignalRSI::IsPattern_0(ENUM_POSITION_TYPE T)
{  m_rsi.Refresh(-1);
   if(T == POSITION_TYPE_BUY && Base(StartIndex()) <= 30.0)
   {  return(true);
   }
   else if(T == POSITION_TYPE_SELL && Base(StartIndex()) >= 70.0)
   {  return(true);
   }
   return(false);
}
Test runs with a wizard assembled Expert Advisor, for which there are guides here and here on how to use the attached code to create an Expert Advisor, we get the following results:


This traditional use of the RSI, like most oscillators, is not without flaws, as in trending markets the oscillator can remain above the 70 level for an extended period (when bullish) or below the 30 in bearish scenarios. This often implies this oscillator can be combined with other indicators like moving averages or even oscillators like MACD, in order to properly establish present signals. In addition, the customizing of these oscillator levels of 70/30 to say 80/20 could be suitable when dealing with highly volatile assets in order to avert premature opening of security positions.
The use of this pattern in range-bound or consolidating markets is certainly ideal, as already mentioned in the intro above, and also the oscillator levels can serve as reliable guides on when to exit positions since they indicate market excesses as already discussed.
RSI Failure Swings (Reversals)
This second pattern, while on the onset very similar to pattern 0, does differ in that it looks for a pivot in the oscillator after testing its key levels. This makes it sharper. A bullish signal is a test of the 30-level followed by a break above it, while a bearish entry is signalled by a rise above 70 followed by a close below it. We implement this in MQL5 as follows:
//+------------------------------------------------------------------+
//| Check for Pattern 1.                                             |
//+------------------------------------------------------------------+
bool CSignalRSI::IsPattern_1(ENUM_POSITION_TYPE T)
{  m_rsi.Refresh(-1);
   if(T == POSITION_TYPE_BUY && Base(StartIndex() + 1) < 30.0 && Base(StartIndex()) > 30.0)
   {  return(true);
   }
   else if(T == POSITION_TYPE_SELL && Base(StartIndex() + 1) > 70.0 && Base(StartIndex()) < 70.0)
   {  return(true);
   }
   return(false);
}
Test runs to demonstrated tradability of pattern 1 do give us the following results:


Pattern 1, failure swings, does tend to offer stronger signals than simply being above or below the key oscillator thresholds because they confirm a shift in market sentiment that is confirmed by more than one RSI move. They indicate that sentiment is reversing without necessarily needing price confirmation. This last point, it is argued, makes failure swings of the RSI more reliable than RSI divergences with price direction, which can also be an RSI signal as we highlight below.
RSI Divergence (Bullish/Bearish Divergence)
Pattern 2 occurs when RSI moves in a given direction and price moves in the opposite direction, again indicating a potential shift in market momentum. This divergence signals that the prevailing up-trend or down-trend could be weakening, and as such a reversal could be imminent. These divergences may either be bullish or bearish, with a bullish divergence being signalled when price makes lower lows while the RSI is making higher lows and a bearish divergence being indicated if price is making higher highs, but the RSI is making higher lows. To code this pattern in our custom signal class, we use the following listing:
//+------------------------------------------------------------------+
//| Check for Pattern 2.                                             |
//+------------------------------------------------------------------+
bool CSignalRSI::IsPattern_2(ENUM_POSITION_TYPE T)
{  m_rsi.Refresh(-1);
   m_close.Refresh(-1);
   if(T == POSITION_TYPE_BUY &&
   Close(StartIndex()) < Close(StartIndex() + 1) &&
   Close(StartIndex() + 1) < Close(StartIndex() + 2) &&
   Base(StartIndex()) > Base(StartIndex() + 1) &&
   Base(StartIndex() + 1) > Base(StartIndex() + 2)
   )
   {  return(true);
   }
   else if(T == POSITION_TYPE_SELL &&
   Close(StartIndex()) > Close(StartIndex() + 1) &&
   Close(StartIndex() + 1) > Close(StartIndex() + 2) &&
   Base(StartIndex()) < Base(StartIndex() + 1) &&
   Base(StartIndex() + 1) < Base(StartIndex() + 2)
   )
   {  return(true);
   }
   return(false);
}
Test runs of our wizard assembled Expert Advisor that solely use pattern 2 for which we require the pattern's used input map to be 4, do give us the following results:


The RSI divergence as already mentioned under pattern 1 above is not as resilient, however its main use is in serving as an early warning indicator of price reversals. They are particularly important in trending markets or situations where very strong trends are present. The divergence signals they yield, though, could be indicative of a pull-back and not a reversal, which is why it is argued they are not as reliable. For this reason, it is often supplemented by additional indicators like moving averages as well as support/ resistance trend lines.
The need to filter out false divergence signals is therefore very important here. What could help is relying on larger time frames as these, though not as productive in generating signals, tend to be a bit more reliable. Noteworthy as well are hidden divergences. These serve as postmarks to a trend continuation with a bullish continuation being inferred from price making higher lows with the RSI making lower lows while the hidden bearish divergence is summed from price making lower highs and the RSI making higher highs.
RSI Crosses Above/Below Midline (50 Level)
Pattern 3 focuses on the RSI mid-point, level 50, by deeming any crossings below it as bearish while any breaks above it are bullish. By default, the presence of the RSI close to the 50 level should indicate no clear signal is present therefore, as one would expect, any crossings of this level are only suggestive and often require confirmation, or they act in a support capacity to other trend indicators as a filter.
By being ‘on the fence’, mid-line crosses can serve both as a trend continuation indicator or a trend reversal indicator. Trend continuation is confirmed for a bullish signal if the RSI crosses above the 50 with the same for a bearish signal when it crosses in the opposite direction. Reversals are also confirmed for the bearish when the RSI breaks through the 50 barrier from below before retreating to below it, and for the bullish in an opposite U pattern over this mid-line. We implement our pattern 3 as follows:
//+------------------------------------------------------------------+
//| Check for Pattern 3.                                             |
//+------------------------------------------------------------------+
bool CSignalRSI::IsPattern_3(ENUM_POSITION_TYPE T)
{  m_rsi.Refresh(-1);
   m_close.Refresh(-1);
   m_high.Refresh(-1);
   m_low.Refresh(-1);
   if(T == POSITION_TYPE_BUY && Base(StartIndex() + 1) < 50.0 && Base(StartIndex()) > 50.0)
   {  return(true);
   }
   else if(T == POSITION_TYPE_SELL && Base(StartIndex() + 1) > 50.0 && Base(StartIndex()) < 50.0)
   {  return(true);
   }
   return(false);
}
Test runs with only this pattern where our input parameter for patterns used is assigned 8 do give us the following results:


Midline crossing is an over simplification of all patterns considered so far, which in turn makes it the least affirmative of a potential signal. The use of pending orders with this type of signal is therefore common, and so is their use across multiple time frames. Furthermore, pattern 3 can also be used in trailing stops whereby traders in, say a long position, stay in it as long as the RSI is above this 50 midline and exiting the position once it crosses or falls below this level. An inverse setup would apply for bearish positions.
RSI Trend line Break
Pattern 4, is probably the most intricate among the 8 that we are looking at in this article as it considers the peaks or troughs along the RSI as well as a break in their respective trend lines. With this pattern setup, a bullish signal is interpreted if descending peaks in the RSI are followed by a rise in the RSI that breaks the trend line of the peaks. Conversely, a rise in RSI troughs followed by the current RSI reading breaking or falling below the trend line of these troughs is taken as indicative of a bearish signal. We list this as follows:
//+------------------------------------------------------------------+
//| Check for Pattern 4.                                             |
//+------------------------------------------------------------------+
bool CSignalRSI::IsPattern_4(ENUM_POSITION_TYPE T)
{  m_rsi.Refresh(-1);
   if(T == POSITION_TYPE_BUY &&
   Base(StartIndex()) > Base(StartIndex() + 1) &&
   Base(StartIndex() + 1) < Base(StartIndex() + 2) &&
   Base(StartIndex() + 2) > Base(StartIndex() + 3) &&
   Base(StartIndex() + 3) < Base(StartIndex() + 4) &&
   Base(StartIndex() + 4) > Base(StartIndex() + 2) &&
   Base(StartIndex()) >= 2.0*Base(StartIndex() + 2)-Base(StartIndex() + 4)
   )
   {  return(true);
   }
   else if(T == POSITION_TYPE_SELL &&
   Base(StartIndex()) < Base(StartIndex() + 1) &&
   Base(StartIndex() + 1) > Base(StartIndex() + 2) &&
   Base(StartIndex() + 2) < Base(StartIndex() + 3) &&
   Base(StartIndex() + 3) > Base(StartIndex() + 4) &&
   Base(StartIndex() + 4) < Base(StartIndex() + 2) &&
   Base(StartIndex()) <= 2.0*Base(StartIndex() + 2)-Base(StartIndex() + 4)
   )
   {  return(true);
   }
   return(false);
}
Notice, we are not necessarily looking for the last true peaks or troughs of the RSI, but rather are checking to see if in the last 5 RSI readings we have a sequence of peaks (for the bullish signal) or troughs (for the bearish). If this check within only the last 5 RSI values is positive, then we simply check for the break of the trend line. Again, we do not get into the geometry of the actual line that is connecting these peaks or troughs, but simply look at the change in the RSI across these two extreme points. If it does not continue at the same pace with the current RSI reading, we interpret that as a breach of the trend line because should the peak-line or trough-line been maintained then the current reading would have been as far from the last trough or peak as its predecessor in the sequence. Testing with just this pattern 4 where the input for patterns used is 10, gives us the following results:


RSI trend line break exploited in this article, as indicated in the shared source, only considers or checks for this pattern in the last 5 readings of the RSI. A more comprehensive approach that seeks out the fractal or peak/ trough points of the RSI could yield more interesting results.
RSI Overbought/Oversold Zones with Moving Average Confirmation
Pattern 5 is simply a combination of pattern 0 with moving average confirmation. Therefore, the bullish conditions outlined for pattern 0 above hold plus a price above the moving average when defining the long conditions while similarly the same bearish conditions would with the price being below the moving average as a confirmation for short positioning. With only this adjustment, we define this as a function in MQL5 as follows:
//+------------------------------------------------------------------+
//| Check for Pattern 5.                                             |
//+------------------------------------------------------------------+
bool CSignalRSI::IsPattern_5(ENUM_POSITION_TYPE T)
{  m_rsi.Refresh(-1);
   m_close.Refresh(-1);
   m_ma.Refresh(-1);
   if(T == POSITION_TYPE_BUY && Base(StartIndex()) < 30.0 && Close(StartIndex()) > m_ma.Main(StartIndex()))
   {  return(true);
   }
   else if(T == POSITION_TYPE_SELL && Base(StartIndex()) > 70.0 && Close(StartIndex()) < m_ma.Main(StartIndex()))
   {  return(true);
   }
   return(false);
}
And exclusive test runs that use only this pattern, where the input map for patterns used is 20, give us the following results:


RSI Double Bottom/Top Patterns
This pattern is also somewhat similar to pattern 1 in that it requires the testing of the key RSI oscillator levels of 70 & 30. However, unlike pattern 1 that requires only a single peak or dip, pattern 6 requires 2 such that two subsequent dips below the 30 line, that are each followed by a recovery from this level does signify a bullish signal. Likewise, a double spike above the 70-level followed by a close below this level is taken as a bearish signal. This we implement as follows:
//+------------------------------------------------------------------+
//| Check for Pattern 6.                                             |
//+------------------------------------------------------------------+
bool CSignalRSI::IsPattern_6(ENUM_POSITION_TYPE T)
{  m_rsi.Refresh(-1);
   if(T == POSITION_TYPE_BUY && Base(StartIndex()) < 30.0 &&
   Base(StartIndex()) > Base(StartIndex() + 1) &&
   Base(StartIndex() + 1) < Base(StartIndex() + 2) &&
   Base(StartIndex() + 2) > Base(StartIndex() + 3) &&
   Base(StartIndex() + 3) < Base(StartIndex() + 4)
   )
   {  return(true);
   }
   else if(T == POSITION_TYPE_SELL && Base(StartIndex()) > 70.0 &&
   Base(StartIndex()) < Base(StartIndex() + 1) &&
   Base(StartIndex() + 1) > Base(StartIndex() + 2) &&
   Base(StartIndex() + 2) < Base(StartIndex() + 3) &&
   Base(StartIndex() + 3) > Base(StartIndex() + 4)
   )
   {  return(true);
   }
   return(false);
}
Testing with just this pattern, 6, which requires our input parameter for patterns used to be 40, does give us the following results:


RSI with Multiple Timeframes
Our final pattern, pattern 7, simply takes pattern 0 the traditional and most popular pattern for the RSI and applies it across multiple time frames. The bullish and bearish conditions for this therefore are identical to what we saw above in pattern 0. The extra input parameter our custom signal class will take in for this would be the extra time frame to help construct the second RSI handle. For efficient testing purposes and in order to avoid the price-noise that can be prevalent in shorter time frames, our second time frame will be larger than the default test time frame. The coding of this is as shared below:
//+------------------------------------------------------------------+
//| Check for Pattern 7.                                             |
//+------------------------------------------------------------------+
bool CSignalRSI::IsPattern_7(ENUM_POSITION_TYPE T)
{  m_rsi.Refresh(-1);
   m_rsi_alt.Refresh(-1);
   if(T == POSITION_TYPE_BUY && Base(StartIndex()) <= 30.0 && Alt(StartIndex()) <= 30.0)
   {  return(true);
   }
   else if(T == POSITION_TYPE_SELL && Base(StartIndex()) >= 70.0 && Alt(StartIndex()) >= 70.0)
   {  return(true);
   }
   return(false);
}
Testing of just this pattern with the patterns used input map as 80 gives us the following results:


As we shared with the Bollinger Bands, see in the conclusion above, we also have a multi pattern option for this custom signal class. As with the Bollinger Bands, we optimize the input patterns used to map an integer from 0 to 255 to find the ideal combination of patterns that could be ideal for the RSI oscillator. Our optimization run came up with the map for patterns used as 189. In binary format that is 10111101 which means the only patterns, from our optimization run, that are ‘unsuitable’ are pattern 1 and pattern 6 (the RSI failure swings & double tops/ bottoms) This, of course, was for the pair USDJPY, and cross validation was not performed. Nonetheless, the test results are shared below:


Conclusion
In conclusion, for this article we have examined the RSI oscillator, a very popular technical indicator, by highlighting its signal patterns. Some of these patterns are very common and are easily associated with the RSI like the traditional pattern 0, while others like the trend-line break, pattern 4 may be strange to some traders. However, on top of testing each individual pattern at the exclusion of all the others, our custom signal class also takes the liberty of using the patterns used input map as a mask for selecting more than one pattern such that in effect the patterns that open a given position may not necessarily be the same patterns that govern or determine when it is closed.
Also, what could be worth exploring for the readers is any additional patterns that we have not considered in this article. We used only 8 patterns, which meant our input for patterns used was not more than 2 to the power 8 minus 1 (255). If we are to add on this number of pattern and say have it go up to 10 then our input map for patterns used will range from 0 up to 2 to the power 10 minus 1 which comes to 1023. Additional patterns that could be considered include the RSI breakout strategy where if the price of an asset rises above a key resistance level on the price chart, and it simultaneously breaks through the 70 level on the RSI chart, this signal, counter to the patterns considered thus far, is interpreted as being strongly bullish and the start of a major trend. Likewise, the bearish signal would also follow, firstly by the chart price falling below a key chart resistance level and the RSI also falling below 30. This also goes counter to how we have interpreted the RSI in this article. The coding of this is subject to the trader being aware of the key price chart support and resistance levels for the security that he is trading in, and so it is left to the reader (trader) to implement.
 Features of Custom Indicators Creation
 Features of Experts Advisors
- Free trading apps
- Over 8,000 signals for copying
- Economic news for exploring financial markets
You agree to website policy and terms of use