
MQL5 Wizard Techniques you should know (Part 38): Bollinger Bands
Introduction
Bollinger Bands are a popular technical indicator developed by John Bollinger in 1987 that consists of 3 lines (or data buffers). Its primary function is to find a way of quantifying market volatility by identifying over bought and over sold price points of traded securities. Bollinger Bands expand and contract due to market volatility, whereby if the volatility increases the two outer bands draw apart more, while if there is a contraction in volatility the two outer bands are drawn closer together.
Traders use these expansions and contractions to anticipate periods of price breakouts or price consolidation, respectively. The upper and lower bands of the Bollinger also act as dynamic Support and Resistance levels, this is because prices tend to bounce off these levels, offering potential clues for reversals or continuations. Bollinger Bands often support mean reversion strategies, where prices are expected to return to the mean (the middle band) after touching either the upper band or lower band. Overbought and oversold conditions are also determined when the price extends beyond the outer bands, signalling potential reversal points.
In addition, when prices stay consistently close to the upper band, it indicates a bullish trend is in the offing while a predominantly lower band location often implies downtrends are intact. Breakouts (or breakaways) from these bands can therefore indicate the start of a new trend or a turning point. Finally, the Bollinger Bands squeeze occurs when the upper and lower band are very close to each other for a given stretch of time such that volatility is low and the potential for breakout opportunities is imminent. Traders monitor this closely, often using the direction of the break-out as the cue for direction. The formula for the 3 data buffers is straightforward and can be captured by the following equations:
![]()
Where:
- MB is the middle band buffer
- SMA is a simple moving average function
- P represents the history of close prices
- n is the period over which the simple moving average is computed
![]()
Where:
- UB is the upper band buffer
- k is a tunable factor that is often assigned 2 by default
- Sigma is the standard deviation over the averaged period.
![]()
Where:
- LB is the lower band buffer
The purpose of this article is not just to itemize the different signals Bollinger Bands can generate but also, as always, show how they can be integrated into a single custom signal class file. Usually, these articles are structured such that the science behind an idea comes first and then the strategy testing & results are presented at the end. However, for this article as we have in some previously, we will share the test results for each presented signal setup alongside the code of the signal setup. This means we are going to feature multiple test results throughout the article, as opposed to having them at the end. We are looking at up to 8 possible Bollinger Bands signals that could be exploited by traders.
Custom signal classes are key in not just developing versatile and robust signals due to the way they allow different strategies to be combined, but the minimalist approach to coding, in principle, allows for ideas to be rapidly tested and cross-validated in a short amount of time. The code attached at the bottom of this article is meant to be used in the MQL5 wizard to assemble an Expert Advisor, and new readers can find guidance here and here on how to do this. Once ideas are cross-validated, traders have the option of either deploying the assembled Expert Advisor or re-coding it with, trade execution customizations while keeping the base strategy.
Before we go through the signals, it could be instructive if we demonstrate how we prepare the custom signal class to handle or process all these 8 signal alternatives. Below is the custom signal class interface:
//+------------------------------------------------------------------+
//| Class CSignalBollingerBands.                                     |
//| Purpose: Class of generator of trade signals based on            |
//|          the 'BollingerBands' indicator.                         |
//| Is derived from the CExpertSignal class.                         |
//+------------------------------------------------------------------+
class CSignalBollingerBands : public CExpertSignal
{
protected:
   CiBands           m_bands;            // object-indicator

   ....

   //--- "weights" of market models (0-100)
   int               m_pattern_0;      // model 0 "Price Crossing the Upper Band or the Lower Band"
   int               m_pattern_1;      // model 1 "Price Bouncing Off Lower Band or Upper Band "
   int               m_pattern_2;      // model 2 "Price Squeeze Followed by a Breakout Above Upper Band or Below Lower Band "
   int               m_pattern_3;      // model 3 "Price Double Bottoms Near Lower Band or Double Top Near Upper Band "
   int               m_pattern_4;      // model 4 "Price Bounces Off the Middle Band from Above & Bounce Off from Below "
   int               m_pattern_5;      // model 5 "Volume Divergence at Lower Band or Upper Band "
   int               m_pattern_6;      // model 6 "Bands Widening After Downtrend or After Uptrend "
   int               m_pattern_7;      // model 7 "Bands Orientation and Angle Changes "
   uchar             m_patterns_used;  // bit-map integer for used pattens

public:
                     CSignalBollingerBands(void);
                    ~CSignalBollingerBands(void);

  ....

protected:

   ...


   //--- methods to check for patterns
   bool              IsPattern_0(ENUM_POSITION_TYPE T);
   bool              IsPattern_1(ENUM_POSITION_TYPE T);
   bool              IsPattern_2(ENUM_POSITION_TYPE T);
   bool              IsPattern_3(ENUM_POSITION_TYPE T);
   bool              IsPattern_4(ENUM_POSITION_TYPE T);
   bool              IsPattern_5(ENUM_POSITION_TYPE T);
   bool              IsPattern_6(ENUM_POSITION_TYPE T);
   bool              IsPattern_7(ENUM_POSITION_TYPE T);
};
It follows the standard approach to most custom signals, with the main addition for this article being the listed ‘m_pattern_XX’ variables that are highlighted in the code. These variables that represent a weighting (a value in the range 0 – 100) are common in custom signal classes that are assembled via the wizard. Quick examples of this are the envelopes signal class and the RSI signal class. Both these classes use these pattern variables that feature a preset constant weight that is often shy of 100. Having them assigned a constant weight is not problematic per se because in principle each class is meant to be used with other signal classes such that what gets optimized or adjusted is the respective weighting of each class towards the overall Expert Advisor signal.
The notion of optimizing them therefore is a bit strange given that there runs a huge risk in overfitting for the tested symbol or trade security and the use of these patterns often assumes the trader is well familiar with the relative importance and weighting of each pattern. He does not need an optimizer to tell him this. In addition, in the event that multiple signal classes are used, and they all have their own patterns, the optimization requirements for this would go through the roof. That’s why it’s always better to have them as ‘knowledge-based’ constants and not a weighting that is to be trained.
However, for this article, we are going to explore the option of having these patterns optimized. This we will do primarily for the reason that this class is being assembled solely within the wizard. It will not be weighted against another signal. Our weighting parameter for this signal will therefore remain at 1.0, as it has been for most of the signal classes we have been testing in these series. In addition to this, usually when constant pattern values are assigned, only one of these patterns gets used while the others are dormant. This usually implies that because the signal class is assembled along with other signals meaning its weighting gets optimized, the selected pattern is optimized to work with other signals while the other none selected patterns are idle.
For this article, we want to use all patterns, whenever they are present. The patterns are paired in nature, i.e. for long and short conditions, and it is unlikely that any two different type patterns could be indicated at the same time.(By this we mean that say pattern 1 and pattern 2 could be concurrently signalled not that a long and short condition for a single pattern could be shown at the same time) So, what concurrent use implies is one pattern could indicate a long position, while a different pattern at a separate time indicates a short position or the closure of the position we opened earlier. These custom signal classes have closing thresholds and opening thresholds so when a given pattern is present, depending on its optimized value, it could either simply close an already open position or close the position and open a reversal. Our Expert Advisor therefore will optimize these pattern weights over a short window, for a single symbol, and see if this gives us anything interesting.
Our custom signal class inherits from the ‘CExpertSignal’ class that features ‘PatternsUsage’ function that takes as input a bit-mask integer for the patterns used in the custom signal class. Since we can use up to 8 signal patterns, our bit-map will range in size from 0 up to 2 to the power 8 minus one, which is 255. This implies that besides determining the individual pattern thresholds (where these thresholds set the closing and opening of positions), we will select which patterns amongst the 8 that will be best suited as a strategy that uses the Bollinger Bands. This selection for the combination of patterns to use concurrently is shown in the final tester report at the end of this article (due to the lengthy article this is postponed to appear in the next). For each of the patterns available, the test results below are when the expert advisor uses a single pattern.
From testing, though, assigning the number of used patterns does not properly enable the use of the definition function ‘IS_PATTERN_USAGE ()’ as one would expect. It appears the default assigning of -1 as the number of used patterns, which implies all patterns can be used, is what is always implemented regardless of the input we provide. As a walk around this we use our own bit-wise implementation that allows converting the input hash-map integer into 0s and 1s from which one can read what patterns have been selected. The table below can serve as a guide to what the key 8 individual pattern maps are, and how we interpret them in our code:
| input map (m_patterns_used) | implied bits | byte-checker |
| 1 | 00000001 | 0x01 |
| 2 | 00000010 | 0x02 |
| 4 | 00000100 | 0x04 |
| 8 | 00001000 | 0x08 |
| 16 | 00010000 | 0x10 |
| 32 | 00100000 | 0x20 |
| 64 | 01000000 | 0x40 |
| 128 | 10000000 | 0x80 |
As can be seen, each of the listed 8 maps implies the use of a single pattern. This is best illustrated in the implied bits where, across a string of 8 characters, all are zeroes except one of them. The input can actually be assigned to any value from 0 up to 255 which is why it is an unsigned character (uchar data type).
Price Crossing the Upper Band or the Lower Band
So, our first signal is where the price crosses over either the upper band or the lower band. When the price crosses the upper band from above to drop below it, we interpret this as a bearish signal. Conversely, when the price crosses the lower band from below and closes above it, we potentially interpret this as a bullish signal. We implement this logic in a function that checks for pattern 0 as follows:
//+------------------------------------------------------------------+
//| Check for Pattern 0.                                             |
//+------------------------------------------------------------------+
bool CSignalBollingerBands::IsPattern_0(ENUM_POSITION_TYPE T)
{  m_bands.Refresh(-1);
   m_close.Refresh(-1);
   if(T == POSITION_TYPE_BUY && Close(StartIndex() + 1) < Lower(StartIndex() + 1) && Close(StartIndex()) > Lower(StartIndex()))
   {  return(true);
   }
   else if(T == POSITION_TYPE_SELL && Close(StartIndex() + 1) > Upper(StartIndex() + 1) && Close(StartIndex()) < Upper(StartIndex()))
   {  return(true);
   }
   return(false);
}
Our code is pretty straightforward, thanks in part to the standard library code of MQL5 where coding for the Bollinger Bands indicator is minimized such that once a class instance is declared for the indicator like this:
//+------------------------------------------------------------------+
//| Class CSignalBollingerBands.                                     |
//| Purpose: Class of generator of trade signals based on            |
//|          the 'BollingerBands' indicator.                         |
//| Is derived from the CExpertSignal class.                         |
//+------------------------------------------------------------------+
class CSignalBollingerBands : public CExpertSignal
{
protected:
   CiBands           m_bands;            // object-indicator

  ...

  ...

};
And it is initialized as follows:
//+------------------------------------------------------------------+
//| Create indicators.                                               |
//+------------------------------------------------------------------+
bool CSignalBollingerBands::InitIndicators(CIndicators *indicators)
{
//--- check pointer
   if(indicators == NULL)
      return(false);
//--- initialization of indicators and timeseries of additional filters
   if(!CExpertSignal::InitIndicators(indicators))
      return(false);
//--- create and initialize MA indicator
   if(!InitMA(indicators))
      return(false);
//--- ok
   return(true);
}
All we have to do is refresh it as indicated in the function above. We do not worry about buffer numbers as functions to cater for the upper band, lower band and main (or middle) band are built within the class. Also, the main symbol open, high, low and close prices are initialized within referenced classes provided they are declared within the class constructor as follows:
//+------------------------------------------------------------------+
//| Constructor                                                      |
//+------------------------------------------------------------------+
CSignalBollingerBands::CSignalBollingerBands(void)
...

{
//--- initialization of protected data
   m_used_series = USE_SERIES_OPEN + USE_SERIES_HIGH + USE_SERIES_LOW + USE_SERIES_CLOSE;
   ...
}
This again only leaves the requirement to refresh the respective price handle, on each bar, before retrieving the current price. In our case, we are using the close price so that is all we need to refresh. We run tests on the wizard assembled Expert Advisor where we assign the pattern's used input bit-map to 1 because we are using only the first pattern. Part optimized test results while using only pattern 0 give us the following report:
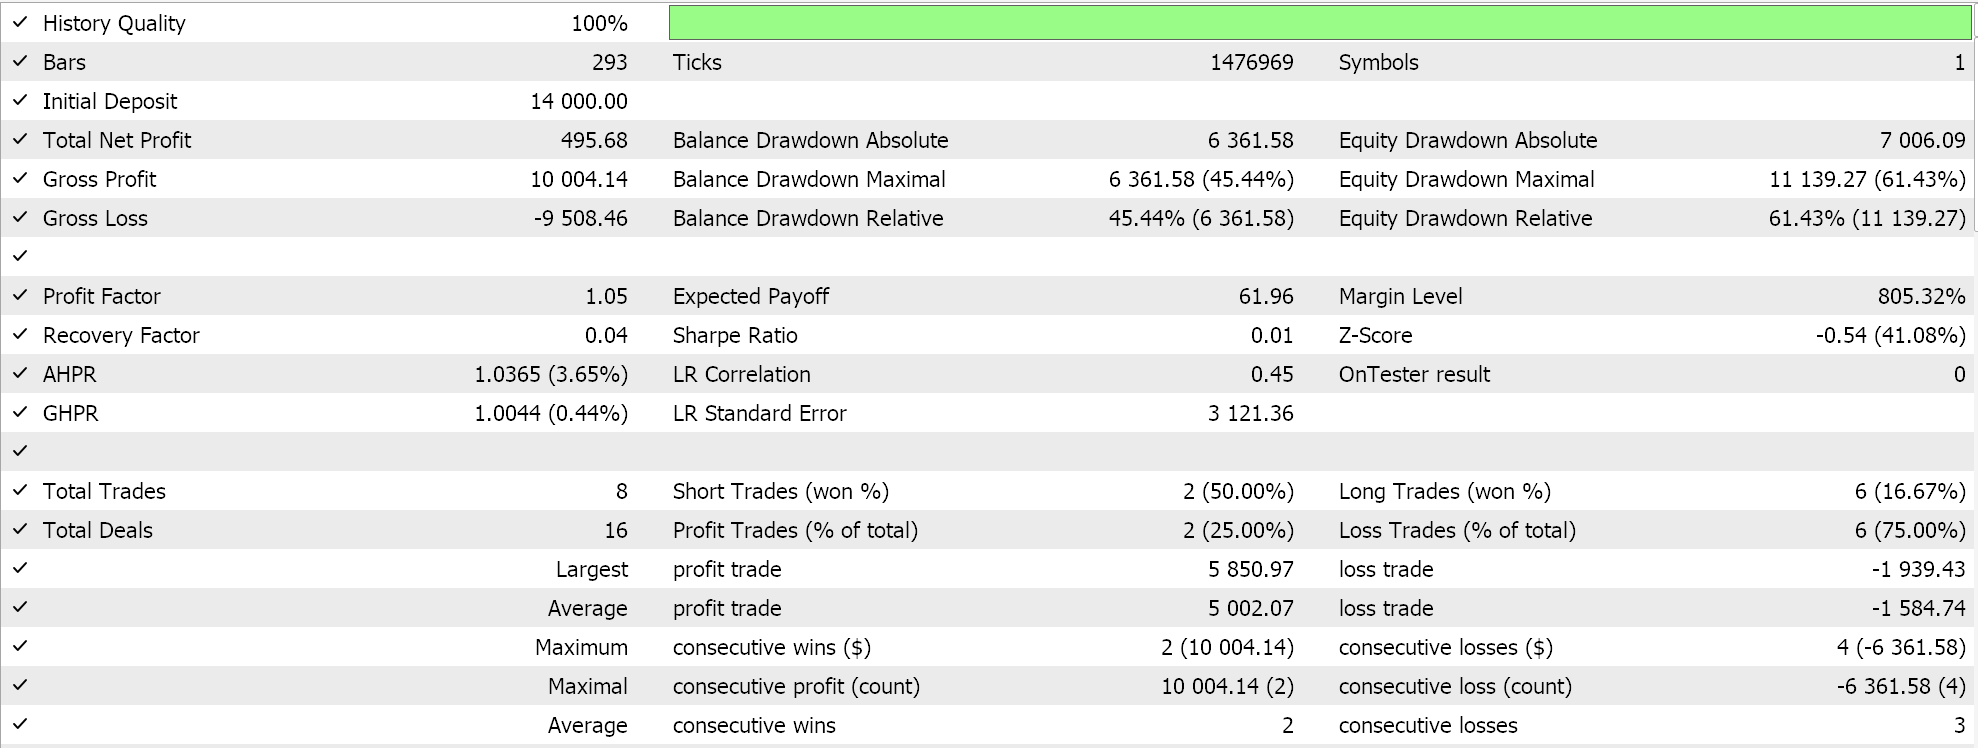
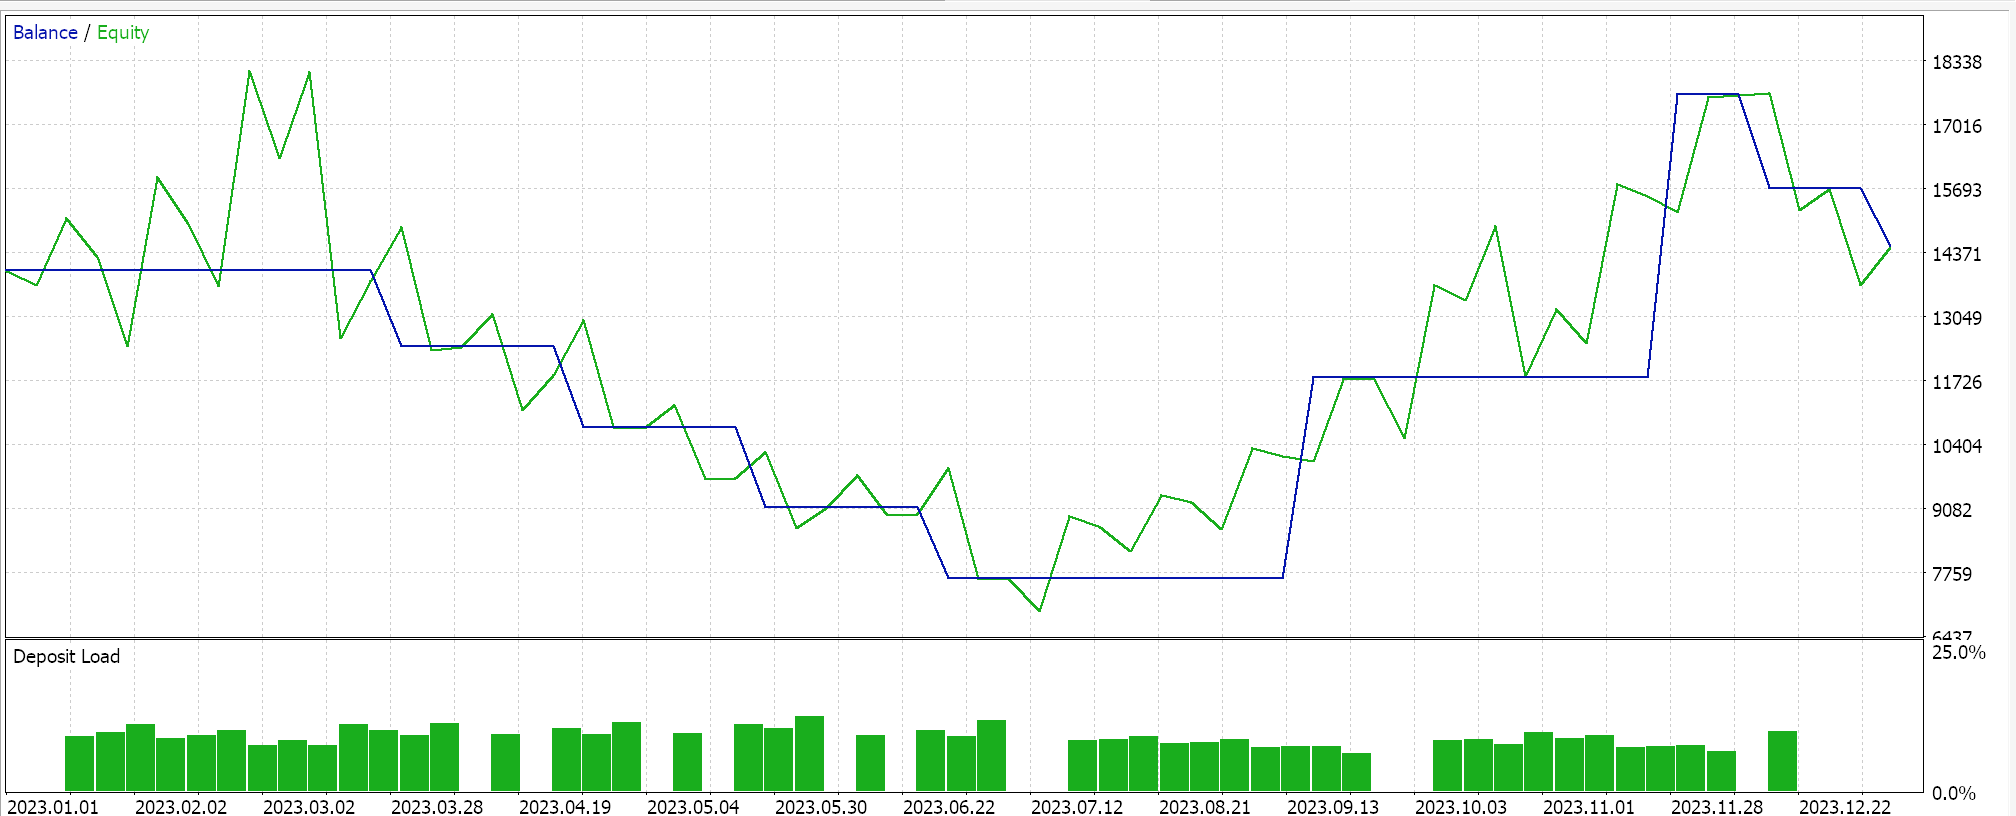
The above results are from USDCHF test runs on the daily time frame for the year 2023. Because we are using only pattern 0, the input hash map integer for patterns used is 1. We check for this pattern as follows in the long and short conditions that are shared in code at the bottom of this article, together with test results across all the patterns.
Price Bouncing Off Lower Band or Upper Band
Our next signal is the bounce off of prices on either of the outer bands. If the price touches the upper band and then retreats from it, this is inferred as a bearish signal. Conversely, is the price did dip to the lower Bollinger band and then recover, this is taken to indicate a bullish signal. This interpretation stems from the upper bands and lower bands being key reversal zones. This in turn could be explained by the market’s psyche, where traders feel when a price advances excessively in any given direction, a correction is due. Recall, Bollinger Bands not only track trends thanks to the baseline (or mid) buffer, but they also keep tabs on volatility. So, when price approaches any of the outer bands or when they widen, volatility is implied.
Confirmation tools, that can be alternative indicators, would ideally be used together with the Bollinger Bands. To implement the check for this, bounce off the outer bands in MQL5, we use the following source:
//+------------------------------------------------------------------+
//| Check for Pattern 1.                                             |
//+------------------------------------------------------------------+
bool CSignalBollingerBands::IsPattern_1(ENUM_POSITION_TYPE T)
{  m_bands.Refresh(-1);
   m_close.Refresh(-1);
   if(T == POSITION_TYPE_BUY && Close(StartIndex() + 2) > Lower(StartIndex() + 2) && Close(StartIndex() + 1) <= Lower(StartIndex() + 1) && Close(StartIndex()) > Lower(StartIndex()))
   {  return(true);
   }
   else if(T == POSITION_TYPE_SELL && Close(StartIndex() + 2) < Upper(StartIndex() + 2) && Close(StartIndex() + 1) >= Upper(StartIndex() + 1) && Close(StartIndex()) < Upper(StartIndex()))
   {  return(true);
   }
   return(false);
}
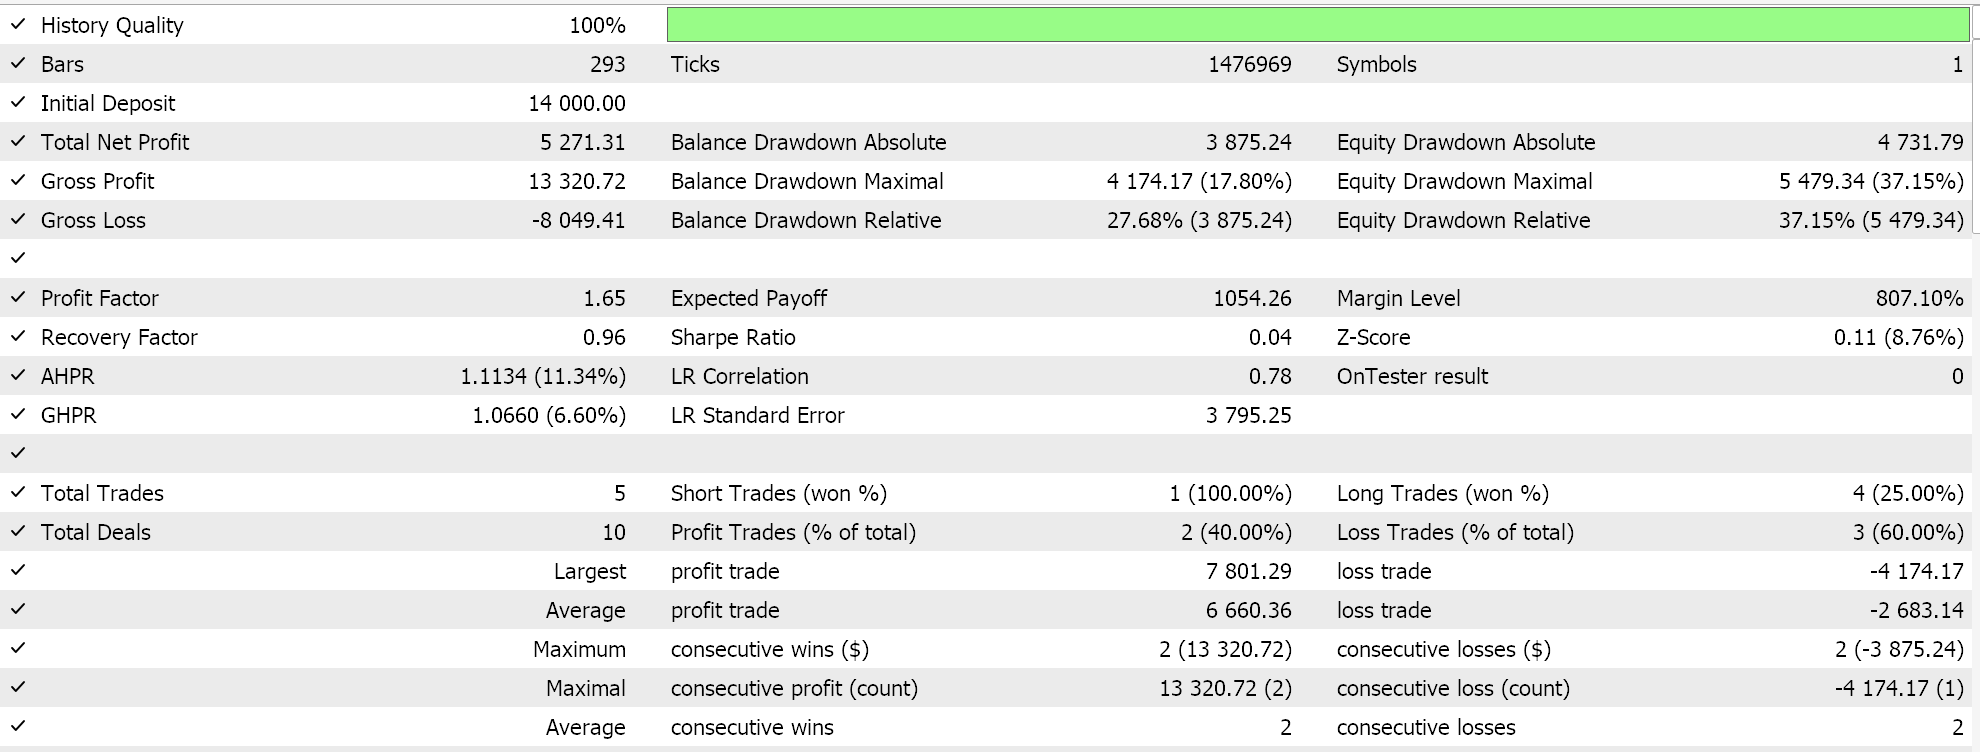
We are using up to 8 patterns, and as can be seen from the table shared above, the input map (used pattern input) for the second pattern is 2. This ensures when we are checking for long and short conditions, we use only this pattern, the bouncing off of the upper and lower bands. We perform test runs on the pair USDCHF at the daily timeframe for the year 2023 and get the following results:

Price Squeeze Followed by a Breakout Above Upper Band or Below Lower Band
Our pattern type 2 is a price squeeze followed by a breakout. The definition of a price squeeze typically is an extended period of low volatility, which with the Bollinger Bands is marked by a narrow gap between the upper bands and lower bands. How long this gap needs to be is a subjective matter. For our purposes, we are being a bit too simplistic, since we are interpreting a squeeze as any simultaneous shrinkage towards the Bollinger Band's base for both the upper band and the lower band. This means that if this squeeze is only one bar long, we will use it. Below is the MQL5 implementation of this.
//+------------------------------------------------------------------+
//| Check for Pattern 2.                                             |
//+------------------------------------------------------------------+
bool CSignalBollingerBands::IsPattern_2(ENUM_POSITION_TYPE T)
{  m_bands.Refresh(-1);
   m_close.Refresh(-1);
   if(Upper(StartIndex()) > Upper(StartIndex() + 1) && Upper(StartIndex() + 1) < Upper(StartIndex() + 2)  && Lower(StartIndex()) < Lower(StartIndex() + 1) && Lower(StartIndex() + 1) > Lower(StartIndex() + 2))
   {  if(T == POSITION_TYPE_BUY && Close(StartIndex()) >= Upper(StartIndex()))
      {  return(true);
      }
      else if(T == POSITION_TYPE_SELL && Close(StartIndex()) <= Lower(StartIndex()))
      {  return(true);
      }
   }
   return(false);
}
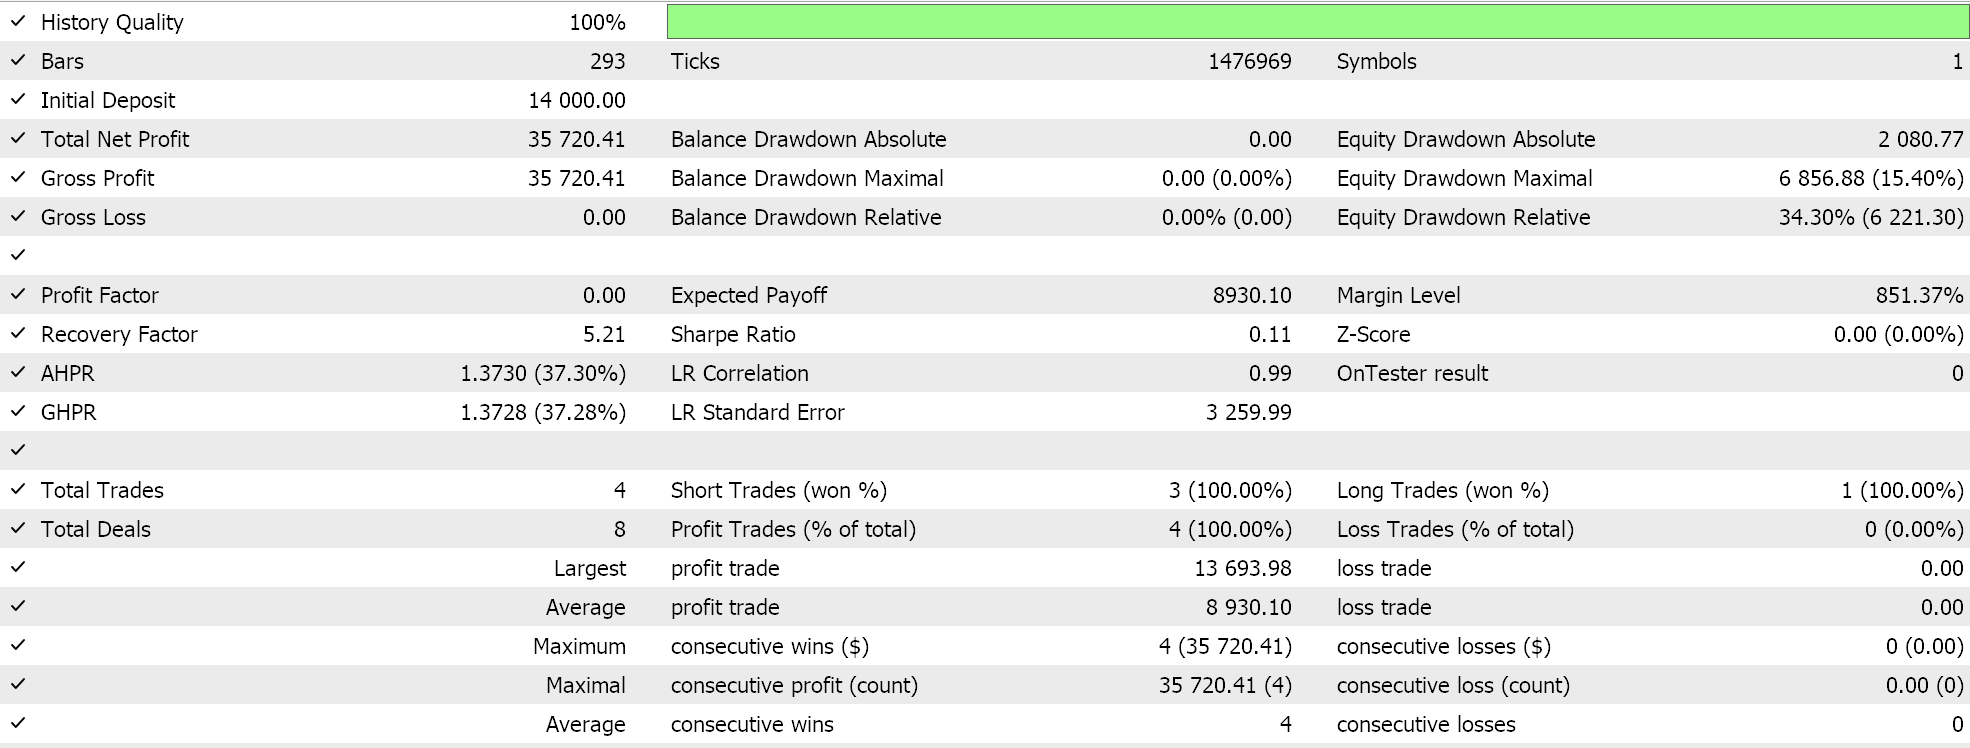
In fact, from our code, the squeeze duration is strictly one bar. Our code does not even take into account how wide the gap between the upper band and lower band is, and yet this is another key factor that could be taken into account when defining this. From our source code above, any dip in the upper band that happens simultaneously with a spike in the lower band, amounts to a squeeze. If the price after this squeeze is at or closer to the upper band, a bullish signal is indicated. If on the other hand the price is at the lower band after this squeeze then we take that as a bearish signal. Test runs with just this pattern does give us the following results:
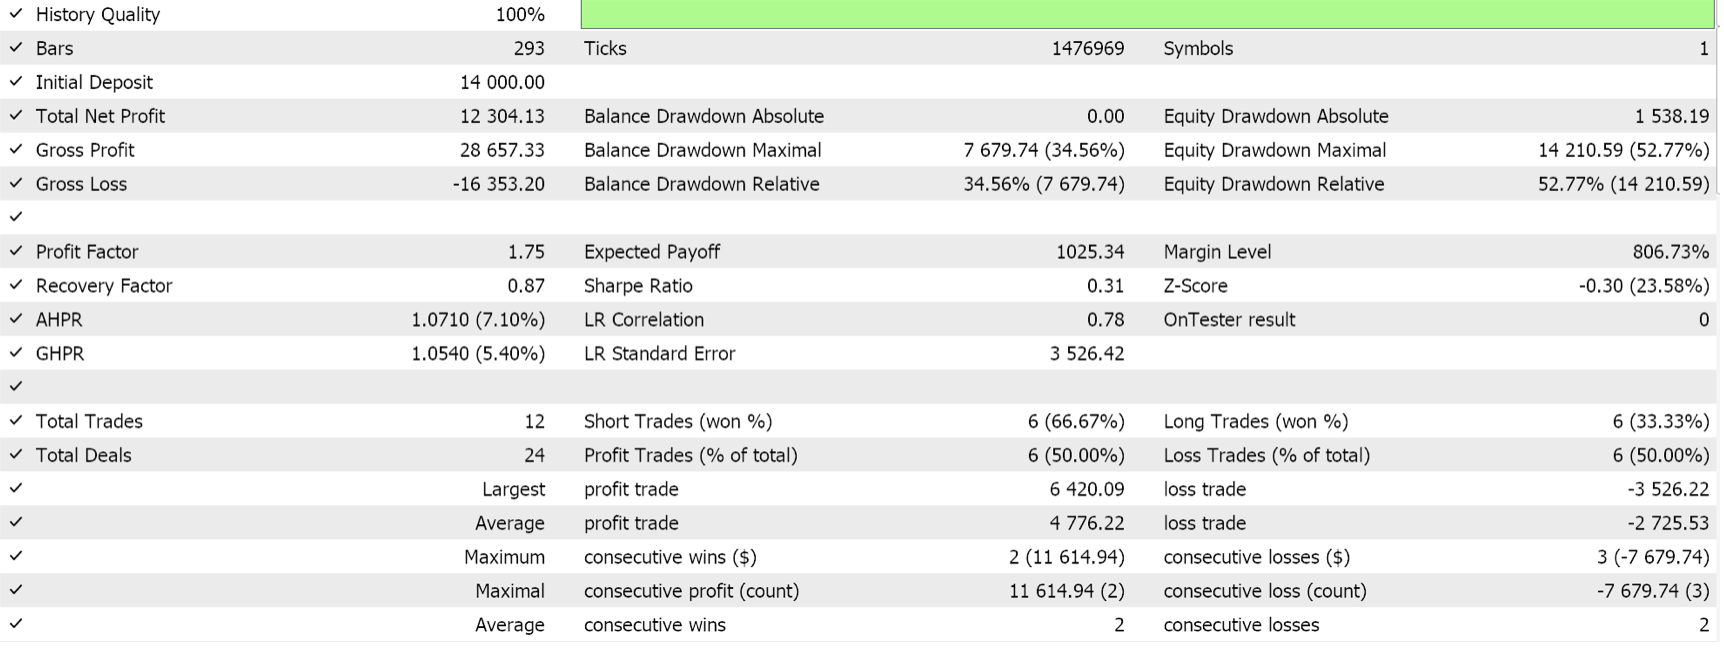
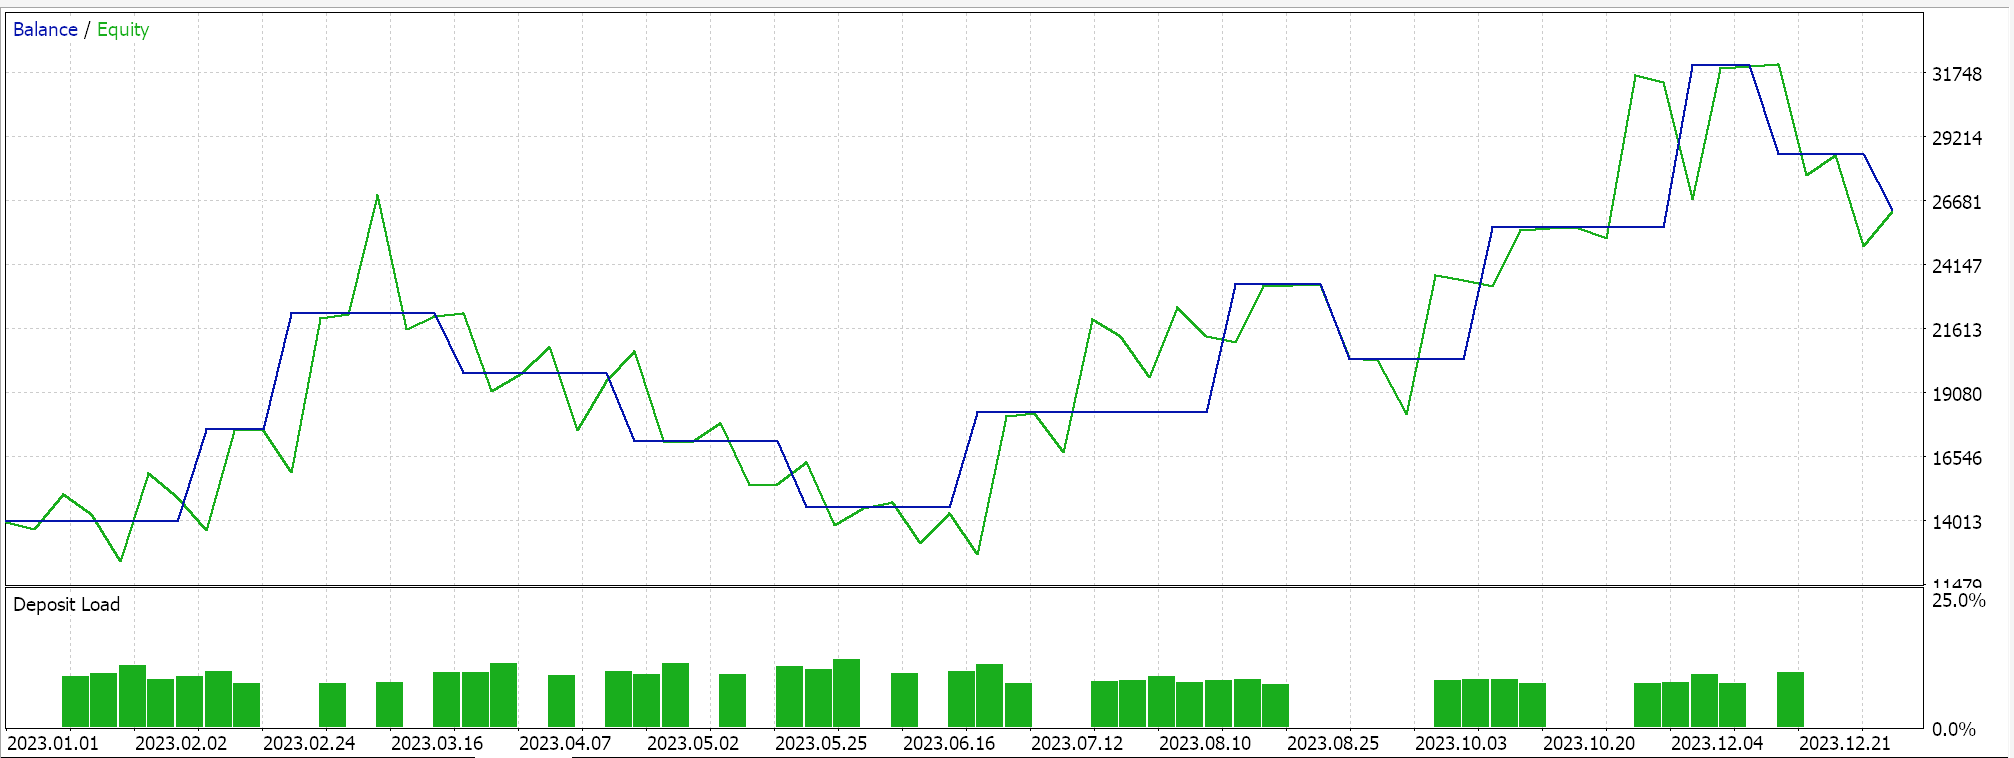
Our results above from a brief optimization run over the year 2023 on the daily timeframe for the symbol USDCHF are not cross validated and my only serve to indicate the potential of pattern 2.
Double Bottom Near Lower Band or Double Top Near Upper Band
This pattern is also in our list and frankly is a bit similar to pattern 1 (the 2nd pattern above). The main difference being that here we have more than one bounce off of the outer bands, as opposed to the solo bounce we had with pattern 1. So, this pattern which is labelled pattern 3 can be thought of as pattern 1 with a confirmation. Because of this, not many trade setups are entered when relying on this pattern alone. Its implementation in MQL5 is as follows:
//+------------------------------------------------------------------+
//| Check for Pattern 3.                                             |
//+------------------------------------------------------------------+
bool CSignalBollingerBands::IsPattern_3(ENUM_POSITION_TYPE T)
{  m_bands.Refresh(-1);
   m_close.Refresh(-1);
   m_high.Refresh(-1);
   m_low.Refresh(-1);
   if
   (
      T == POSITION_TYPE_BUY &&
      Close(StartIndex() + 4) < Close(StartIndex() + 3) &&
      Close(StartIndex() + 3) > Close(StartIndex() + 2) &&
      Close(StartIndex() + 2) < Close(StartIndex() + 1) &&
      Close(StartIndex() + 1) > Close(StartIndex()) &&
      Close(m_close.MinIndex(StartIndex(), 5)) - Upper(StartIndex()) >= -1.0 * Range(StartIndex())
   )
   {  return(true);
   }
   else if
   (
      T == POSITION_TYPE_SELL &&
      Close(StartIndex() + 4) > Close(StartIndex() + 3) &&
      Close(StartIndex() + 3) < Close(StartIndex() + 2) &&
      Close(StartIndex() + 2) > Close(StartIndex() + 1) &&
      Close(StartIndex() + 1) < Close(StartIndex()) &&
      Lower(StartIndex()) - Close(m_close.MaxIndex(StartIndex(), 5)) >= -1.0 * Range(StartIndex())
   )
   {  return(true);
   }
   return(false);
}
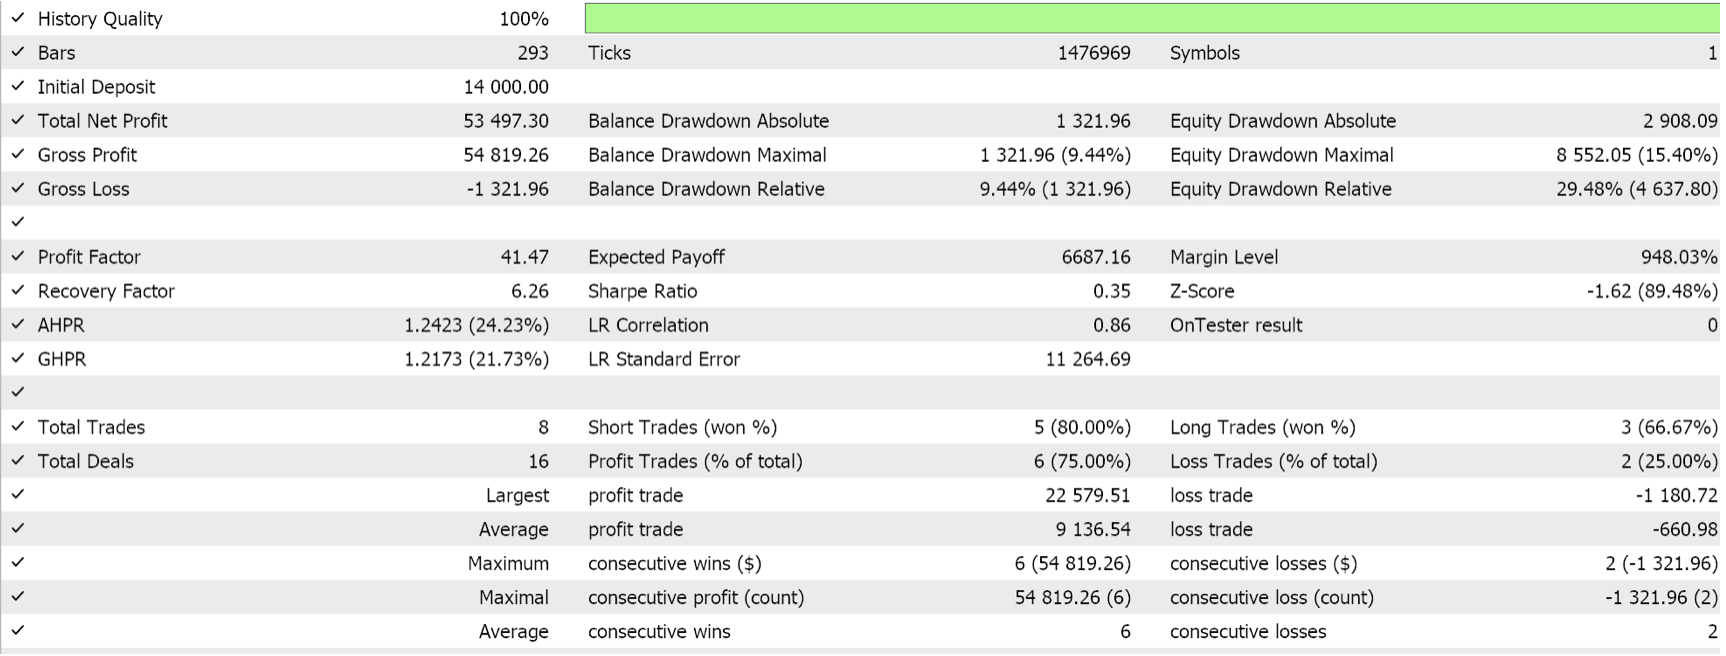
The input map that restricts us to trade with only this pattern is the bit-map 4. As can be seen from our reference table above, looking at the implied bits shows when counting from the right, heading to the left, everything is zero except the 4th character which represents our pattern 3. Test runs in similar settings to what we have above, USDCHF, daily timeframe, 2023, do give us the following results:
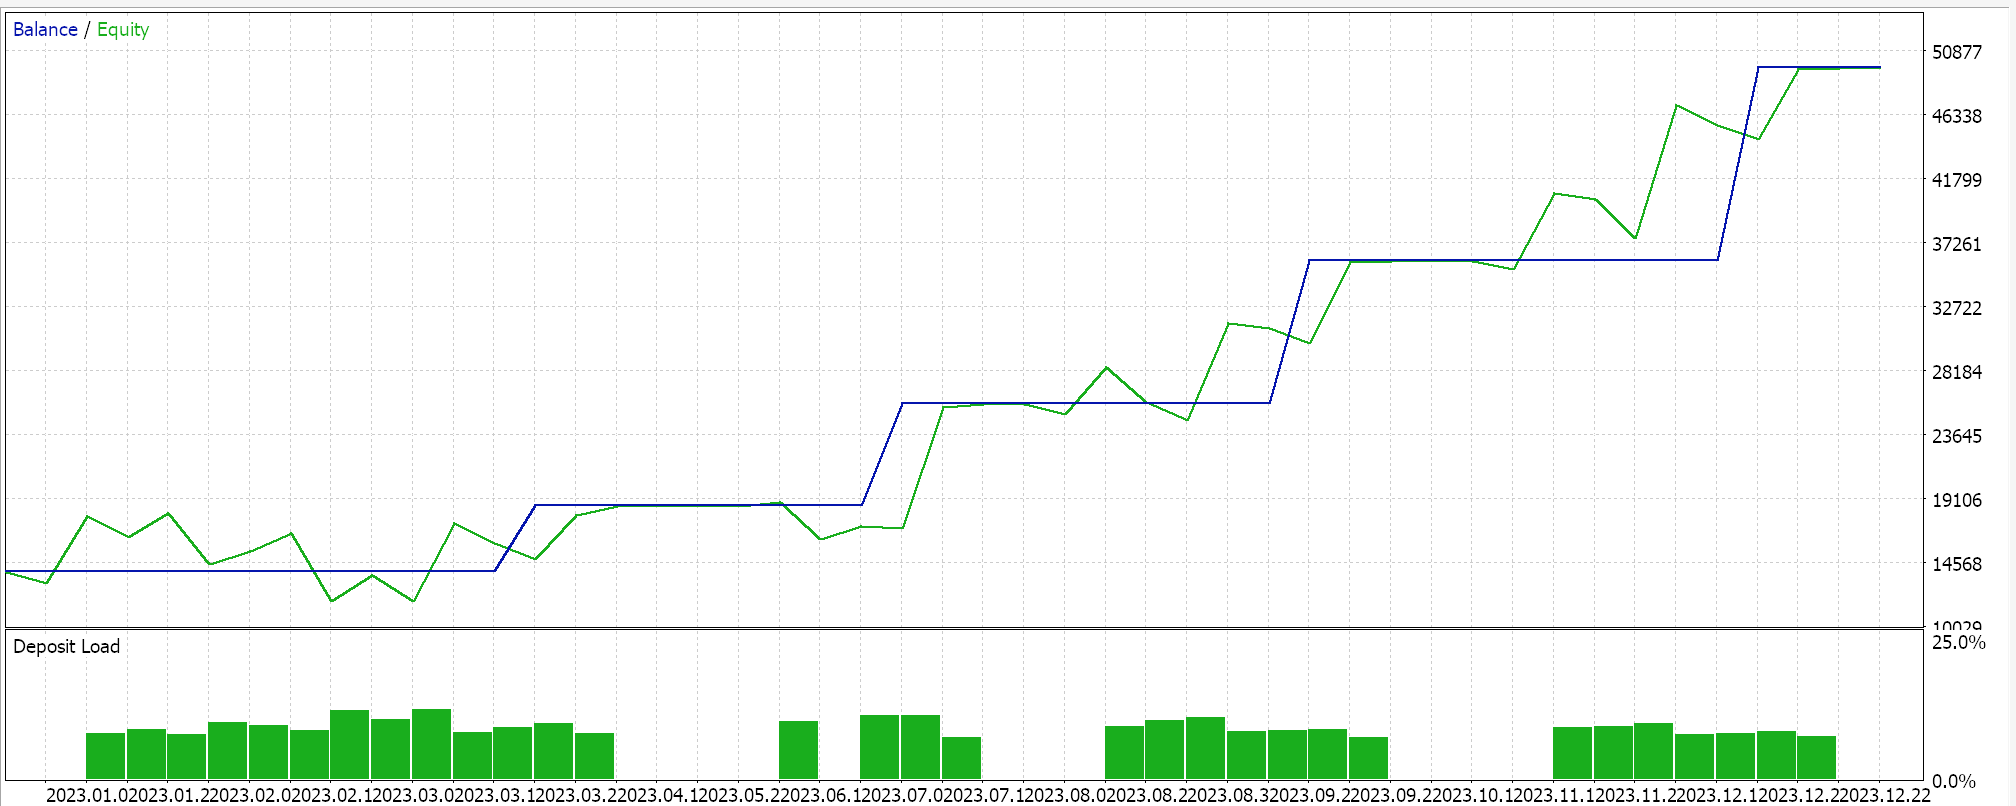
As is clearly apparent, not a lot of trades get placed because double bottoms on any of the upper or lower bands is not a common occurrence. This perhaps implies this pattern can be used independently without the pairing of another indicator, unlike some of the patterns we just saw above.
Bounce Off the Middle Band from Above & Bounce Off from Below
Our next and fifth pattern is pattern 4 and this evolves around continuation patterns amidst a trend. So, whenever price is trending in any given direction, quite often it does take a few pauses along the way. During these breaks, there is more whipsaw action than definitive trends, however quite often (but not always) prior to resuming a trend the price may test the resistance (if the trend is downward) or the support (if the trend is upward). This testing of these levels can be marked by the Bollinger Band's base buffer because it also, like the upper and lower bands, tends to act as a dynamic support/ resistance level.
With this pattern, we interpret a bullish pattern if price tests the base (middle buffer) from above and then bounces upwards off it and a bearish pattern if the same thing happens in reverse. A bounce off from below. Implementation of this in MQL5 is as follows:
//+------------------------------------------------------------------+
//| Check for Pattern 4.                                             |
//+------------------------------------------------------------------+
bool CSignalBollingerBands::IsPattern_4(ENUM_POSITION_TYPE T)
{  m_bands.Refresh(-1);
   m_close.Refresh(-1);
   if(T == POSITION_TYPE_BUY && Close(StartIndex() + 2) > Base(StartIndex() + 2) && Close(StartIndex() + 1) <= Base(StartIndex() + 1) && Close(StartIndex()) > Base(StartIndex()))
   {  return(true);
   }
   else if(T == POSITION_TYPE_SELL && Close(StartIndex() + 2) < Base(StartIndex() + 2) && Close(StartIndex() + 1) >= Base(StartIndex() + 1) && Close(StartIndex()) < Base(StartIndex()))
   {  return(true);
   }
   return(false);
}
Testing with similar environment settings as above gives us the following results:
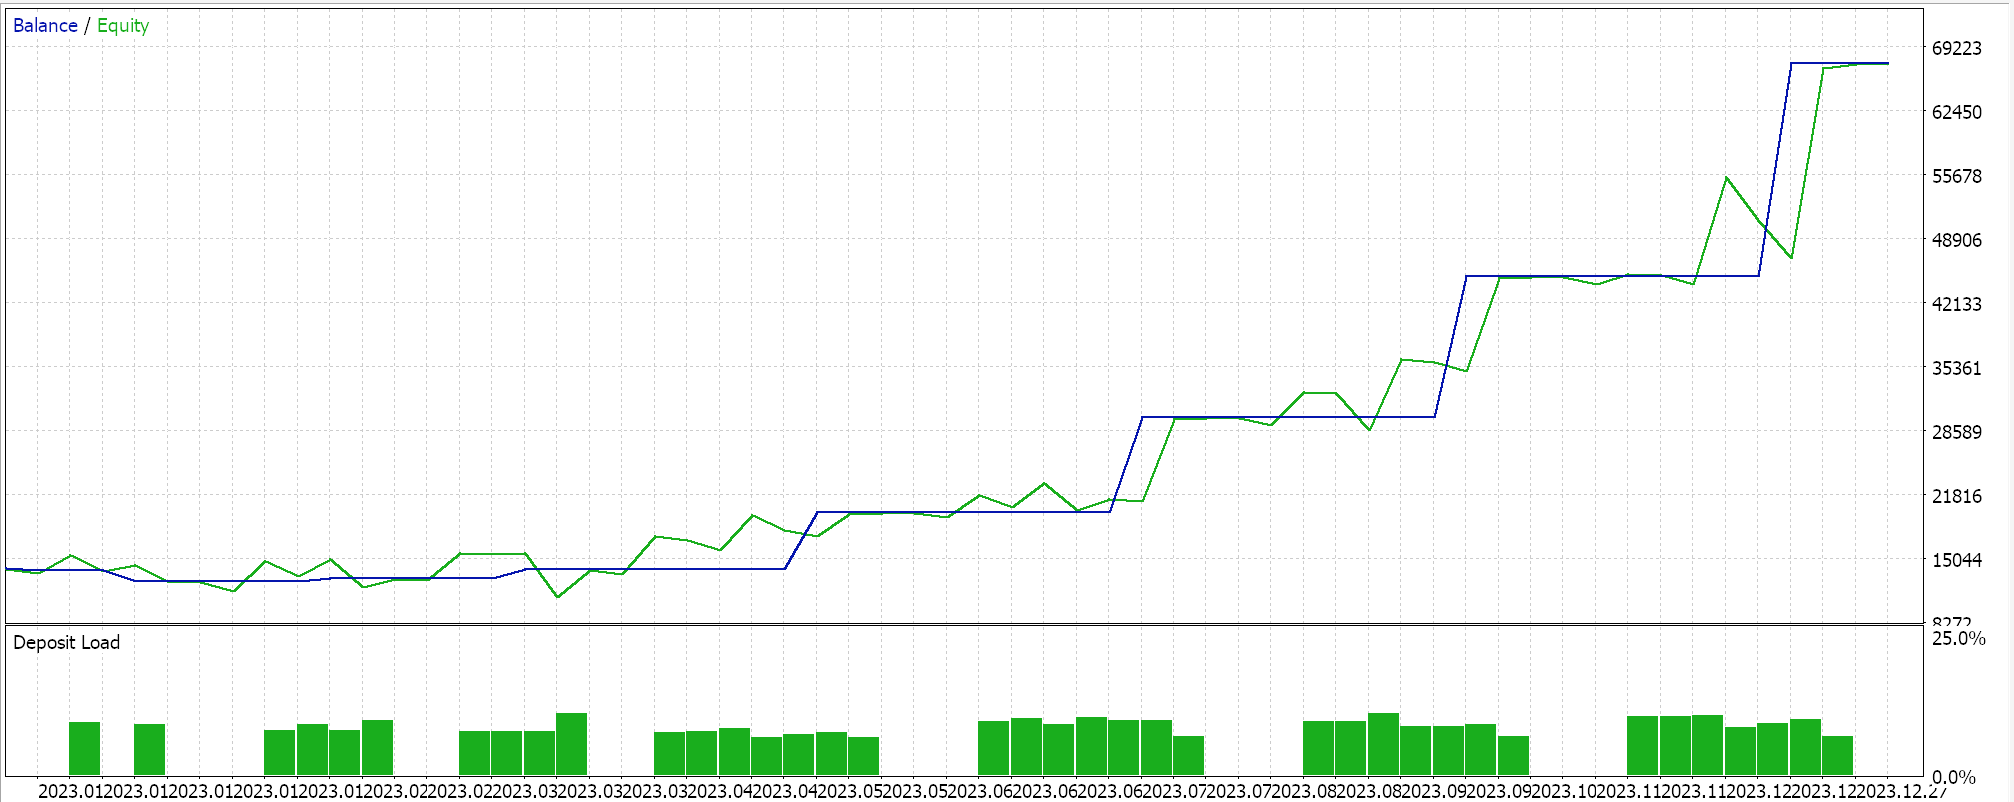
Our Bollinger Bands indicator uses the same settings throughout all the test runs in this article, where the indicator period is 20 and the deviation is 2.
Volume Divergence at Lower Band or Upper Band
Up next is our sixth pattern, which looks to track divergences between volume and volatility. Now a lot of traders, especially on this platform, trade the forex pairs and these rarely have reliable volume data due to the difficulties in integrating this information across multiple brokerages. So, when tracking or measuring volume in implementing this we use, arguably, the next best proxy. Price bar range. Arguments for using this are that when a lot of buyers are bid a given pair, that pair is bound to move a lot in the direction of the bid. This, of course, is not entirely true as an equally large number of short contracts on the other end of this action could inhibit the price move and yet, the total volume involved would not be reflected in the resulting price range of the bar.
So, it’s simply a compromise. We interpret a bullish signal when the price bar range decreases systematically for 3 consecutive price bars, while at the same time the close price is at or below the lower band of the Bollinger Bands. Similarly, we will have a bearish signal when there is a drop-in price bar range for 3 bars and the close price is at or above the upper bands buffer. The reasoning behind this could be to do with the exhaustion of prior trends, where the drop in ‘volume’ at the extreme end of a price range does indicate either a reversal or at least a pullback. This is implemented in MQL5 as follows:
//+------------------------------------------------------------------+
//| Check for Pattern 5.                                             |
//+------------------------------------------------------------------+
bool CSignalBollingerBands::IsPattern_5(ENUM_POSITION_TYPE T)
{  m_bands.Refresh(-1);
   m_close.Refresh(-1);
   m_high.Refresh(-1);
   m_low.Refresh(-1);
   if(Range(StartIndex()) < Range(StartIndex() + 1) && Range(StartIndex() + 1) < Range(StartIndex() + 2))
   {  if(T == POSITION_TYPE_BUY && fabs(m_close.GetData(StartIndex()) - Lower(StartIndex())) < fabs(m_close.GetData(StartIndex()) - Base(StartIndex())))
      {  return(true);
      }
      else if(T == POSITION_TYPE_SELL && fabs(m_close.GetData(StartIndex()) - Upper(StartIndex())) < fabs(m_close.GetData(StartIndex()) - Base(StartIndex())))
      {  return(true);
      }
   }
   return(false);
}
Its test runs with just this pattern, using similar run environment settings as in previous tests, give us the following results:
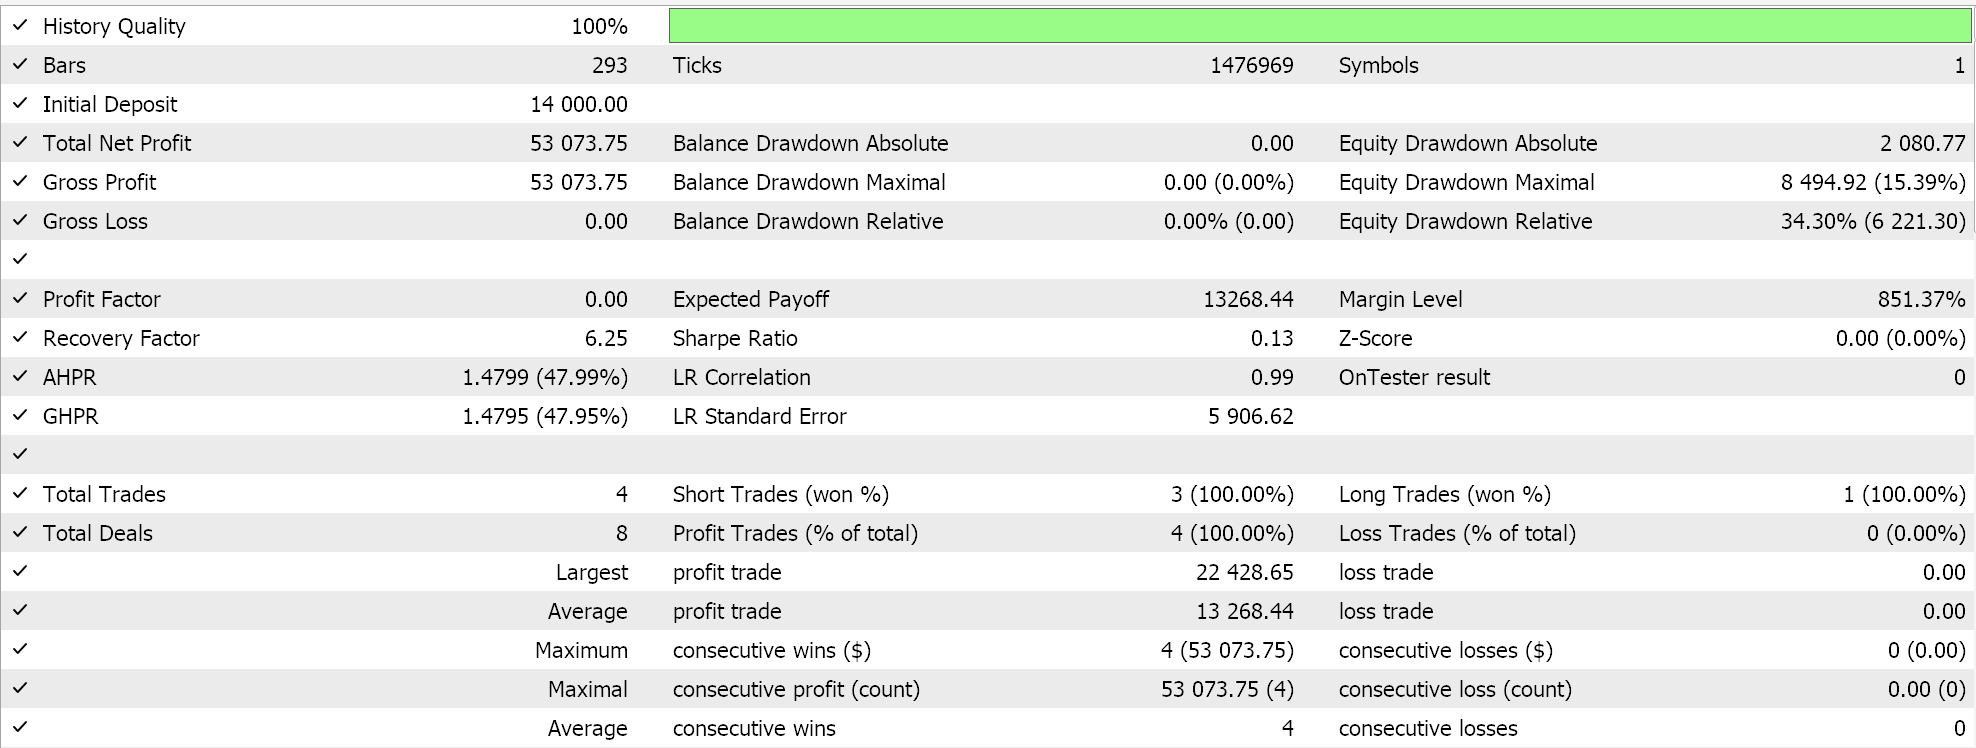
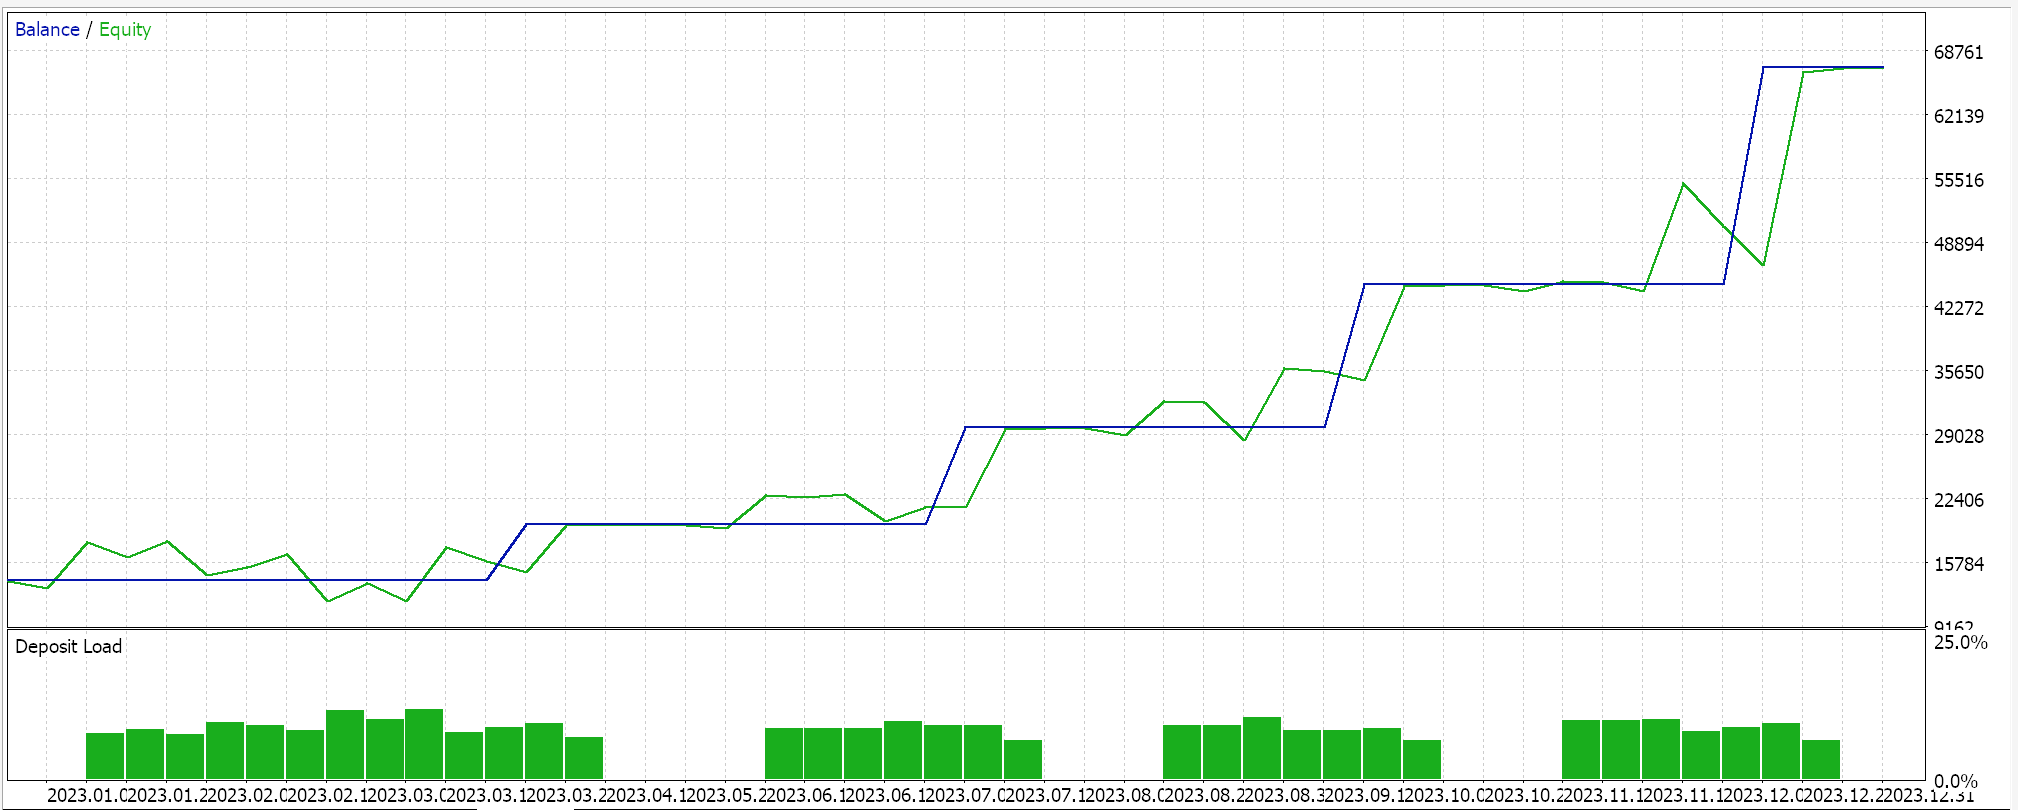
Conclusion
I had intended to cover all 8 patterns of the Bollinger Bands indicator, as indicated in the attached code, but this article has turned out to be a bit too lengthy. Therefore, I will cover the rest in a follow-up article soon.
To conclude, though, we have examined 5 of at least 8 signal patterns one can use when trading with the Bollinger Bands. This indicator not only captures price’s general trend but also tracks volatility thanks to its two outer band buffers. When this information is married with market psychology, as we have seen, an assortment of signals can be generated from this one indicator. While each of these patterns can be used solo as we have done in this article because it had to be cut short, the input parameter of patterns used can actually allow the multiple selection of patterns so that they can be combined and optimized to come up with a more dynamic setup that can better fit different types of markets Hopefully we will cover this and much more in the next article.
 Creating an MQL5-Telegram Integrated Expert Advisor (Part 6): Adding Responsive Inline Buttons
 Two-sample Kolmogorov-Smirnov test as an indicator of time series non-stationarity
 How to Implement Auto Optimization in MQL5 Expert Advisors
 Applying Localized Feature Selection in Python and MQL5
- Free trading apps
- Over 8,000 signals for copying
- Economic news for exploring financial markets
You agree to website policy and terms of use
Nice work!!! Can you share the set file for these results?
No, I do not keep these. They are too specific.
Thanks Stephen for this good article.