
MQL5 Wizard Techniques you should know (Part 40): Parabolic SAR
Introduction
We continue these series that look at the different trade setups and ideas that can be exploited and tested rapidly thanks to the MQL5 wizard. In the last 2 articles we have focused on the very basic indicators and oscillators such as those that come with the wizard classes in the IDE. In doing so, we exploited the various patterns each of the considered indicators can provide, tested it independently and also optimized for settings that use a selection of multiple patterns so we could compare test results of independent pattern runs against a collective, or optimized setting.
We stick to this format for this article, where we go over pattern by pattern for the parabolic SAR before concluding with a test run that combines multiple patterns as we did in the last articles. The parabolic SAR is computed almost independently with each new bar, since some of the parameters that go into its formula need to be adjusted, as we will see below. This trait, though, makes it very sensitive to price changes and trends in general, which in turn makes the case for its use within a custom signal class. For this article, we are going to explore 10 separate patterns of this indicator by testing each independently and then concluding, as in the recent articles, with a test run that combines a selection of these patterns.
The source code attached at the end of this article is meant to be used in an MQL5 wizard to assemble an Expert Advisor that uses it. There is guidance here and here on how to do that for readers that are new.
Defining the Parabolic-SAR
The parabolic SAR is a buffer of values that are offset by the extreme values of the current trend in increasing amounts (or steps) up to a preset threshold. This may sound like a mouthful, but it’s simply a very dynamic way of indicating the current trend and mapping points at which the given trend could reverse. The parabolic SAR formula is very fluid; it is different in bullish and bearish trends. For the bullish we have:
![]()
Where:
- SAR n+1 is the SAR value for the next period.
- SAR n is the current SAR value.
- EP (Extreme Point) is the highest price in the current trend.
- α is the acceleration factor (AF), which typically starts at 0.02 and increments by 0.02 each time a new EP is reached, with a maximum of 0.20 (this can vary depending on user settings).
It is also worth noting that in an uptrend:
- EP is the highest high since the trend began.
- The SAR value will increase as the trend continues, adjusting to trail the price movement.
And for the bearish, we have:
![]()
Where:
- EP is the lowest price in the current downtrend.
Equally noteworthy, in a downtrend:
- EP is the lowest low since the trend began.
- The SAR value will decrease over time, following the downward trend.
So as a trend progresses, the increments or decrements (as in a bearish case) to the SAR, tend to compress it towards the prices, which in turn makes a flip or a change in the trend more imminent. Implementation of this in MQL5 is handled by inbuilt indicators and standard library classes, so for this article we will simply be referring to these. Let’s now delve into the different patterns that the SAR has to offer.
Reversal Gap Crossover
Our first pattern, 0, is the gap crossover, where the indicator dots of the SAR switch sides from either being above the price highs to being below the lows in the event of a bullish gap or from being below the lows to being above the highs in a bearish gap. Often, the size of the gap between the parabolic SAR dots and the closest price point (which would be a low price for the bullish gap or a high price for the bearish gap) is indicative of the strength of the signal. The wider this gap is, the stronger the new trend.
Market macro conditions, though, should also be taken into account since these gap crossovers can happen quite frequently, especially in very volatile markets, which would lead to many false signals. So, one wants to depend more on this signal in markets that have minimal volatility. In instances where the SAR is used in stop-loss adjustment, it is at these crossover points where rather than closing a position, the stop-loss simply gets moved closer to the SAR with actual position closure and reversal depending on another signal.
To implement our pattern 0, in our custom signal class, we use the following function:
//+------------------------------------------------------------------+
//| Check for Pattern 0.                                             |
//+------------------------------------------------------------------+
bool CSignalSAR::IsPattern_0(ENUM_POSITION_TYPE T)
{  if(T == POSITION_TYPE_BUY && Base(StartIndex() + 1) > High(StartIndex() + 1) && Base(StartIndex()) < Low(StartIndex()))
   {  return(true);
   }
   else if(T == POSITION_TYPE_SELL && Base(StartIndex() + 1) < Low(StartIndex() + 1) && Base(StartIndex()) > High(StartIndex()))
   {  return(true);
   }
   return(false);
}
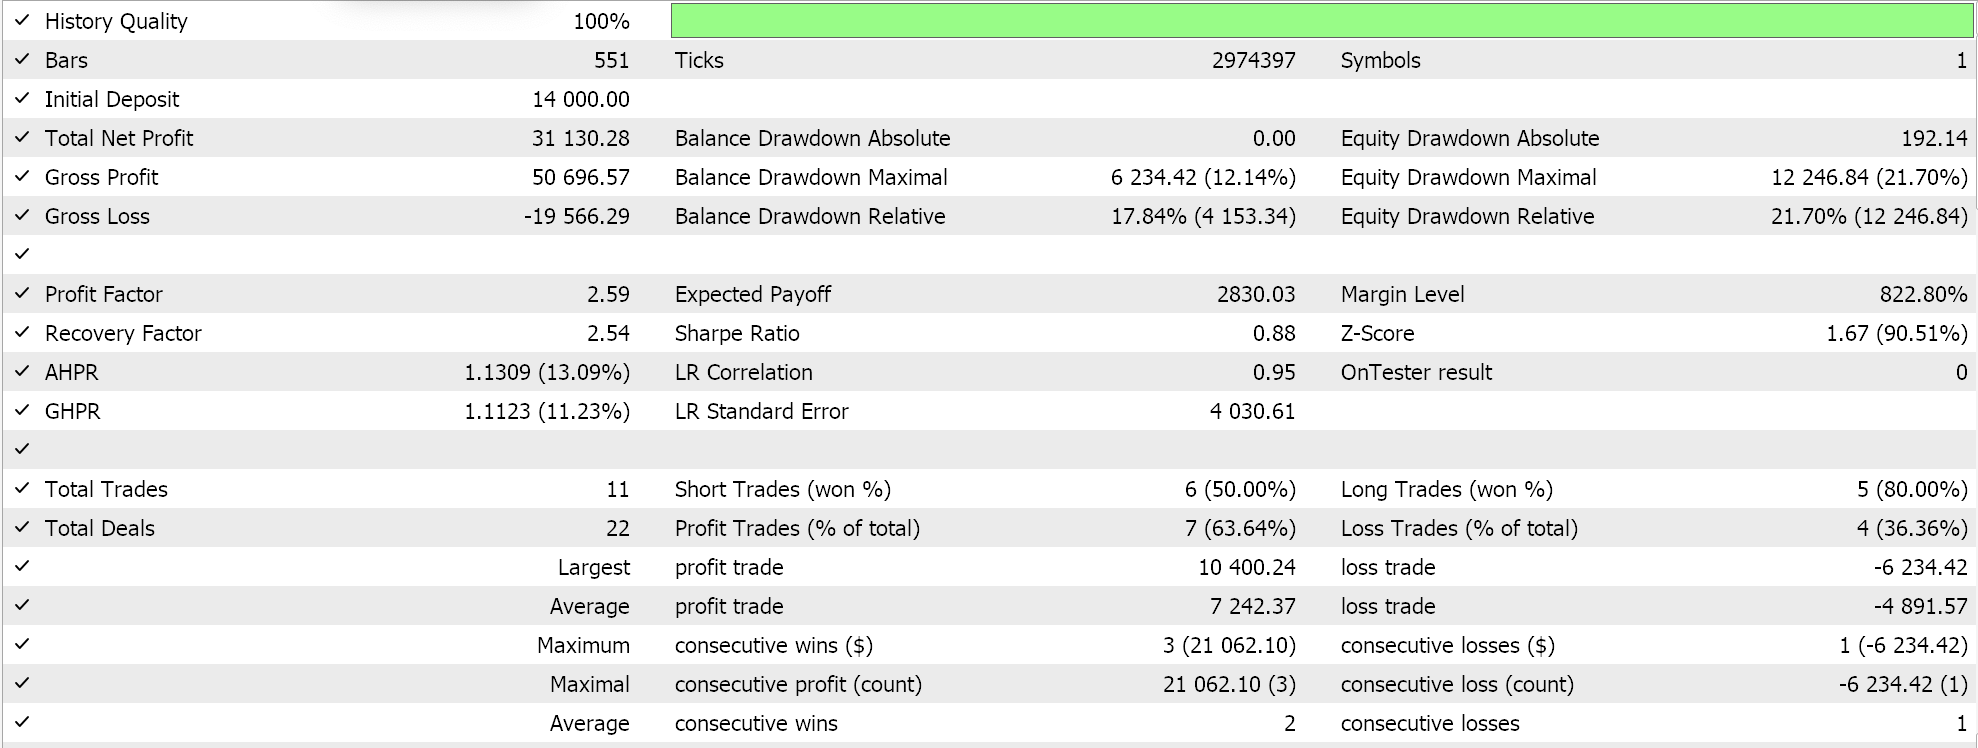
And, test runs for a wizard assembled Expert Advisor that solely uses pattern 0 do give us the following results:

SAR Compression Zone
Our next pattern is the compression zone, and it is arguably a refinement of pattern 0. Its main difference, as the name suggests, is the requirement for a compression in price (which translates to a previous trend of low volatility) prior to the flip in the SAR indicator. As already introduced, the SAR indicates which trend is currently prevalent (between the bullish and bearish) and so if a prior trend has had negligible traction, this can be interpreted as a compression. The quantification of ‘negligible’ might mean we need to add another input parameter to define this value; however, we choose to implement this via a compression function as follows:
bool              Compression(ENUM_POSITION_TYPE T, double &Out)
   {                 Out = 0.0;
                     int _i = StartIndex() + 1, _c = 0;
                     double _last = Base(StartIndex() + 1);
                     double _first = 0.0;
                     if
                     (
                     T == POSITION_TYPE_BUY &&
                     Base(StartIndex()) < Low(StartIndex()) &&
                     Base(_i) < Close(StartIndex()) &&
                     Base(_i) > High(_i)
                     )
                     {  while(Base(_i) > High(_i) && _c < __COMPRESSION_LIMIT)
                        {  _first = Base(_i);
                           _i++;
                           _c++;
                        }
                        if(_c > 0)
                        {  Out = fabs(_first - _last)/_c;
                           return(true);
                        }
                     }
                     else if
                     (
                     T == POSITION_TYPE_SELL &&
                     Base(StartIndex()) > High(StartIndex()) &&
                     Base(_i) > Close(StartIndex()) &&
                     Base(_i) < Low(_i)
                     )
                     {  while(Base(_i) < Low(_i) && _c < __COMPRESSION_LIMIT)
                        {  _first = Base(_i);
                           _i++;
                           _c++;
                        }
                        if(_c > 0)
                        {  Out = fabs(_first - _last)/_c;
                           return(true);
                        }
                     }
                     return(false);
   }
This in turn means our pattern 0 function is handles as follows:
//+------------------------------------------------------------------+
//| Check for Pattern 1.                                             |
//+------------------------------------------------------------------+
bool CSignalSAR::IsPattern_1(ENUM_POSITION_TYPE T)
{  double _compression = 0.0;
   if(Compression(T, _compression))
   {  if(T == POSITION_TYPE_BUY && _compression < 0.02*fabs(Base(StartIndex())-Low(StartIndex())))
      {  return(true);
      }
      else if(T == POSITION_TYPE_SELL && _compression < 0.02*fabs(Base(StartIndex())-High(StartIndex())))
      {  return(true);
      }
   }
   return(false);
}
This function quantifies by how much, in the previous trend, the indicator values kept getting adjusted by. What we are using as our threshold for defining negligible as an input, is what we already have as an input and this is the SAR step input. So, if a step fraction of the initial SAR gap from price, is more than the mean change in the SAR values over the previous trend, then we had a compression. And since the conditions for this pattern are simply a compression and a flip in the trend, we would proceed to open a position in line with pattern 0 trend flip conditions already shared above. Testing with our wizard assembled Expert Advisor, exclusively for pattern 1, does give us the following results:
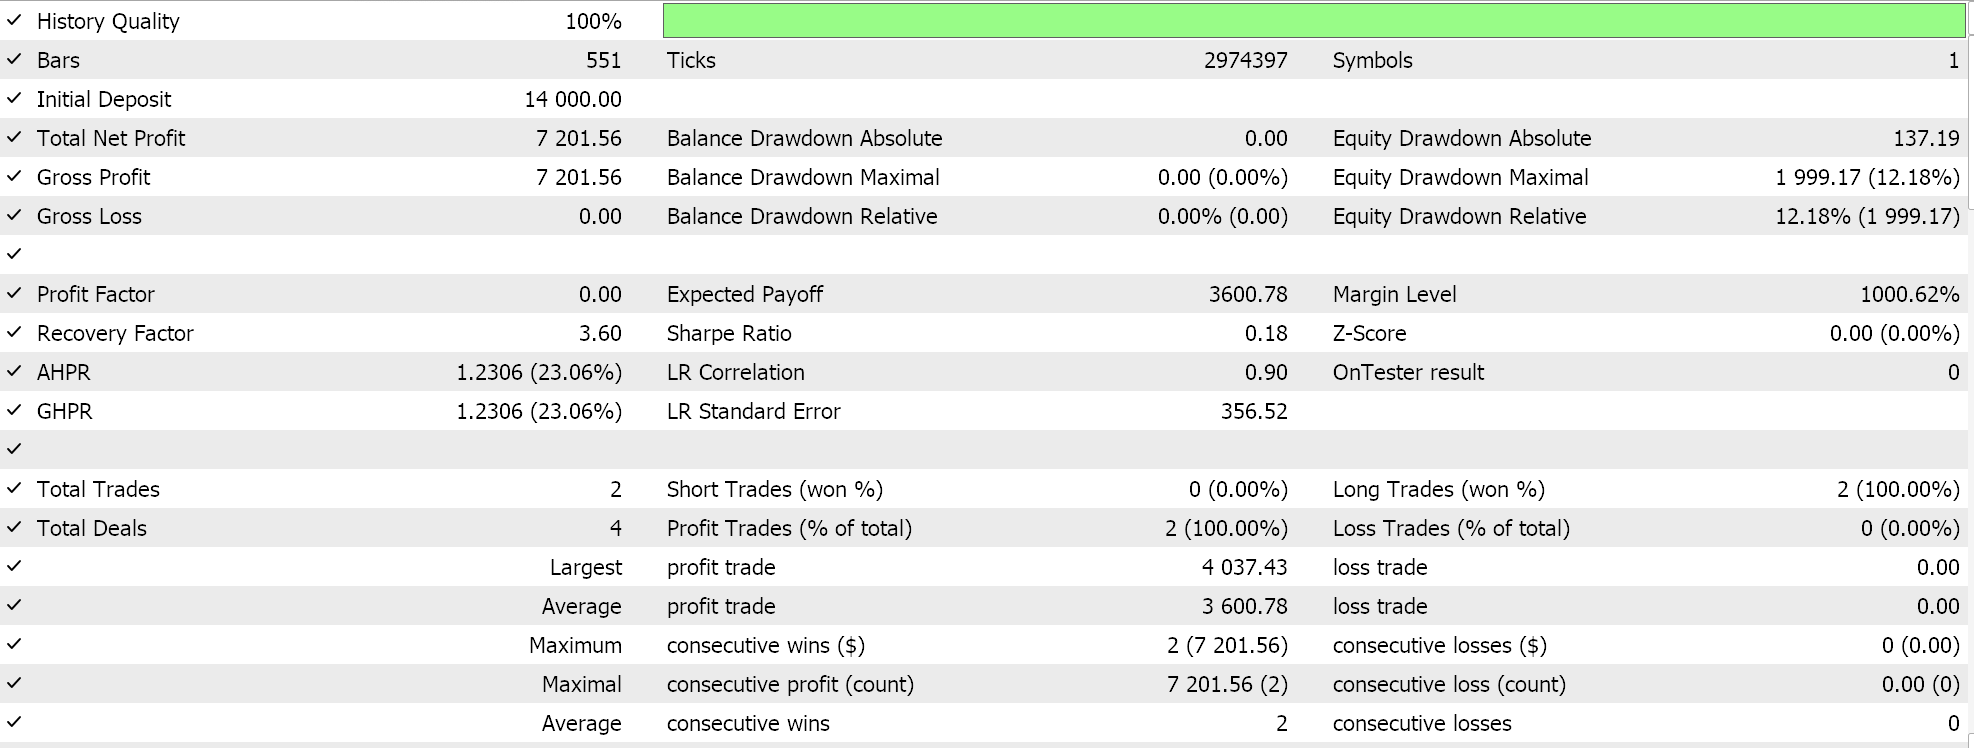
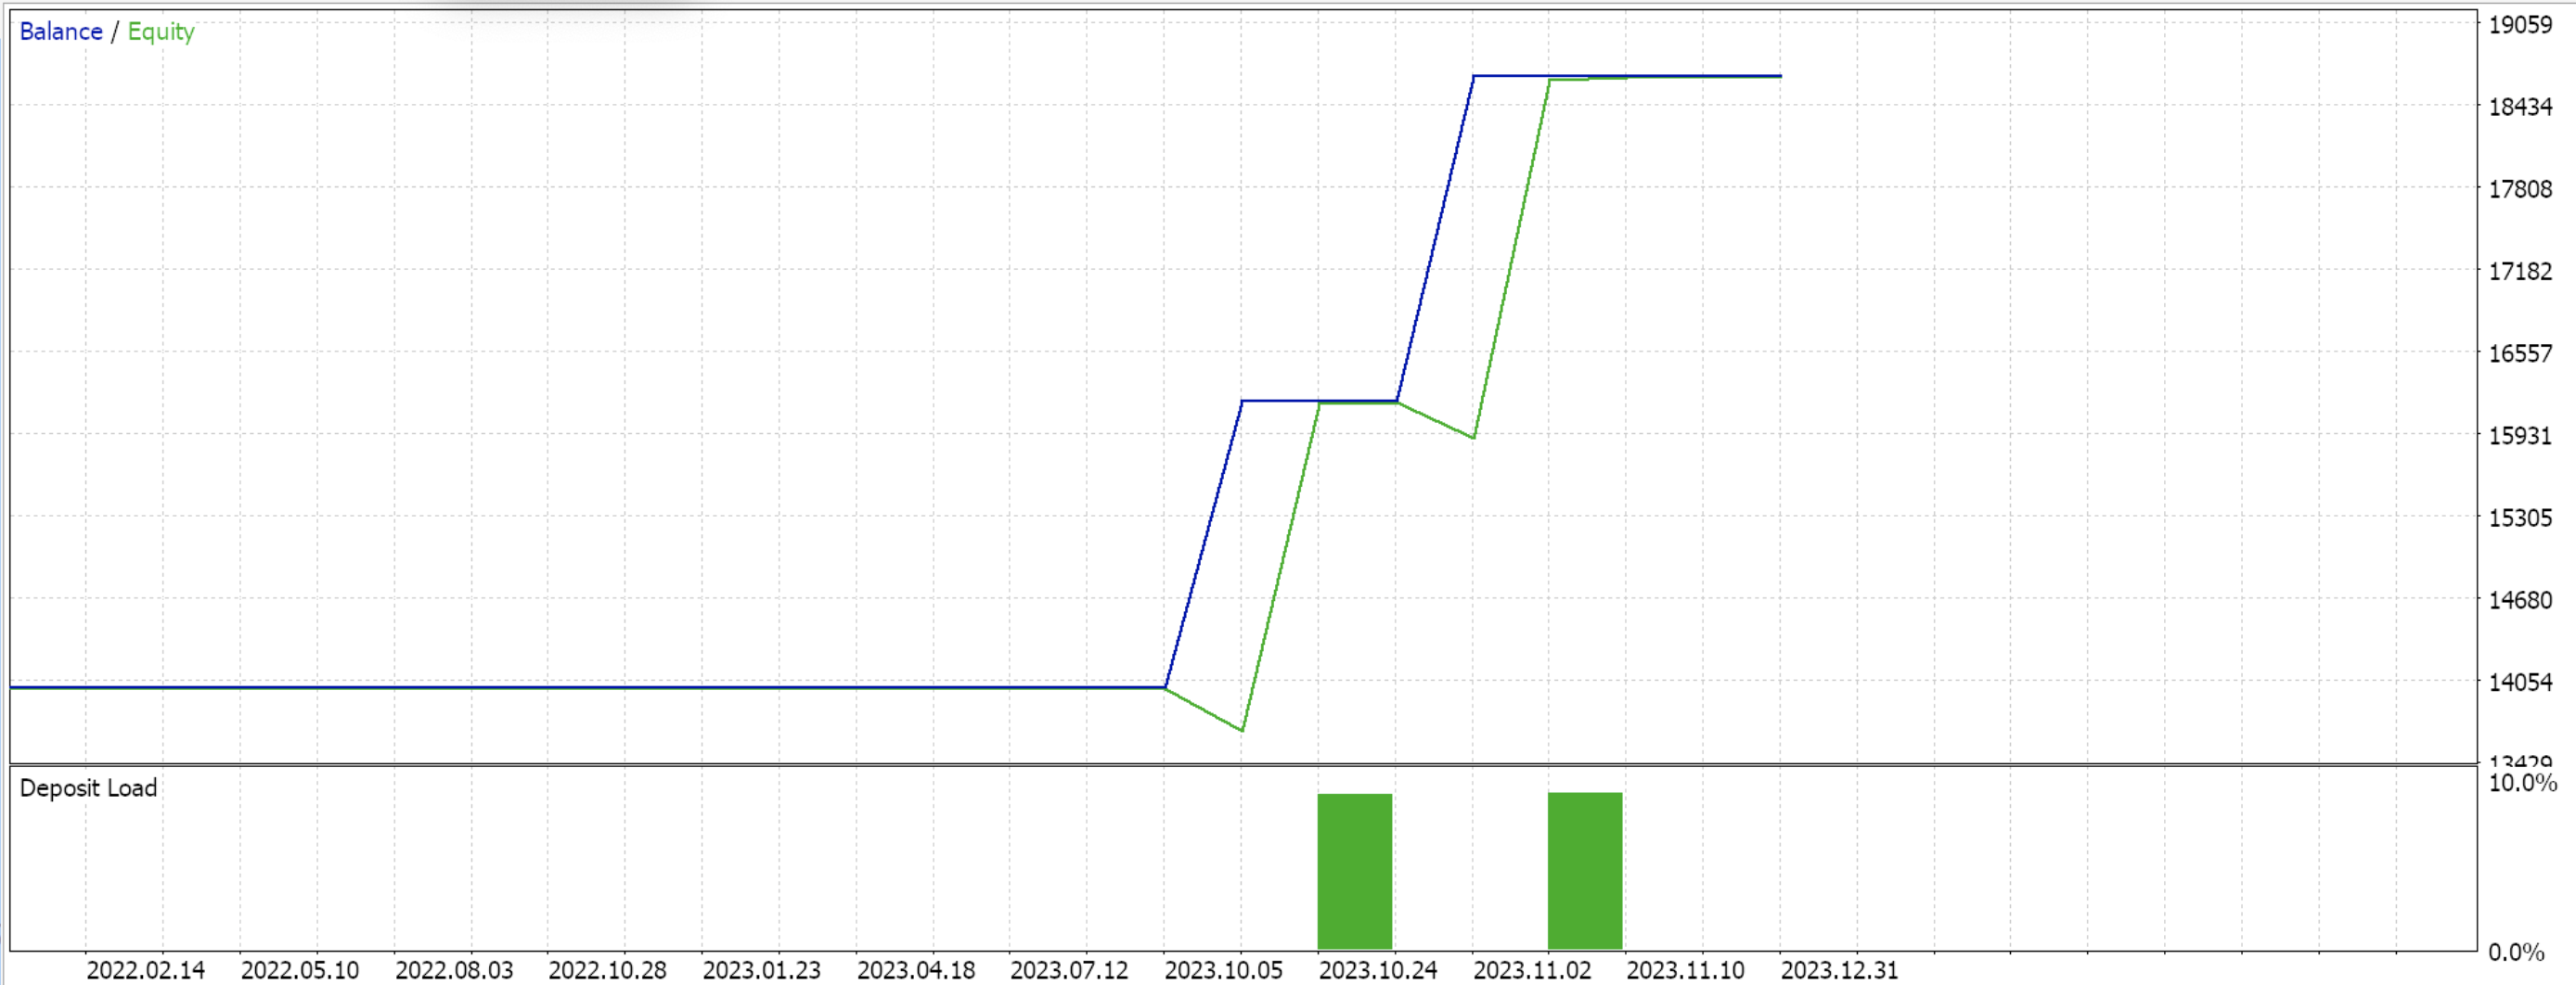
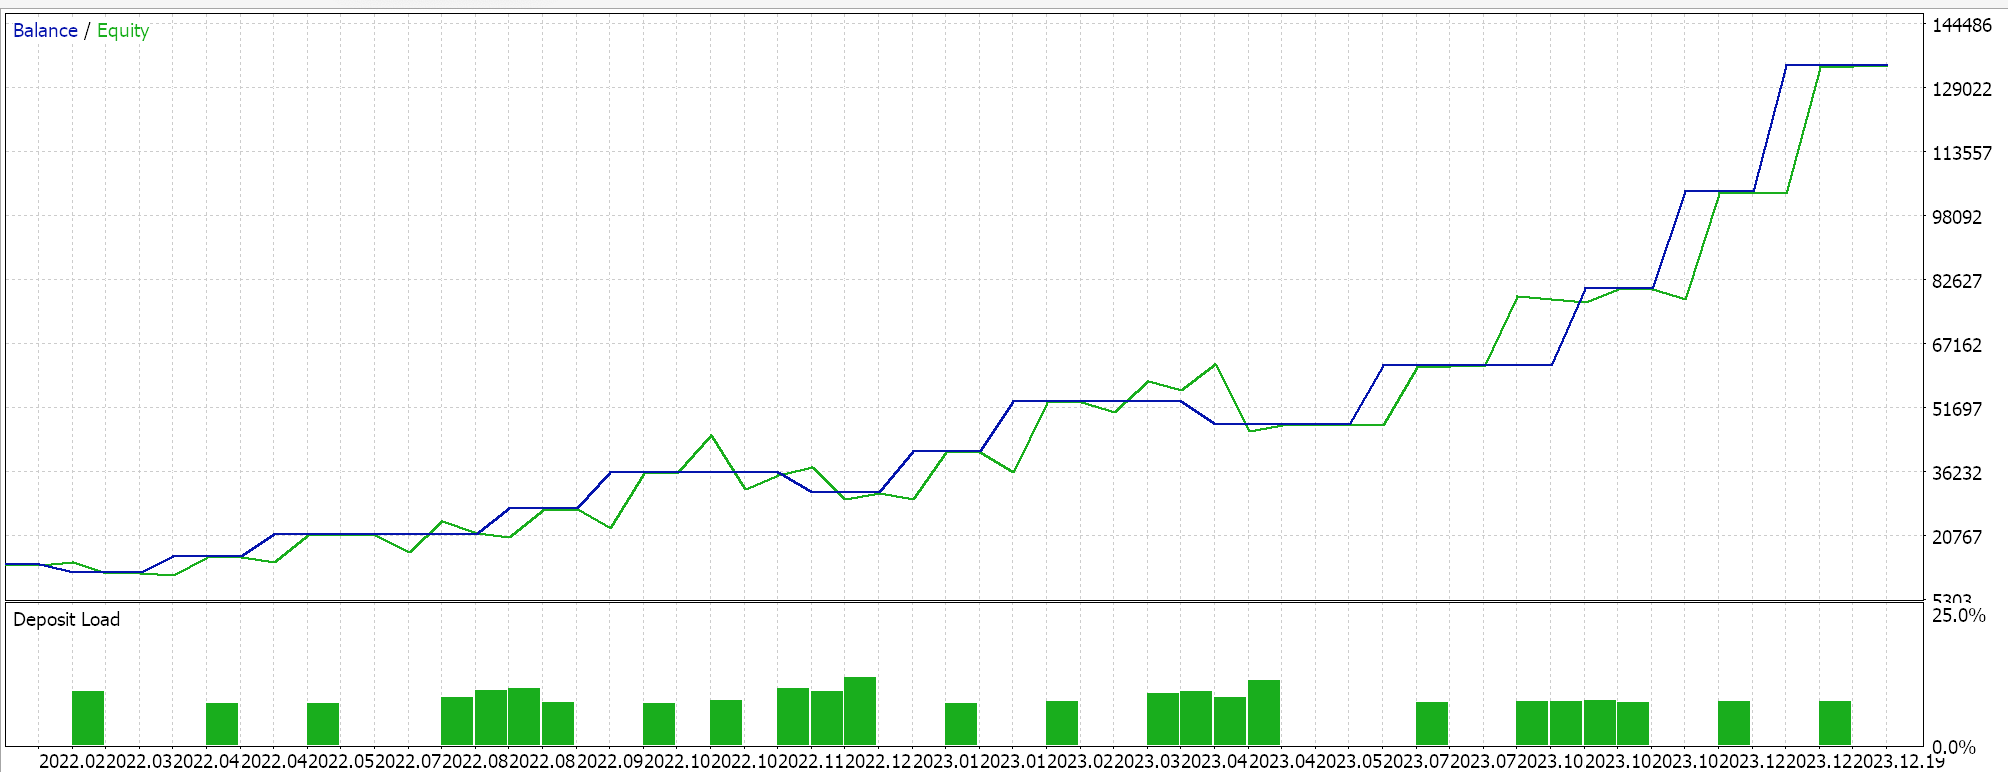
We are testing with the symbol EURJPY for the year 2023, on the daily time frame. Being a compression pattern that we have defined strictly by limiting overall trend by using the step input as our fraction, not a lot of trades get placed. This though can be adjusted by introducing another parameter to moderate this. The input for patterns usage used for this pattern is 2.
Extended Trending SAR
This pattern is a continuation one, which can be taken up in cases where the initial trend flip was subdued, for instance, in cases where the SAR to price gap was very small at the onset. It is pretty straightforward, with a bullish pattern being signified by the widening gap between the SAR dots, while the SAR indicator remains below the low prices and a bearish signal being indicated in the reverse scenario, where the dot gaps also increase while the SAR remains above the high prices. Some could call this a laggard, but it’s always better to test it out first before drawing such conclusions. We implement this as follows in MQL5:
//+------------------------------------------------------------------+
//| Check for Pattern 2.                                             |
//+------------------------------------------------------------------+
bool CSignalSAR::IsPattern_2(ENUM_POSITION_TYPE T)
{  if(T == POSITION_TYPE_BUY &&
   Base(StartIndex()) - Base(StartIndex() + 1) > Base(StartIndex() + 1) - Base(StartIndex() + 2) &&
   Base(StartIndex() + 1) - Base(StartIndex() + 2) > Base(StartIndex() + 2) - Base(StartIndex() + 3) &&
   Base(StartIndex() + 2) - Base(StartIndex() + 3) > Base(StartIndex() + 3) - Base(StartIndex() + 4)
   )
   {  return(true);
   }
   else if(T == POSITION_TYPE_SELL &&
   Base(StartIndex() + 1) - Base(StartIndex()) > Base(StartIndex() + 2) - Base(StartIndex() + 1) &&
   Base(StartIndex() + 2) - Base(StartIndex() + 1) > Base(StartIndex() + 3) - Base(StartIndex() + 2) &&
   Base(StartIndex() + 3) - Base(StartIndex() + 2) > Base(StartIndex() + 4) - Base(StartIndex() + 3)
   )
   {  return(true);
   }
   return(false);
}
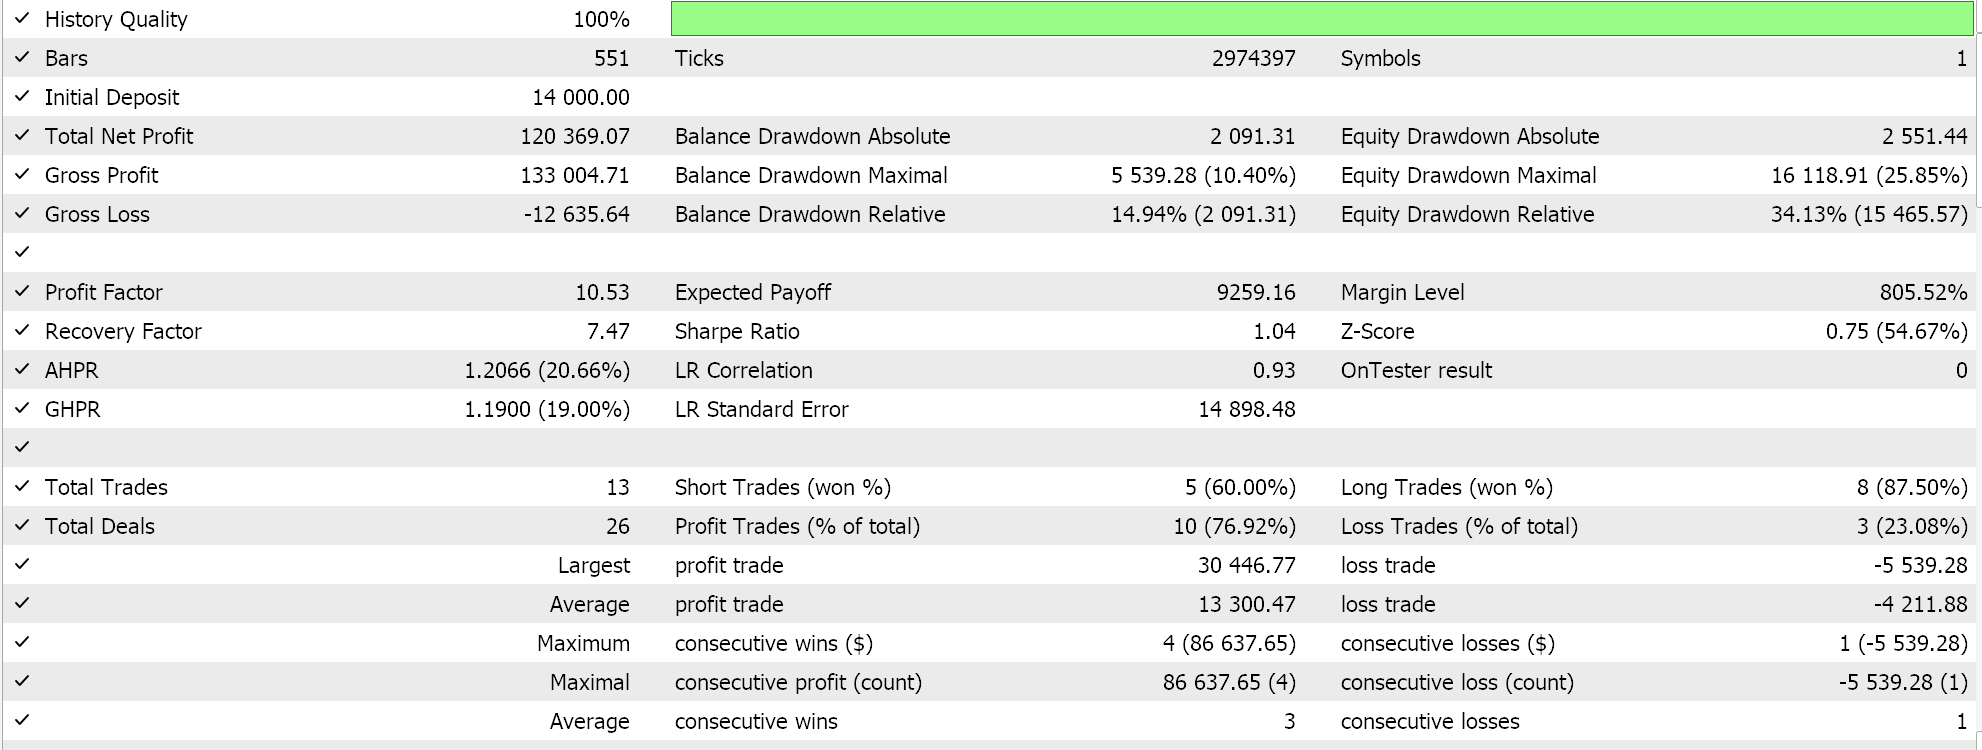
And to test for just this pattern, pattern 2, we would have the input map for patterns used as 4. Testing with just this pattern with the same settings as we have used above, we get the following results:
SAR Flip Fake-Out
This pattern, as the name suggests, refers to a change to a new trend that is almost immediately flipped by reverting to the prior. This often is signified by one or two-dot trends on the SAR price chart, with the trend that follows these dot(s) while being on their opposite side indicating what traders should focus on. So, for a bullish signal, one would have a regular bullish trend followed by a flip that is characterized by lasting only 1–2 price bars and then a resumption of the long trend, with the signal being the resumption of the trend. Similarly, the bearish pattern would start with a downtrend that briefly flips bullish over one or two price bars before resuming a downward descent. We would code this pattern as follows:
//+------------------------------------------------------------------+
//| Check for Pattern 3.                                             |
//+------------------------------------------------------------------+
bool CSignalSAR::IsPattern_3(ENUM_POSITION_TYPE T)
{  if(T == POSITION_TYPE_BUY && Base(StartIndex()) < Low(StartIndex()) && Base(StartIndex() + 1) > High(StartIndex() + 1) && Base(StartIndex() + 2) < Low(StartIndex() + 2))
   {  return(true);
   }
   else if(T == POSITION_TYPE_SELL && Base(StartIndex()) > High(StartIndex()) && Base(StartIndex() + 1) < Low(StartIndex() + 1) && Base(StartIndex() + 2) > High(StartIndex() + 2))
   {  return(true);
   }
   return(false);
}
This being our 4th pattern that we index as pattern 3 means to place trades while solely relying on its signals, our input map for patterns used would have to be 8. The test runs with similar settings as the above for this pattern were run over the test period, and no trades were placed, so no results can be shared. Nonetheless, the common causes of these flip-fake-outs are your usual suspects: choppy/ sideways markets, low volatility, or market noise. The impact of this on non-suspecting traders can be drastic, which is why secondary indicators (like MACD), price action analysis (for support & resistance), or volume analysis (if this information is available) can help with this. With that said, this signal should be more reliable than a single flip, such as pattern 0.
Double SAR Flip with Trend Continuation
This pattern, is our pattern 3 plus 2 more flips. It results in a continuation just like pattern 3, and in the same way that it can be argued that pattern 3 is stronger than pattern 0, this pattern, 4, is more reliable or stronger than pattern 3. We have provided a code implementation of this as indicated below, however we are not running tests for it and are leaving this to the reader for further exploration, which should ideally require a testing period beyond the 1-year window we are considering. Since no trades were placed for pattern 3 in 2023 for EURJPY on the daily, we do not expect any signals and therefore trades for pattern 4.
//+------------------------------------------------------------------+
//| Check for Pattern 4.                                             |
//+------------------------------------------------------------------+
bool CSignalSAR::IsPattern_4(ENUM_POSITION_TYPE T)
{  if(T == POSITION_TYPE_BUY &&
   Base(StartIndex()) < Low(StartIndex()) &&
   Base(StartIndex() + 1) > High(StartIndex() + 1) &&
   Base(StartIndex() + 2) < Low(StartIndex() + 2) &&
   Base(StartIndex() + 3) > High(StartIndex() + 4) &&
   Base(StartIndex() + 4) < Low(StartIndex() + 5)
   )
   {  return(true);
   }
   else if(T == POSITION_TYPE_SELL &&
   Base(StartIndex()) > High(StartIndex()) &&
   Base(StartIndex() + 1) < Low(StartIndex() + 1) &&
   Base(StartIndex() + 2) > High(StartIndex() + 2) &&
   Base(StartIndex() + 3) < Low(StartIndex() + 4) &&
   Base(StartIndex() + 4) > High(StartIndex() + 5)
   )
   {  return(true);
   }
   return(false);
}
SAR Divergence with Moving Average
Pattern 5, stems from divergence. Because the divergences between prices and the SAR are quite common, the moving average indicator serves as a confirmation. So, for a bullish signal, the price would be dropping towards the SAR while the SAR is also rising with the moving average being below or equal to the SAR. Conversely, for the bearish pattern, price would be rising on a falling SAR with the moving average still above or equal to both. The number of steps required to measure a rise or decline can be determined at discretion (or from testing) however for our purposes we are simply taking these as three. We, therefore implement the function that calls these patterns as follows:
//+------------------------------------------------------------------+
//| Check for Pattern 5.                                             |
//+------------------------------------------------------------------+
bool CSignalSAR::IsPattern_5(ENUM_POSITION_TYPE T)
{  if(T == POSITION_TYPE_BUY &&
   MA(StartIndex()) <= Base(StartIndex()) &&
   Base(StartIndex()) > Base(StartIndex() + 1) &&
   Base(StartIndex() + 1) > Base(StartIndex() + 2) &&
   Close(StartIndex()) < Close(StartIndex() + 1) &&
   Close(StartIndex() + 1) < Close(StartIndex() + 2)
   )
   {  return(true);
   }
   else if(T == POSITION_TYPE_SELL &&
   MA(StartIndex()) >= Base(StartIndex()) &&
   Base(StartIndex()) < Base(StartIndex() + 1) &&
   Base(StartIndex() + 1) < Base(StartIndex() + 2) &&
   Close(StartIndex()) > Close(StartIndex() + 1) &&
   Close(StartIndex() + 1) > Close(StartIndex() + 2)
   )
   {  return(true);
   }
   return(false);
}
Testing of our Expert Advisor while solely running this patterns gives us the following results:
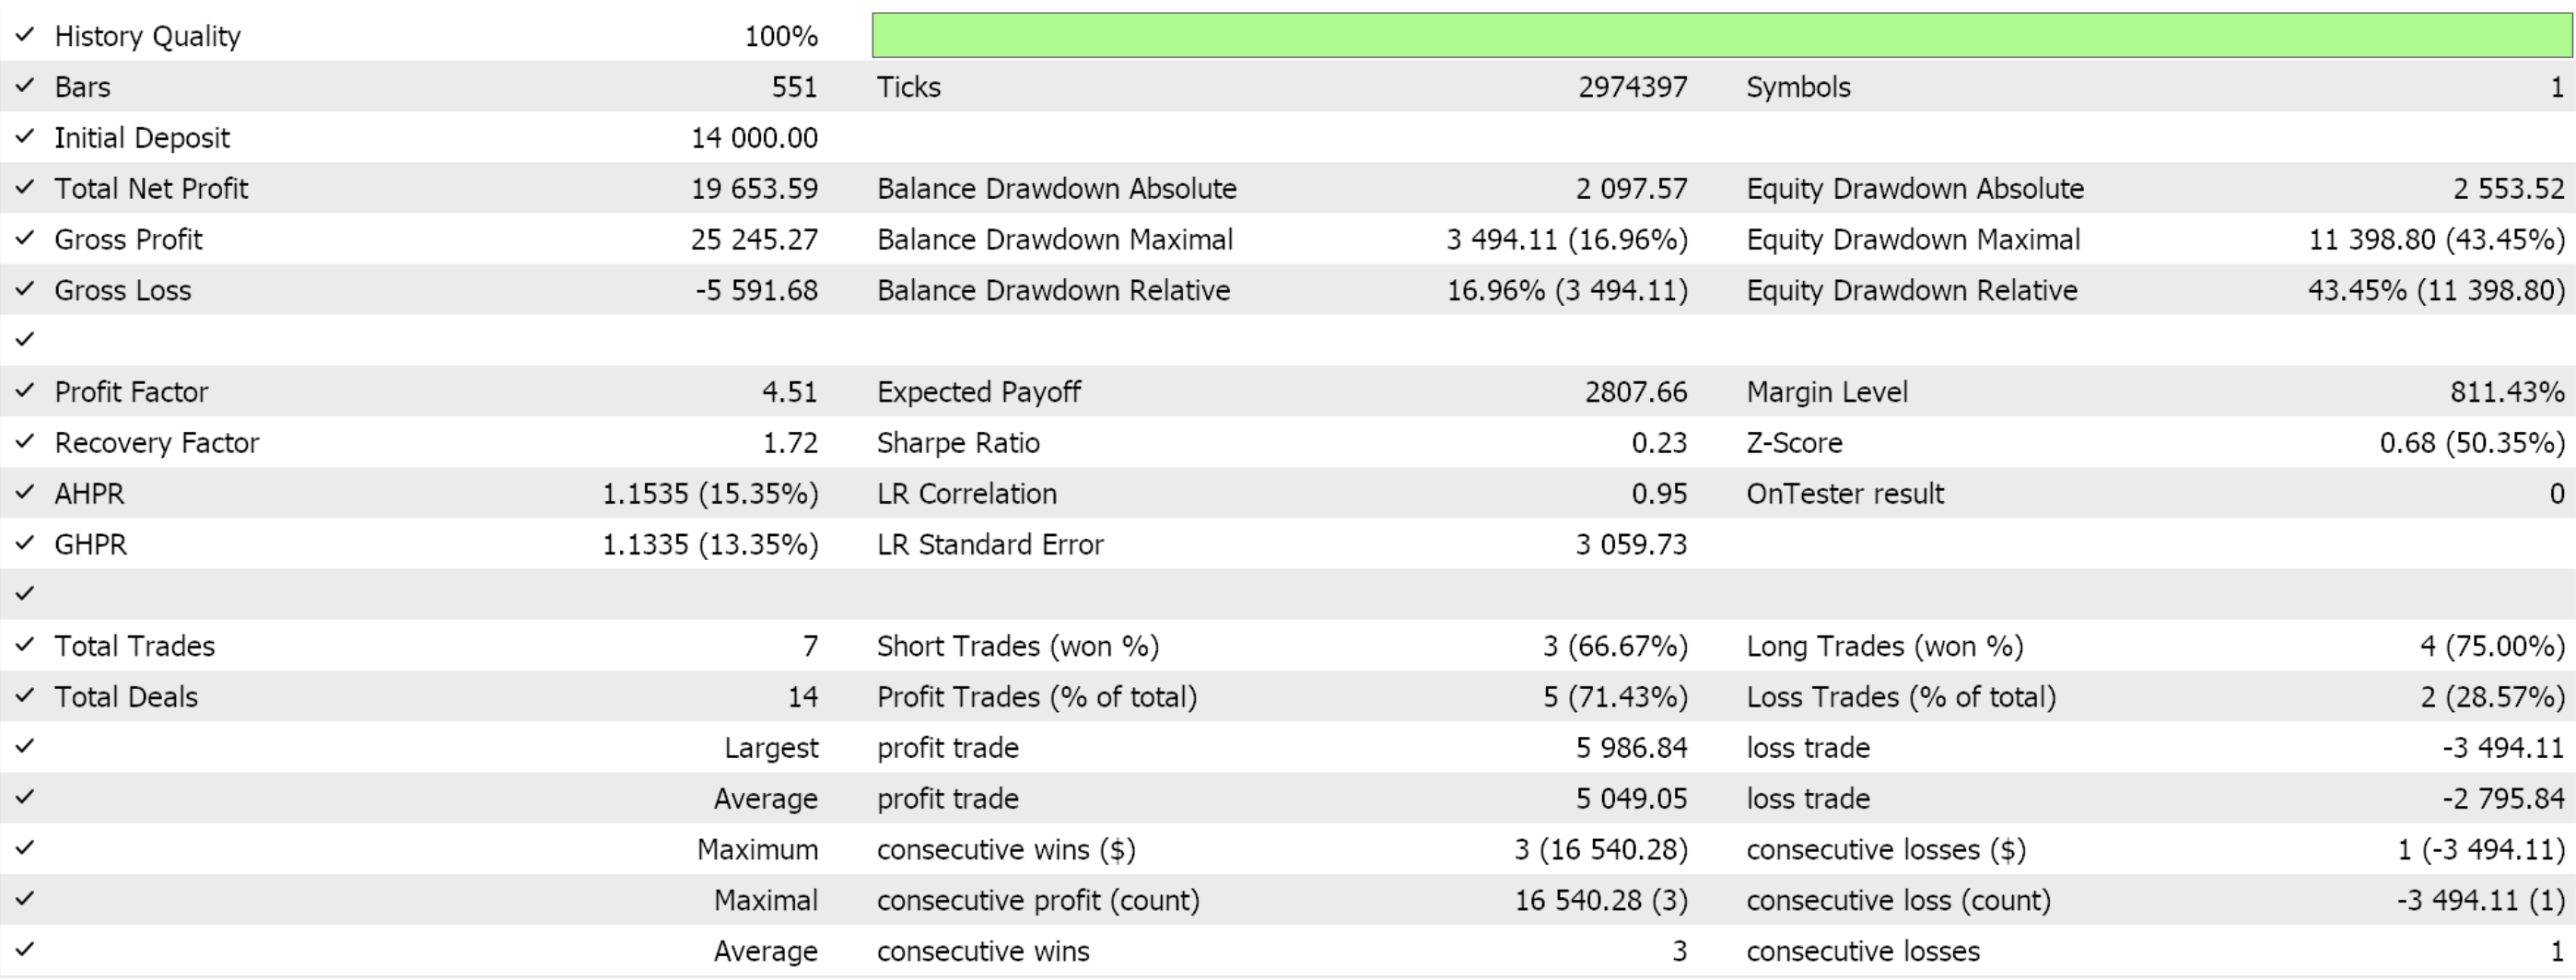
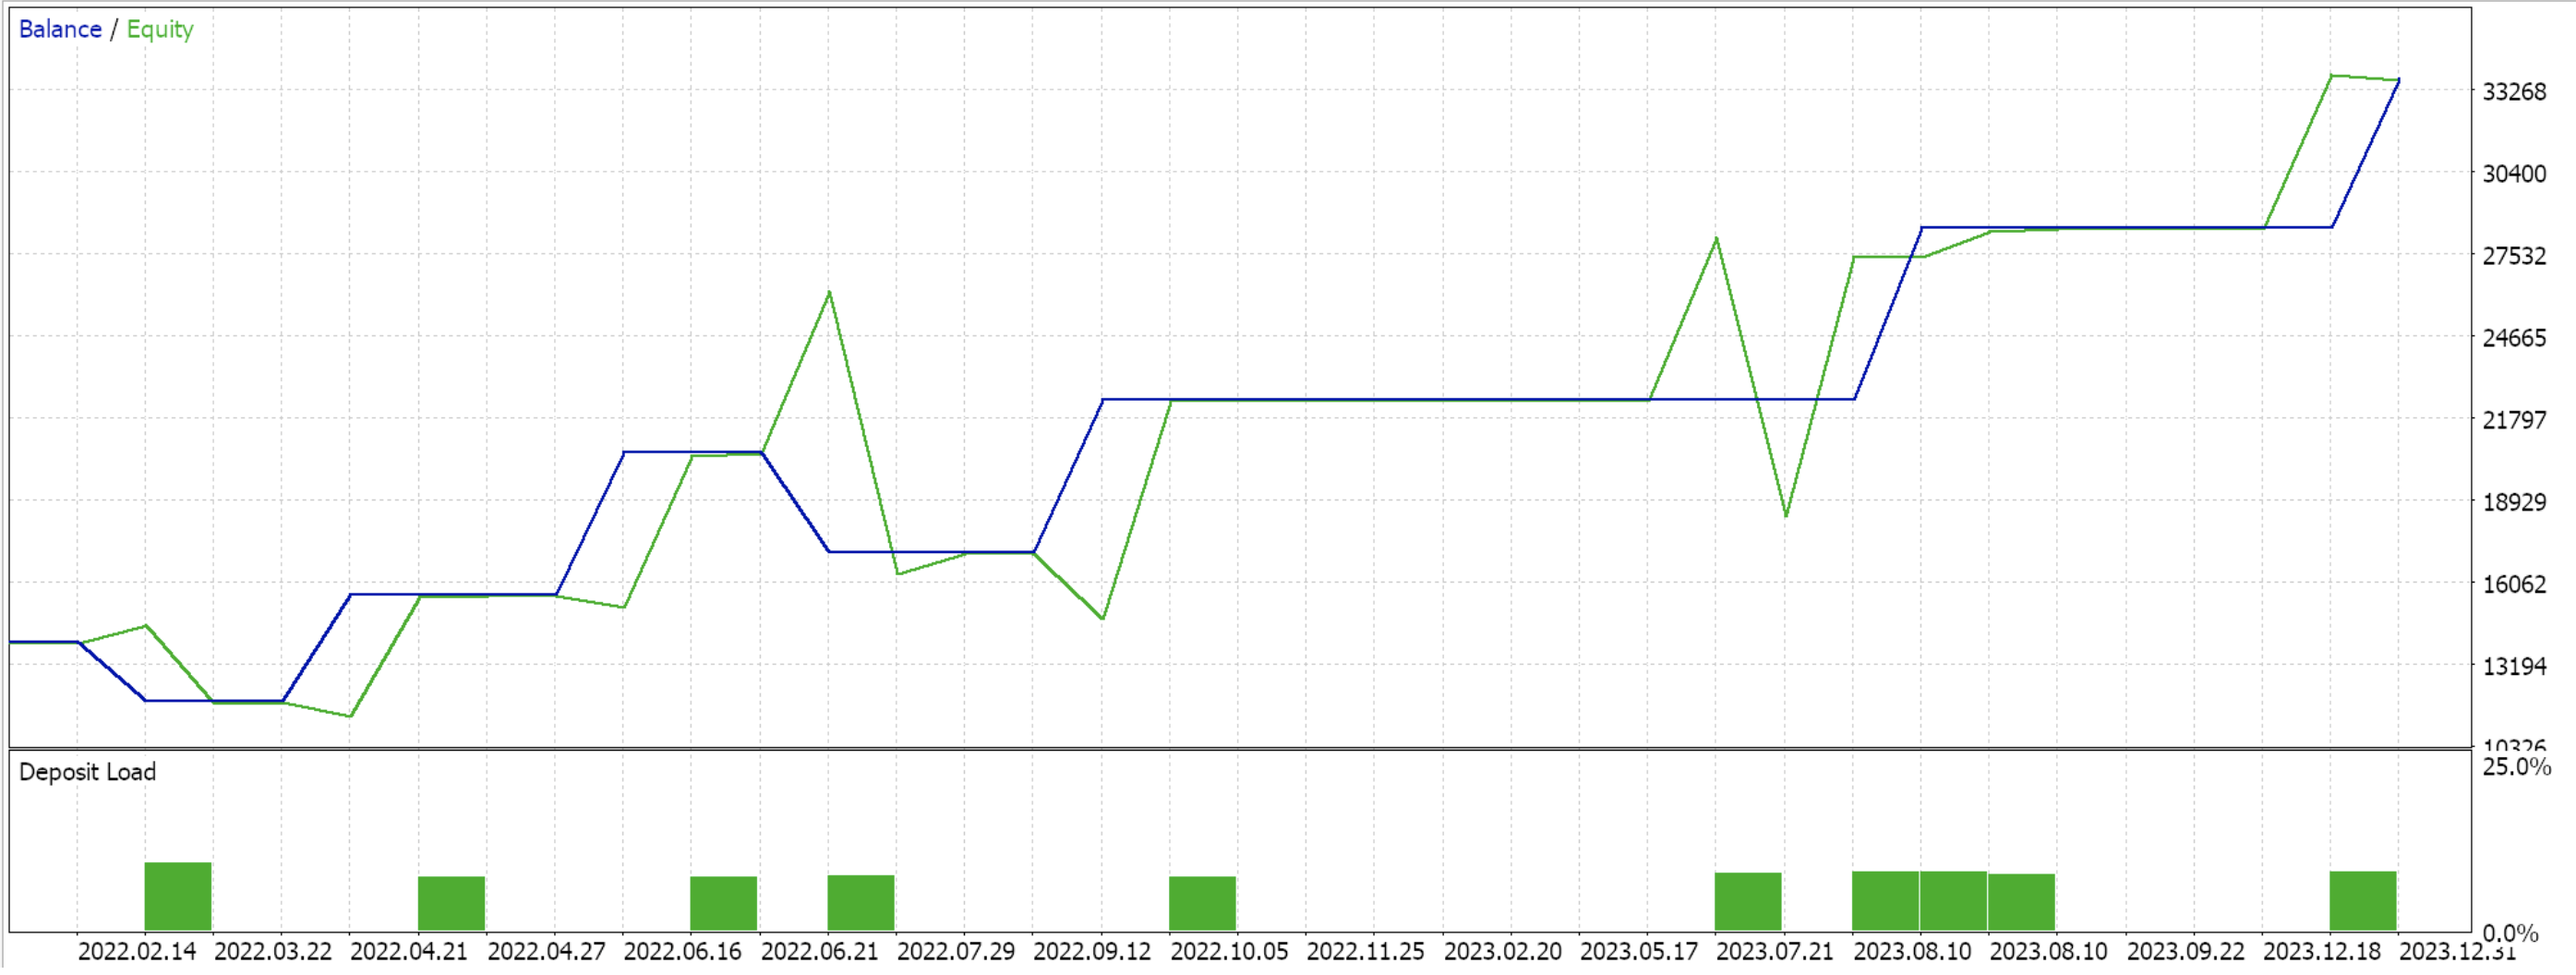
It is worth noting we are dealing with three data buffers here, namely, prices, the moving average, and the SAR. Our chosen deviation from these is between prices and the SAR, however alternative deviations such as between the moving average and the SAR can also be considered. This divergence, though, because of the lagging effects of the moving average, is also bound to be a bit of a laggard when compared to the price-SAR divergence we have implemented for this article. On the flip side, it is also bound to be less noisy, since price-action does produce a lot of action in the short term that often does not become significant over the long run. So, it could have some uses, and the reader is welcome to explore this avenue as well. The input for pattern usage for this pattern is 32.
Parabolic SAR Channeling
The parabolic SAR channeling pattern marries price action with the current SAR trend to generate signals. Price-channels are relatively easy to understand when on a price chart but trying to put that logic into code is often more convoluted than first envisioned. So, off the bat, it may be a good idea to define a rudimentary function that defines the current upper bound and lower bound of a price channel whose range is set by the number of price bars to look at in history. We name this function ‘Channel’ and its logic which is in the interface is shared below:
bool              Channel(ENUM_POSITION_TYPE T)
   {                 vector _max,_max_i;
                     vector _min,_min_i;
                     _max.Init(2);
                     _max.Fill(High(0));
                     _max_i.Init(2);
                     _max_i.Fill(0.0);
                     _min.Init(2);
                     _min.Fill(Low(0));
                     _min_i.Init(2);
                     _min_i.Fill(0.0);
                     for(int i=0;i<m_ma_period;i++)
                     {  if(High(i) > _max[0])
                        {  _max[0] = High(i);
                           _max_i[0] = i;
                        }
                        if(Low(i) < _min[0])
                        {  _min[0] = Low(i);
                           _min_i[0] = i;
                        }
                     }
                     double _slope = (Close(0) - Close(m_ma_period-1))/m_ma_period;
                     double _upper_scale = fabs(_slope);
                     double _lower_scale = fabs(_slope);
                     for(int i=0;i<m_ma_period;i++)
                     {  if(i == _max_i[0])
                        {  continue;
                        }
                        else
                        {  double _i_slope = (High(i) - _max[0])/(i - _max_i[0]);
                           if((_i_slope > 0.0 && _slope > 0.0)||(_i_slope < 0.0 && _slope < 0.0))
                           {  if(fabs(_i_slope-_slope) < _upper_scale)
                              {  _max[1] = High(i);
                                 _max_i[1] = i;
                              }
                           }
                        }
                     }
                     for(int i=0;i<m_ma_period;i++)
                     {  if(i == _min_i[0])
                        {  continue;
                        }
                        else
                        {  double _i_slope = (Low(i) - _min[0])/(i - _min_i[0]);
                           if((_i_slope > 0.0 && _slope > 0.0)||(_i_slope < 0.0 && _slope < 0.0))
                           {  if(fabs(_i_slope-_slope) < _lower_scale)
                              {  _min[1] = Low(i);
                                 _min_i[1] = i;
                              }
                           }
                        }
                     }
                     vector _projections;
                     _projections.Init(4);
                     _projections[0] = _max[0] + (_max_i[0]*_slope);
                     _projections[1] = _min[0] + (_min_i[0]*_slope);
                     _projections[2] = _max[1] + (_max_i[1]*_slope);
                     _projections[3] = _min[1] + (_min_i[1]*_slope);
                     if(T == POSITION_TYPE_BUY && Close(0) < Close(m_ma_period) && Close(0) < _projections.Mean())
                     {  return(true);
                     }
                     else if(T == POSITION_TYPE_SELL && Close(0) > Close(m_ma_period) && Close(0) > _projections.Mean())
                     {  return(true);
                     }
                     return(false);
   }
The primary outputs of this channel will be, given a position type, is the channel indicating a possible reversal? And in order to answer this, we need to first determine which price points define the upper line as well as the lower line. As easy as this is to visibly pick off a regular price chart, in code, one could easily be drawn into relying on fractals. And while this could be made to work if the fractal indicator in use is really good, I found that focusing on the overall slope of the given look-back period does provide a more generalizable solution.
So, to define our channel, first we get a sense of the slope across the look-back period. Our look-back period is set to be equal to that of the period used by the moving average indicator, which was highlighted in pattern 5 above. Readers can create their own secondary parameter to define this, but I always feel the fewer the input parameters, the more generalizable the model. So, once we have the slope, we then need to get the two highs in the defined look-back period that best align with this slope.
Typically, though, the highest point in the look back period is always expected to be along this upper line of the channel, therefore if we start by getting this maximum value, we would then need to comb through all the other highs until we come up with a second, high value such that its slope from our highest point, is most in line with the slope of the overall trend. Here of course the overall trend is the close price change strictly across the look back period.
Once we have these two points, we would do the same thing for the lower bound of the channel again by finding the lowest low and another low that best aligns with the trend’s slope when connected to the lowest point. Two pairs of points define two lines, and therefore, with them, you do have a channel, solely based on the look-back period. When looking at a price chart, one is certainly not going to take such a mechanistic approach, since it is unlikely that a fixed look-back history always has sufficient data points to define this. This is why simply connecting these points and trying to extrapolate from them is bound to generate a lot of wild or random channels. A fixed look-back history often does not capture all the key historical price points for analysis.
That’s why we define our channel as having two and not just one upper and lower bound lines. Each of these lines would go through the 4 points we have already defined above. Our bullish signal with pattern 6 is for the price to be in the bottom half of the channel, with the parabolic SAR also indicating a long trend. Conversely, for the bearish, the price would be in the upper half of the channel, with the SAR indicating a bearish trend. In order to determine which half of the channel our current price is in, we would simply take the mean of all four projection price points. These projections are simply extensions of the lines going through our two high points and two low points up to the current index, while maintaining the same slope of the overall trend. We implement this pattern as follows in MQL5:
//+------------------------------------------------------------------+
//| Check for Pattern 6.                                             |
//+------------------------------------------------------------------+
bool CSignalSAR::IsPattern_6(ENUM_POSITION_TYPE T)
{  if(T == POSITION_TYPE_BUY && Base(StartIndex()) < Low(StartIndex()))
   {  return(Channel(T));
   }
   else if(T == POSITION_TYPE_SELL && Base(StartIndex()) > High(StartIndex()))
   {  return(Channel(T));
   }
   return(false);
}
And testing with the same settings we are using above of EURJPY on the daily for 2023 do give us the following results:
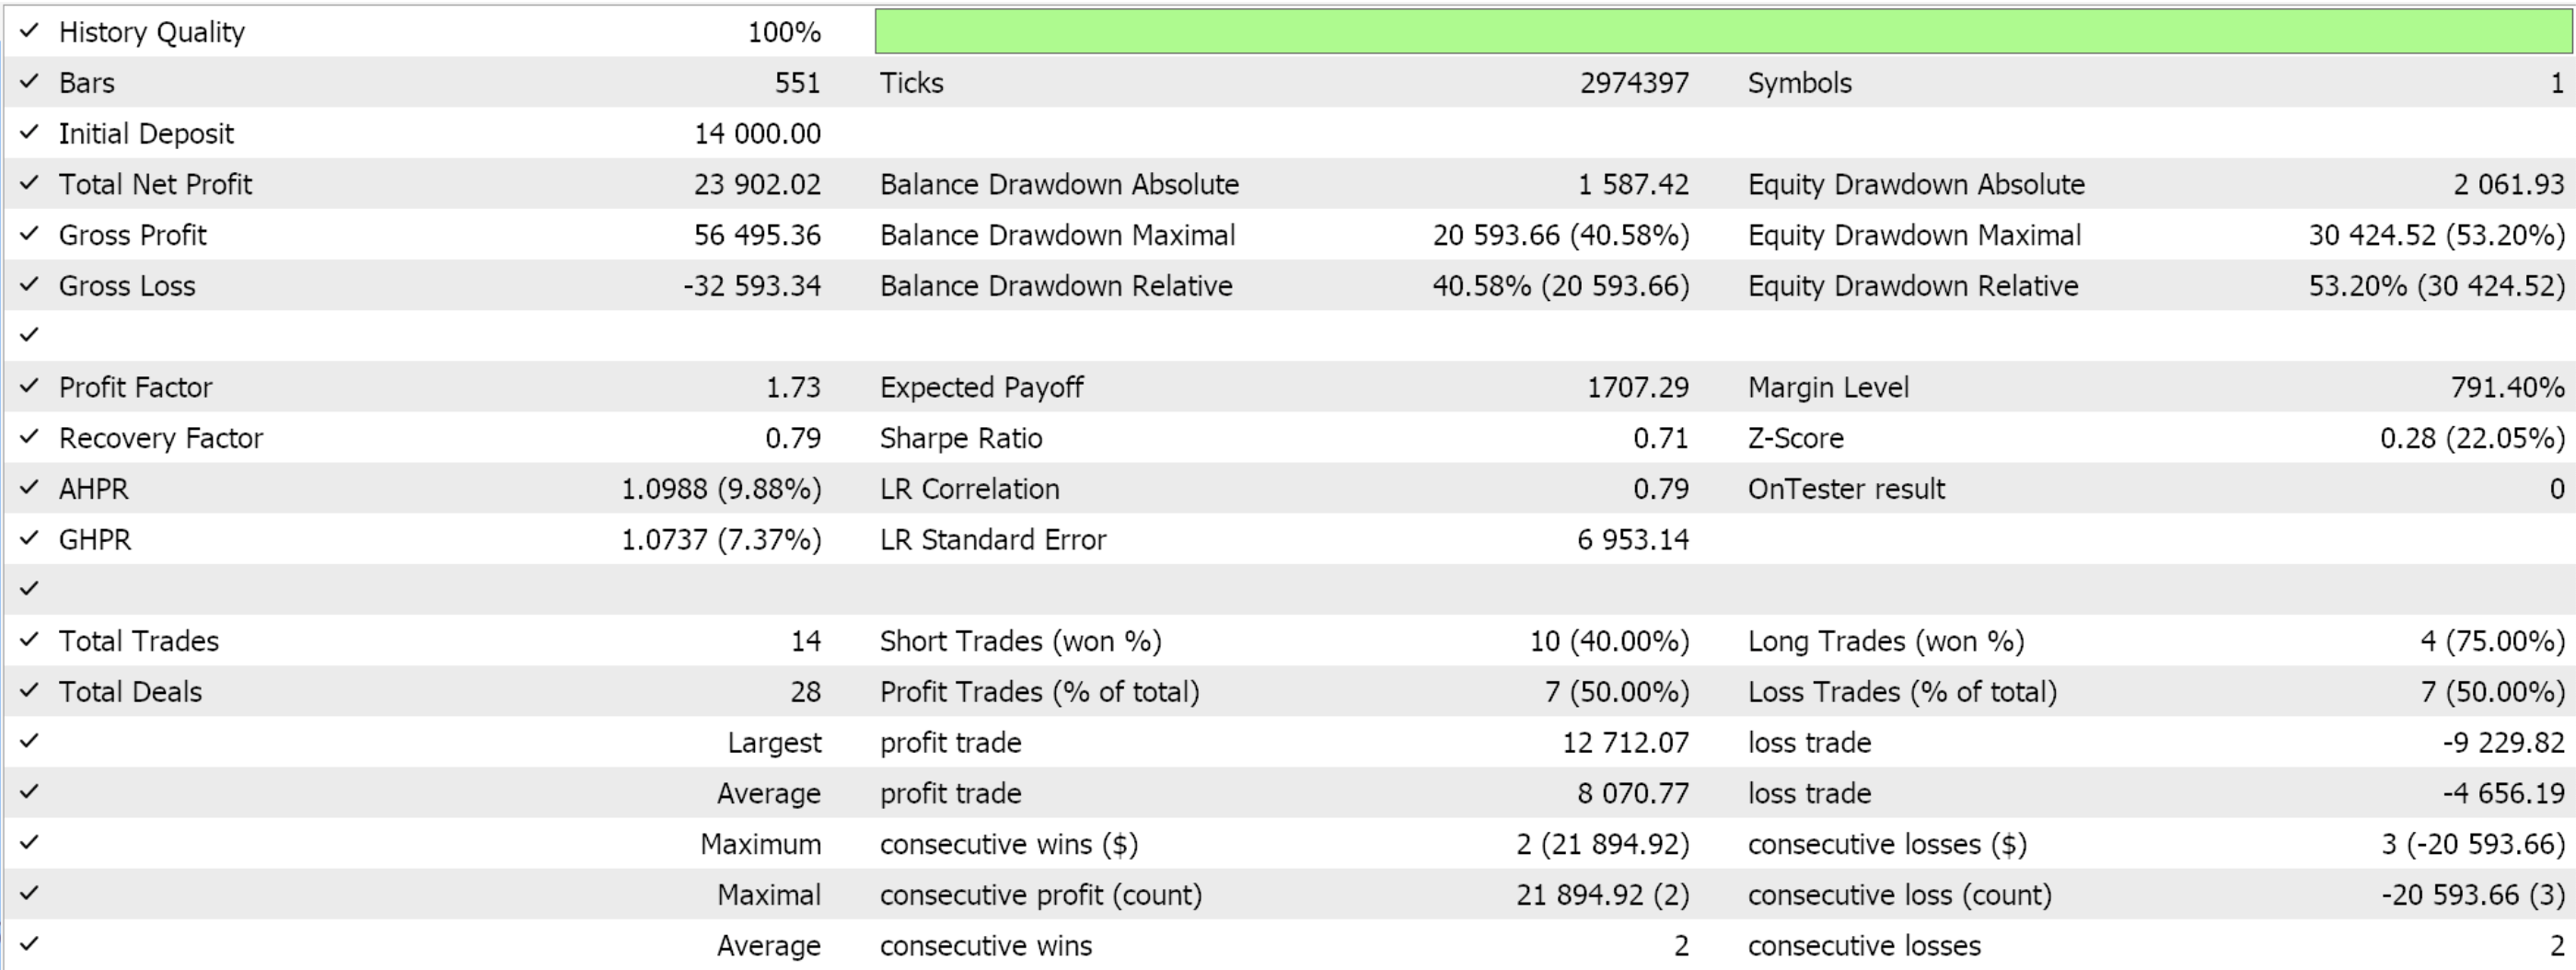
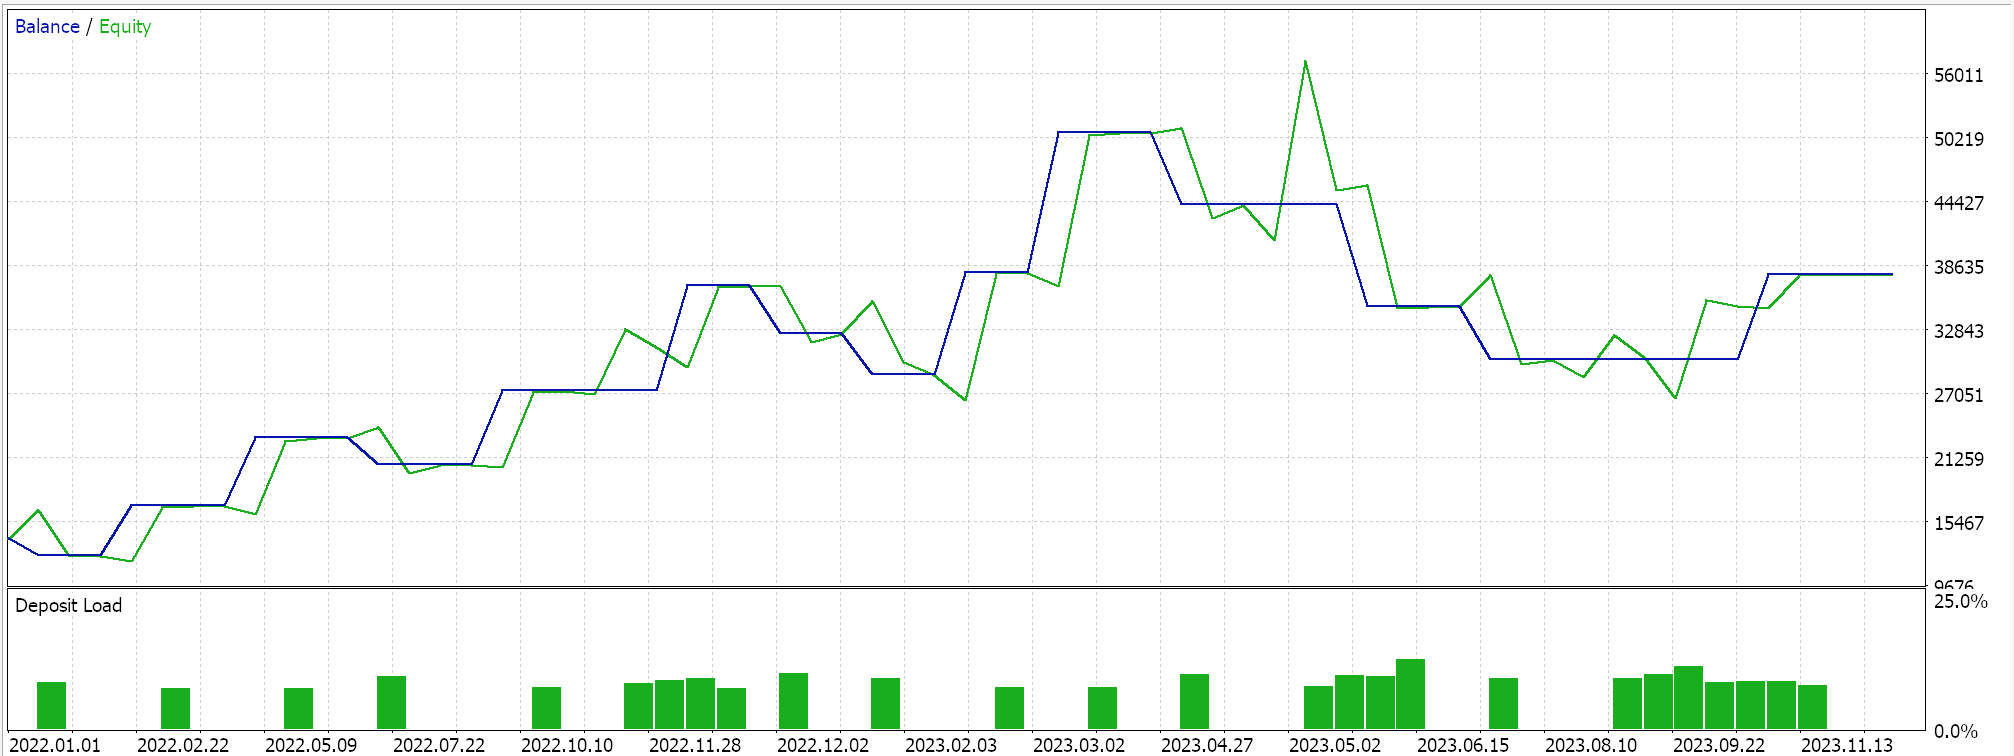
The input for patterns usage for this pattern is 64.
Conclusion
We have looked at 7 of the possible 10 patterns of the parabolic SAR, and we leave it here for now in order for this piece to not be so lengthy. The patterns we will consider in the follow-up article will be parabolic SAR & volume divergence, inverted SAR on a higher time frame, and SAR and RSI overlap. Each of the patterns already covered in this article can be exploited further and implemented in various ways and formats. For this, article and the last two like it, we are relying on the in-built pattern methods of the signal class file, from which our custom signal class inherits. In the past two articles, we declared and used a parameter ‘m_patterns_used’ that was duplicitous and unnecessary because our parent class already has the parameter ‘m_patterns_usage’. The latter minimizes our coding requirements and, when used, also delivers more concise results because the actual input map gets properly used.
This is something readers should not do, and they should make changes to the code attached to these two recent articles accordingly. Also, of note, perhaps as a takeaway from this article, the implementation of price channels in Expert Advisors is not very common, which is why in an independent piece I could look into how this could also be a signal class. While the visual reading of a price chart with a channel is straightforward because the defining points of the upper and lower bound can easily be pinpointed visually, doing so in code is not the same thing, so this is something we may consider as well in a future article.
Finally, in these pattern series, we are doing something that goes against the grain of some of the inbuilt pattern-based signals that come with the standard library. We are optimizing for the ideal threshold conditions for each pattern. This goes against the convention of having these thresholds preset by the trader based on his own experience and observations when dealing with the indicators. While our test results do seem promising because we are using multiple patterns, it can be argued that they are harder to generalize and therefore cross-validate. It could therefore be recommended that these threshold weights be pre-assigned by the trader in the event that multiple patterns are going to be used. If it’s just one pattern to be used, which is something we can accommodate, as shared in an earlier article that listed input map values for each individual pattern, then a case could be made to optimize for just this threshold.
 Neural Networks Made Easy (Part 88): Time-Series Dense Encoder (TiDE)
 Introduction to Connexus (Part 1): How to Use the WebRequest Function?
 Gain An Edge Over Any Market (Part IV): CBOE Euro And Gold Volatility Indexes
 Scalping Orderflow for MQL5
- Free trading apps
- Over 8,000 signals for copying
- Economic news for exploring financial markets
You agree to website policy and terms of use