
Creating an MQL5 Expert Advisor Based on the PIRANHA Strategy by Utilizing Bollinger Bands
Introduction
In this article, we will explore how to create an Expert Advisor (EA) in MetaQuotes Language 5 (MQL5) based on the PIRANHA strategy, focusing on integrating Bollinger Bands. As traders seek effective automated trading solutions, the PIRANHA strategy has emerged as a systematic approach that capitalizes on market fluctuations, making it an appealing choice for many Forex enthusiasts.
We will begin by outlining the fundamental principles of the PIRANHA strategy, providing a solid foundation for its implementation in automated trading. Next, we will delve into Bollinger Bands, a popular technical indicator that helps identify potential entry and exit points by measuring market volatility.
Following this, we will guide you through the coding process in MQL5, highlighting essential functions and logic that drive the strategy. Additionally, we will discuss testing the EA's performance, optimizing parameters, and best practices for deploying it in a live trading environment. The topics we'll cover in this article include:
- Overview of the PIRANHA Strategy
- Understanding Bollinger Bands
- Strategy Blueprint
- Implementation in MQL5
- Testing
- Conclusion
By the end of this article, you will be equipped with the knowledge to develop an MQL5 Expert Advisor that effectively utilizes the PIRANHA strategy and Bollinger Bands, enhancing your trading approach. Let's get started.
Overview of the PIRANHA Strategy
The PIRANHA strategy is a dynamic trading system that can capitalize on price movements in the foreign exchange market. This strategy is defined by a fast and opportunistic type of trading, dubbed after the agile predator fish that this type of fishing can resemble due to its speed and accuracy. Skill set: The PIRANHA strategy is a volatility-based strategy developed to help traders accurately determine entry and exit points of the market through its highly relative approach.
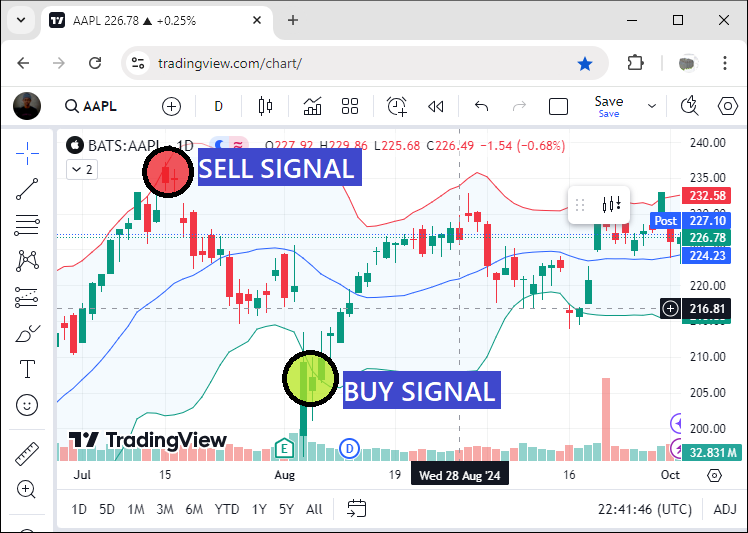
One component of the PIRANHA strategy that is enabled is the application of Bollinger Bands, which are common indicators to help traders see volatility in their market. For our method, we will use a 12-period Bollinger Band, simply because it is a great tool and over time has a topology that gives us good insights into price behavior. We will also set a 2 standard deviation, which essentially equates to capturing major price movements while filtering out the noise from minor fluctuations. These channels create a ceiling and floor, representing potential overbought or oversold conditions in the market. If the price drops below the lower band, it is considered a great buying opportunity, while a rise above the upper band indicates that selling might be in order. An illustration is shown below:
Risk management is another vital element of the PIRANHA strategy. It emphasizes the importance of protecting capital through well-defined stop-loss and take-profit levels. For our strategy, we will place the stop-loss 100 points below the entry price for buy trades and set a take-profit level 50 points above the entry. This disciplined approach ensures we can mitigate potential losses while securing profits, fostering a more sustainable trading methodology.
In summary, the PIRANHA strategy combines technical analysis with an emphasis on volatility and risk management. By understanding these principles and settings, traders can navigate the Forex market more effectively, making informed decisions that align with their trading goals. As we move forward, we will explore how to implement this strategy in MQL5, bringing the PIRANHA strategy to life in an automated trading system.
Understanding Bollinger Bands
Traders can use Bollinger Bands, a robust technical analysis tool, to determine potential price movements in a volatile market. John Bollinger developed the indicator in the 1980s. It consists of three components: a moving average, an upper band, and a lower band. The calculations that traders perform allow them to gauge whether a price is far from its average in either direction.
To start, we calculate the middle band (the moving average), which is usually a 20-period simple moving average, or SMA. The formula for the SMA is:

Where 𝑃𝑖 represents the closing price at each period and 𝑛 is the number of periods (in this case, 20). For example, if we have the following closing prices over the last 20 periods:
| Period | Closing Price (𝑃𝑖) |
|---|---|
| 1 | 1.1050 |
| 2 | 1.1070 |
| 3 | 1.1030 |
| 4 | 1.1080 |
| 5 | 1.1040 |
| 6 | 1.1100 |
| 7 | 1.1120 |
| 8 | 1.1150 |
| 9 | 1.1090 |
| 10 | 1.1060 |
| 11 | 1.1085 |
| 12 | 1.1105 |
| 13 | 1.1130 |
| 14 | 1.1110 |
| 15 | 1.1075 |
| 16 | 1.1055 |
| 17 | 1.1080 |
| 18 | 1.1095 |
| 19 | 1.1115 |
| 20 | 1.1120 |
We sum these prices and divide by 20:

Next, we calculate the standard deviation, which measures the dispersion of the closing prices from the SMA. The formula for standard deviation (𝜎) is:

Using our calculated SMA of 1.1080, we compute the squared differences for each closing price, then take their average, and finally take the square root. For example, the first few squared differences are:
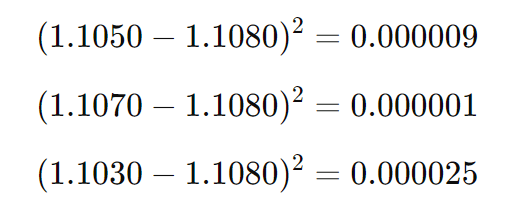
After calculating all 20 squared differences, we find:

- Upper Band = SMA + (k × σ)
- Lower Band = SMA − (k × σ)
Here, we typically set k=2 (representing two standard deviations). Plugging in our values:
- Upper Band = 1.1080 + (2 × 0.0030) = 1.1140
- Lower Band = 1.1080 − (2 × 0.0030) = 1.1020
The resulting Bollinger Bands are as follows:
- Middle Band (SMA): 1.1080
- Upper Band: 1.1140
- Lower Band: 1.1020
These three bands are as illustrated below:
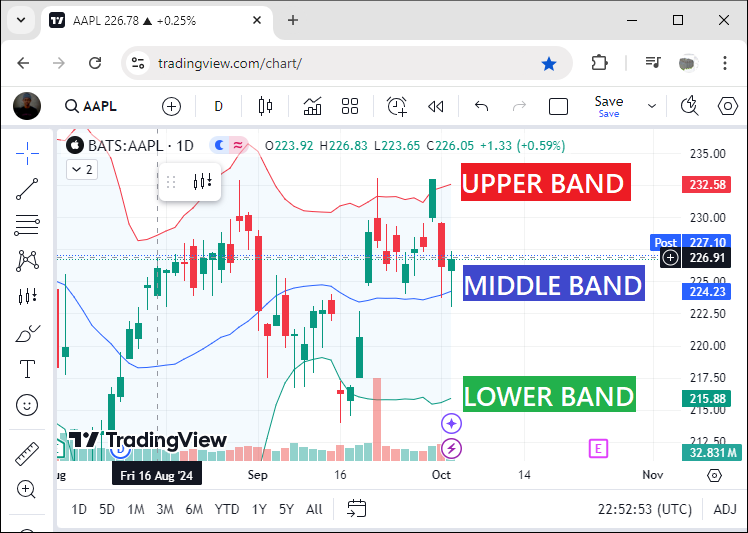
The space between these bands shifts with market conditions. When they widen, it indicates increasing volatility—and moving markets tend to be volatile. When the bands narrow, it suggests the market is consolidating. Traders like to look for interactions between prices and the bands to generate trading signals. They might tend to interpret a price interaction with the upper band as a market that is overbought and a price interaction with the lower band as a market that is oversold.
To summarize, the calculations for Bollinger Bands involve the reversal of the SMA, the standard deviation, and the upper and lower bands. Understanding these calculations is not just an exercise in quantitative reading but is equipping traders with the necessary ammunition to make informed trading decisions, particularly when applying the PIRANHA strategy in their trading endeavors.
Strategy Blueprint
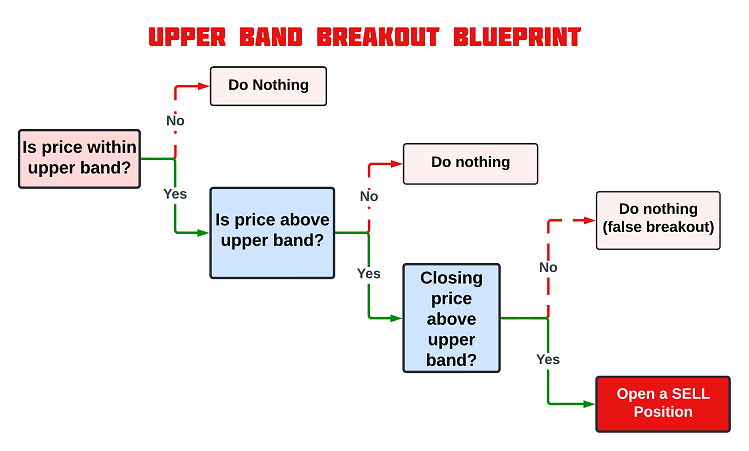
Upper Band Blueprint: Sell Condition
When the price crosses and closes above the upper Bollinger Band, it signals that the market may be overbought. This condition suggests that prices have risen excessively and are likely to experience a downward correction. As a result, we consider this scenario a sell signal. Thus, we open a sell position when the current bar's closing price remains above the upper band. The aim is to capitalize on a potential reversal or pullback.
Lower Band Blueprint: Buy Condition
Conversely, when the price crosses and closes below the lower Bollinger Band, it indicates that the market may be oversold. This scenario suggests that prices have dropped significantly and could be poised for a rebound. Therefore, this is considered a buy signal. Thus, we open a buy position when the current bar’s closing price is below the lower band, anticipating a possible upward reversal.
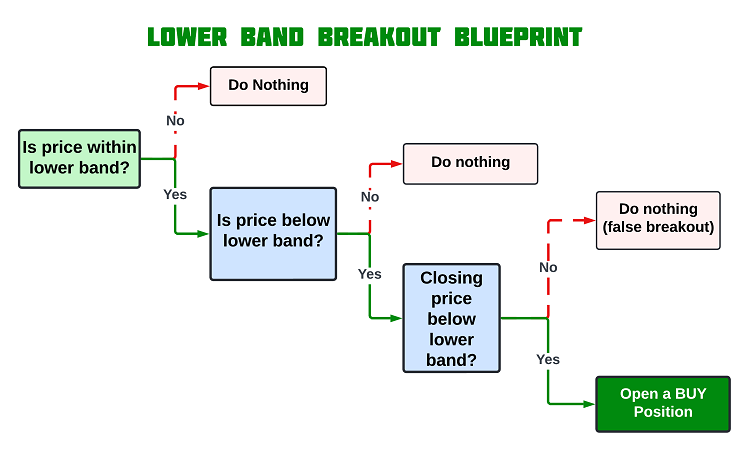
These visual representations of the strategy blueprint will be helpful when we are implementing these trading conditions in MQL5, serving as a reference for coding precise entry and exit rules.
Implementation in MQL5
After learning all the theories about the Piranha trading strategy, let us then automate the theory and craft an Expert Advisor (EA) in MetaQuotes Language 5 (MQL5) for MetaTrader 5.
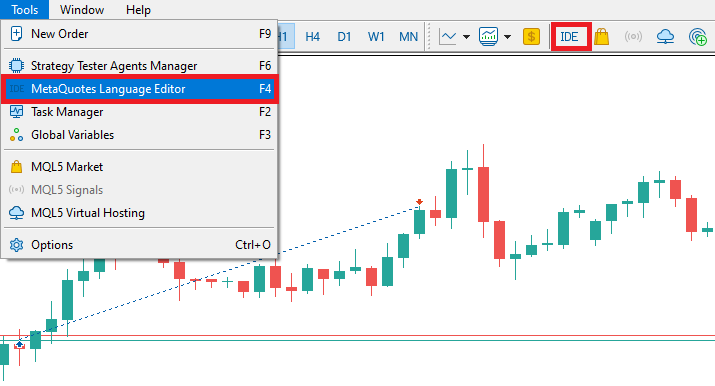
To create an expert advisor (EA), on your MetaTrader 5 terminal, click the Tools tab and check MetaQuotes Language Editor, or simply press F4 on your keyboard. Alternatively, you can click the IDE (Integrated Development Environment) icon on the tools bar. This will open the MetaQuotes Language Editor environment, which allows the writing of trading robots, technical indicators, scripts, and libraries of functions.
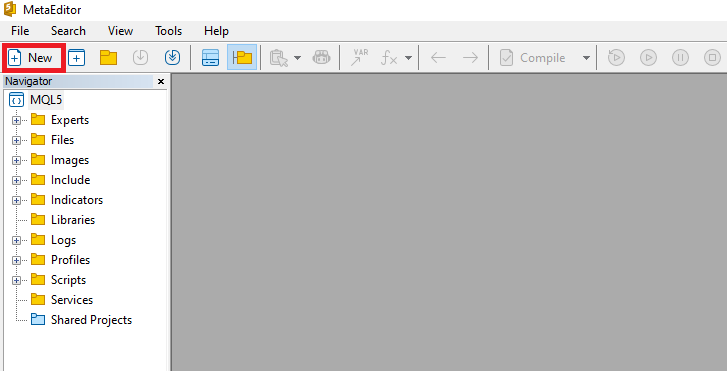
Once the MetaEditor is opened, on the tools bar, navigate to the File tab and check New File, or simply press CTRL + N, to create a new document. Alternatively, you can click on the New icon on the tools tab. This will result in a MQL Wizard pop-up.
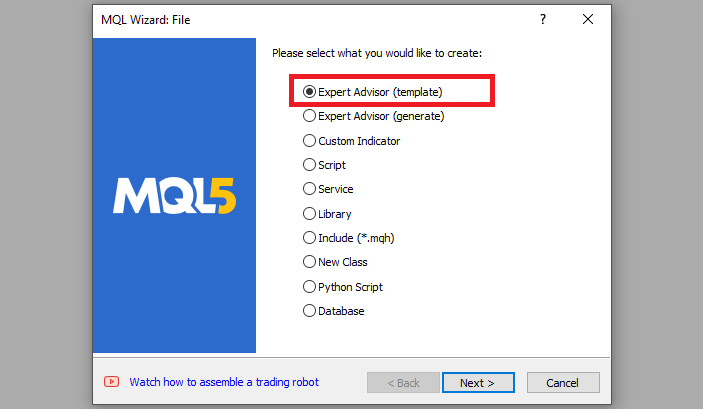
On the Wizard that pops, check Expert Advisor (template) and click Next.
On the general properties of the Expert Advisor, under the name section, provide your expert's file name. Note that to specify or create a folder if it doesn't exist, you use the backslash before the name of the EA. For example, here we have "Experts\" by default. That means that our EA will be created in the Experts folder and we can find it there. The other sections are pretty much straightforward, but you can follow the link at the bottom of the Wizard to know how to precisely undertake the process.
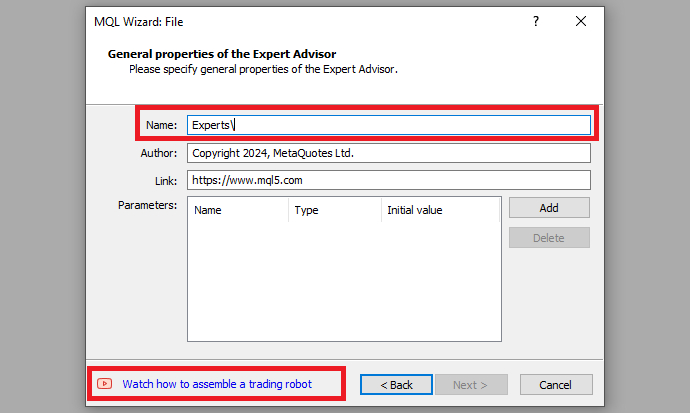
After providing your desired Expert Advisor file name, click on Next, click Next, and then click Finish. After doing all that, we are now ready to code and program our strategy.
First, we start by defining some metadata about the Expert Advisor (EA). This includes the name of the EA, the copyright information, and a link to the MetaQuotes website. We also specify the version of the EA, which is set to "1.00".
//+------------------------------------------------------------------+
//|                                                      PIRANHA.mq5 |
//|                        Allan Munene Mutiiria, Forex Algo-Trader. |
//|                                     https://forexalgo-trader.com |
//+------------------------------------------------------------------+

//--- Properties to define metadata about the Expert Advisor (EA)
#property copyright "Allan Munene Mutiiria, Forex Algo-Trader."   //--- Copyright information
#property link      "https://forexalgo-trader.com"               //--- Link to the creator's website
#property version   "1.00"                                       //--- Version number of the EA
When loading the program, information that depicts the one shown below is realized.
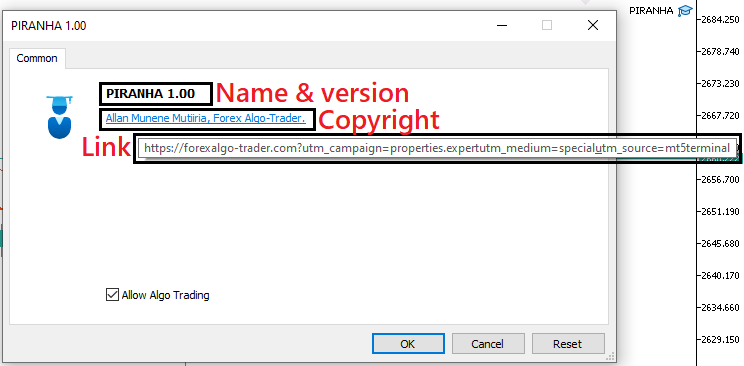
First, we include a trade instance by using #include at the beginning of the source code. This gives us access to the CTrade class, which we will use to create a trade object. This is crucial as we need it to open trades.
//--- Including the MQL5 trading library
#include <Trade/Trade.mqh>      //--- Import trading functionalities
CTrade obj_Trade;               //--- Creating an object of the CTrade class to handle trading operations
The preprocessor will replace the line #include <Trade/Trade.mqh> with the content of the file Trade.mqh. Angle brackets indicate that the Trade.mqh file will be taken from the standard directory (usually it is terminal_installation_directory\MQL5\Include). The current directory is not included in the search. The line can be placed anywhere in the program, but usually, all inclusions are placed at the beginning of the source code, for a better code structure and easier reference. Declaration of the obj_Trade object of the CTrade class will give us access to the methods contained in that class easily, thanks to the MQL5 developers.
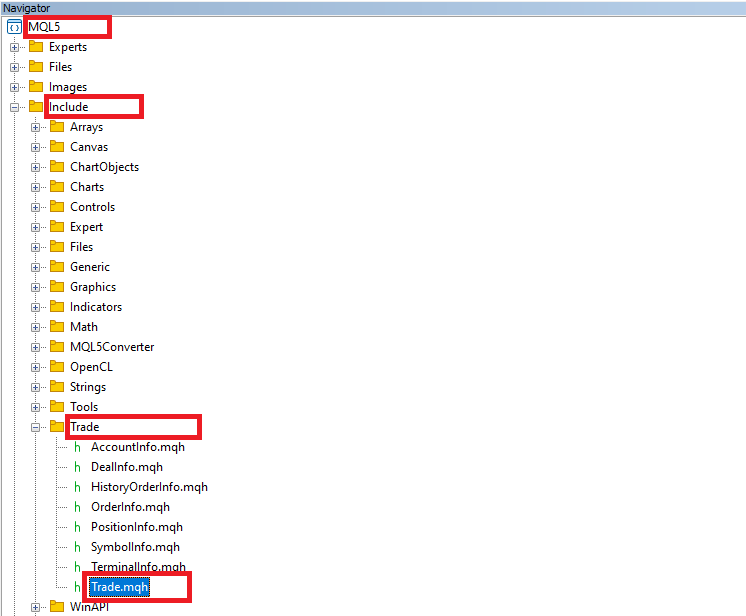
We will need to create indicator handles so that we can include the necessary indicators in the strategy.
//--- Defining variables for Bollinger Bands indicator and price arrays
int handleBB = INVALID_HANDLE;  //--- Store Bollinger Bands handle; initialized as invalid
double bb_upper[], bb_lower[];  //--- Arrays to store upper and lower Bollinger Bands values
Here, we declare and initialize a single integer variable, "handleBB", which will serve as the handle for the Bollinger Bands indicator in our Expert Advisor. In MQL5, a handle is a unique identifier assigned to an indicator, making it easy to reference that indicator throughout the code. By setting "handleBB" to INVALID_HANDLE initially, we ensure that the program won't reference an invalid indicator handle before it's properly created, thereby preventing unexpected errors. Alongside the handle, we also define two dynamic arrays, "bb_upper" and "bb_lower", which will store the upper and lower Bollinger Bands values, respectively. These arrays will help us capture and analyze the current state of the indicator, providing a reliable foundation for executing our trading strategy based on Bollinger Band conditions. Again, we will need to ensure we open just a single position in one direction.
//--- Flags to track if the last trade was a buy or sell
bool isPrevTradeBuy = false, isPrevTradeSell = false;  //--- Prevent consecutive trades in the same direction
Here, we declare and initialize two Boolean flags, "isPrevTradeBuy" and "isPrevTradeSell", to keep track of the direction of the last executed trade. Both are set to false initially, indicating that no trades have been made yet. These flags will play a critical role in managing our trading logic by ensuring that the Expert Advisor does not open consecutive trades in the same direction. For instance, if the previous trade was a buy, "isPrevTradeBuy" will be set to true, preventing another buy trade until a sell trade has occurred. This mechanism will help to avoid redundant trades and maintain a balanced trading strategy.
Next, we need the OnInit event handler. The handler is essential because it is automatically called when the Expert Advisor (EA) is initialized on a chart. This function is responsible for setting up the EA, including creating necessary indicator handles, initializing variables, and preparing resources. In other words, OnInit is an in-built function that ensures that everything is properly configured before the EA begins processing market data. It is as follows.
//+------------------------------------------------------------------+
//| Expert initialization function                                   |
//+------------------------------------------------------------------+
int OnInit(){
   // OnInit is called when the EA is initialized on the chart
//...
}
On the OnInit event handler, we need to initialize the indicator handle so that data values are assigned to it.
   //--- Create Bollinger Bands indicator handle with a period of 12, no shift, and a deviation of 2
   handleBB = iBands(_Symbol, _Period, 12, 0, 2, PRICE_CLOSE);
Here, we create the handle for the Bollinger Bands indicator by calling the iBands function, which generates the indicator based on specified parameters. We pass several arguments to this function: _Symbol refers to the currency pair we are analyzing, and _Period denotes the timeframe for the indicator, which could be anything from minutes to hours or days. The parameters for the Bollinger Bands include a period of 12, indicating the number of bars used to calculate the indicator, a shift of 0, which means no adjustment is applied to the bands, and a standard deviation of 2, which determines how far the bands will be from the moving average. The use of PRICE_CLOSE indicates that we will base our calculations on the closing prices of the bars. Once this executes successfully, our handle variable "handleBB" will store a valid identifier for the Bollinger Bands indicator, allowing us to reference it for data retrieval and analysis. Thus, we need to check if the handle was created successfully before proceeding.
   //--- Check if the Bollinger Bands handle was created successfully
   if (handleBB == INVALID_HANDLE){
      Print("ERROR: UNABLE TO CREATE THE BB HANDLE. REVERTING");  //--- Print error if handle creation fails
      return (INIT_FAILED);  //--- Return initialization failed
   }
Here, we verify whether the handle for the Bollinger Bands indicator was created successfully by checking if it equals INVALID_HANDLE. If the handle is invalid, we print an error message stating, "ERROR: UNABLE TO CREATE THE BB HANDLE. REVERTING," which helps identify any issues during the initialization process. We then return INIT_FAILED, indicating that the Expert Advisor could not initialize properly. If this passes, we then continue to set the data arrays as time series.
   //--- Set the arrays for the Bollinger Bands to be time-series based (most recent data at index 0)
   ArraySetAsSeries(bb_upper, true);  //--- Set upper band array as series
   ArraySetAsSeries(bb_lower, true);  //--- Set lower band array as series

   return(INIT_SUCCEEDED);  //--- Initialization successful
Here, we configure the arrays for the Bollinger Bands, "bb_upper" and "bb_lower", to treat them as time-series data by calling the ArraySetAsSeries function and setting the second parameter to true. This ensures that the most recent data is stored at index 0, allowing for easier access to the latest values when analyzing market conditions. By organizing the arrays this way, we align our data structure with the typical usage in trading algorithms, where the most current information is often the most relevant. Finally, we return INIT_SUCCEEDED, indicating that the initialization process has been completed successfully, allowing the Expert Advisor to proceed with its operations.
Up to this point, everything in the initialization section worked correctly. The full source code responsible for the program initialization is as follows:
//+------------------------------------------------------------------+
//| Expert initialization function                                   |
//+------------------------------------------------------------------+
int OnInit()
  {
   //--- Create Bollinger Bands indicator handle with a period of 12, no shift, and a deviation of 2
   handleBB = iBands(_Symbol, _Period, 12, 0, 2, PRICE_CLOSE);

   //--- Check if the Bollinger Bands handle was created successfully
   if (handleBB == INVALID_HANDLE){
      Print("ERROR: UNABLE TO CREATE THE BB HANDLE. REVERTING");  //--- Print error if handle creation fails
      return (INIT_FAILED);  //--- Return initialization failed
   }

   //--- Set the arrays for the Bollinger Bands to be time-series based (most recent data at index 0)
   ArraySetAsSeries(bb_upper, true);  //--- Set upper band array as series
   ArraySetAsSeries(bb_lower, true);  //--- Set lower band array as series

   return(INIT_SUCCEEDED);  //--- Initialization successful
  }
Next, we move on to the OnDeinit event handler, which is a function called when the program is deinitialized.
//+------------------------------------------------------------------+
//| Expert deinitialization function                                 |
//+------------------------------------------------------------------+
void OnDeinit(const int reason){
   // OnDeinit is called when the EA is removed from the chart or terminated
//...
}
The OnDeinit function gets invoked when the Expert Advisor (EA) is removed from the chart or when the terminal shuts down. We have to use this event handler to ensure correct upkeep and resource management. When the EA terminates, we must release any handles to indicators we created in the initialization phase. If we didn't do this, we could be leaving behind memory locations that we used, which would be inefficient; we certainly did not want to risk leaving behind any resources that we didn't need. This is why OnDeinit is important and why cleanup steps are critical in any programming environment.
IndicatorRelease(handleBB); //--- Release the indicator handle
Here, we just call the "IndicatorRelease" function with the argument "handleBB" to release the Bollinger Bands indicator handle that we previously created. The cleanup is crucial to maintaining the platform's performance, especially if you are using multiple Expert Advisors or running the platform for extended periods. Thus, the full source code for the resources free-up is as follows:
//+------------------------------------------------------------------+
//| Expert deinitialization function                                 |
//+------------------------------------------------------------------+
void OnDeinit(const int reason)
  {
   //--- Function to handle cleanup when the EA is removed from the chart
   IndicatorRelease(handleBB); //--- Release the indicator handle
  }
Next, we need to check for trading opportunities whenever there are price updates. This is achieved on the OnTick event handler.
//+------------------------------------------------------------------+
//| Expert tick function                                             |
//+------------------------------------------------------------------+
void OnTick(){
   // OnTick is called whenever there is a new market tick (price update)

//...

}
The event-handler function, OnTick, executes and processes recent price information every time there is a new tick or a change in market conditions. It is an essential part of the operation of our Expert Advisor (EA) because it is where we run our trading logic, the trading conditions of which are, hopefully, structured to yield profitable trades. When the market data changes, we assess the current state of the market and make decisions regarding whether to open or close a position. The function executes as often as market conditions change, ensuring that our strategy operates in real-time and is responsive to current prices and changes in the values of our market indicators.
To stay updated with the current market conditions, we need to get the values of the current price quotes.
   //--- Get current Ask and Bid prices
   double Ask = NormalizeDouble(SymbolInfoDouble(_Symbol, SYMBOL_ASK), _Digits);  //--- Normalize Ask price to correct digits
   double Bid = NormalizeDouble(SymbolInfoDouble(_Symbol, SYMBOL_BID), _Digits);  //--- Normalize Bid price to correct digits
Here, we obtain the most current Ask and Bid prices for the traded symbol. To get these prices, we use the SymbolInfoDouble function. For the Ask price, we specify SYMBOL_ASK, and for the Bid price, we specify SYMBOL_BID. After we obtain the prices, we use the NormalizeDouble function to round the prices to the number of decimal places defined by _Digits. This step is crucial because it ensures that our trading operations are performed using prices that are both standardized and accurate. If we didn't round the prices, floating-point inaccuracies could yield misleading results in operation price calculations. We then copy the indicator values for use in analysis and trade operations.
   //--- Retrieve the most recent Bollinger Bands values (3 data points)
   if (CopyBuffer(handleBB, UPPER_BAND, 0, 3, bb_upper) < 3){
      Print("UNABLE TO GET UPPER BAND REQUESTED DATA. REVERTING NOW!");  //--- Error if data fetch fails
      return;
   }
   if (CopyBuffer(handleBB, LOWER_BAND, 0, 3, bb_lower) < 3){
      Print("UNABLE TO GET LOWER BAND REQUESTED DATA. REVERTING NOW!");  //--- Error if data fetch fails
      return;
   }
Here, we use the CopyBuffer function to retrieve the most recent Bollinger Bands values, specifically three data points for both the upper and lower bands. The first call to CopyBuffer requests data from the upper band, starting at index 0, and stores it in the "bb_upper" array. If the function returns a value less than 3, it indicates that the data retrieval was unsuccessful, prompting us to print an error message: "UNABLE TO GET UPPER BAND REQUESTED DATA. REVERTING NOW!" We then exit the function to prevent further execution. A similar process follows for the lower band, ensuring that we also handle any errors in retrieving its data. Note that when referencing the buffer indices, we use identifiers of indicator lines permissible when copying values of the Bollinger Bands indicator instead of buffer numbers. It is the easiest way of doing so to avoid confusion, but the logic remains. Here is a visual representation of the buffer numbers.
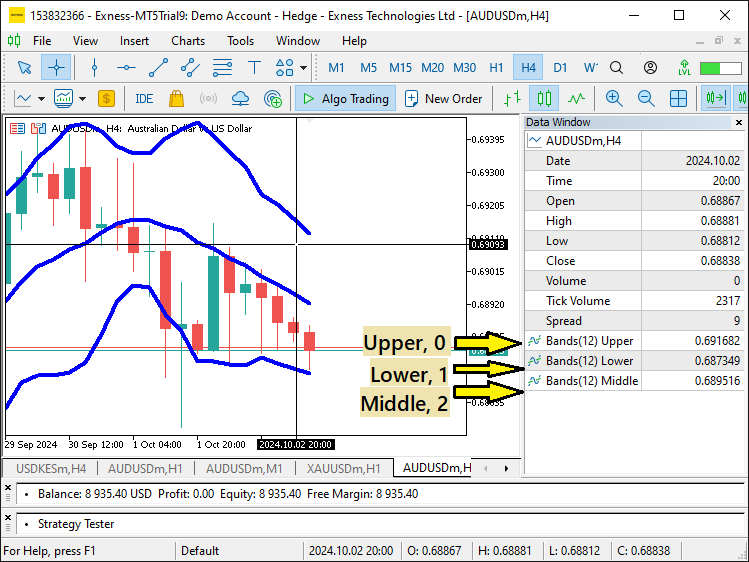
Since we will need to make a comparison between the indicator values and the prices, we need to get the bar prices that are relevant to us, in this case, the high and low prices.
   //--- Get the low and high prices of the current bar
   double low0 = iLow(_Symbol, _Period, 0);    //--- Lowest price of the current bar
   double high0 = iHigh(_Symbol, _Period, 0);  //--- Highest price of the current bar
Here, we obtain the low and high prices of the current bar by calling the functions iLow and iHigh. The function iLow retrieves the lowest price for the current bar (index 0) for the specified symbol (_Symbol) and timeframe (_Period), storing this value in the variable "low0". Similarly, iHigh fetches the highest price of the current bar and assigns it to the variable "high0". We still need to make sure we execute a single signal in one bar. Here is the logic employed.
   //--- Get the timestamp of the current bar
   datetime currTimeBar0 = iTime(_Symbol, _Period, 0);  //--- Time of the current bar
   static datetime signalTime = currTimeBar0;           //--- Static variable to store the signal time
Here, we retrieve the timestamp of the current bar using the function iTime, which returns the time of the specified bar (index 0) for the given symbol (_Symbol) and timeframe (_Period). This timestamp is stored in the variable "currTimeBar0." Additionally, we declare a static variable called "signalTime" and initialize it with the value of "currTimeBar0". By making "signalTime" static, we ensure that its value persists between function calls, allowing us to track the last time a trading signal was generated. This is crucial for our strategy, as it helps us prevent multiple signals from being triggered in the same bar, ensuring that we only act on one signal per period. After doing all that, we can now start to check for the signals. The first thing we do is check for a buy signal.
   //--- Check for a buy signal when price crosses below the lower Bollinger Band
   if (low0 < bb_lower[0]){
      Print("BUY SIGNAL @ ", TimeCurrent());  //--- Log the buy signal with the current time

   }
Here, we check for a potential buy signal by evaluating whether the lowest price of the current bar, stored in the variable "low0," is lower than the value of the most recent lower Bollinger Band, which is stored in the array "bb_lower" at index 0. If "low0" is less than "bb_lower[0]," it indicates that the price has crossed below the lower band, suggesting a potential oversold condition and a possible buy opportunity. When this condition is met, the program logs a message using the Print function to display "BUY SIGNAL @" along with the current time, obtained using the TimeCurrent function. This alert helps us track when buy signals are detected, providing transparency and traceability for the EA's decision-making process. When we run this, we get the following output.
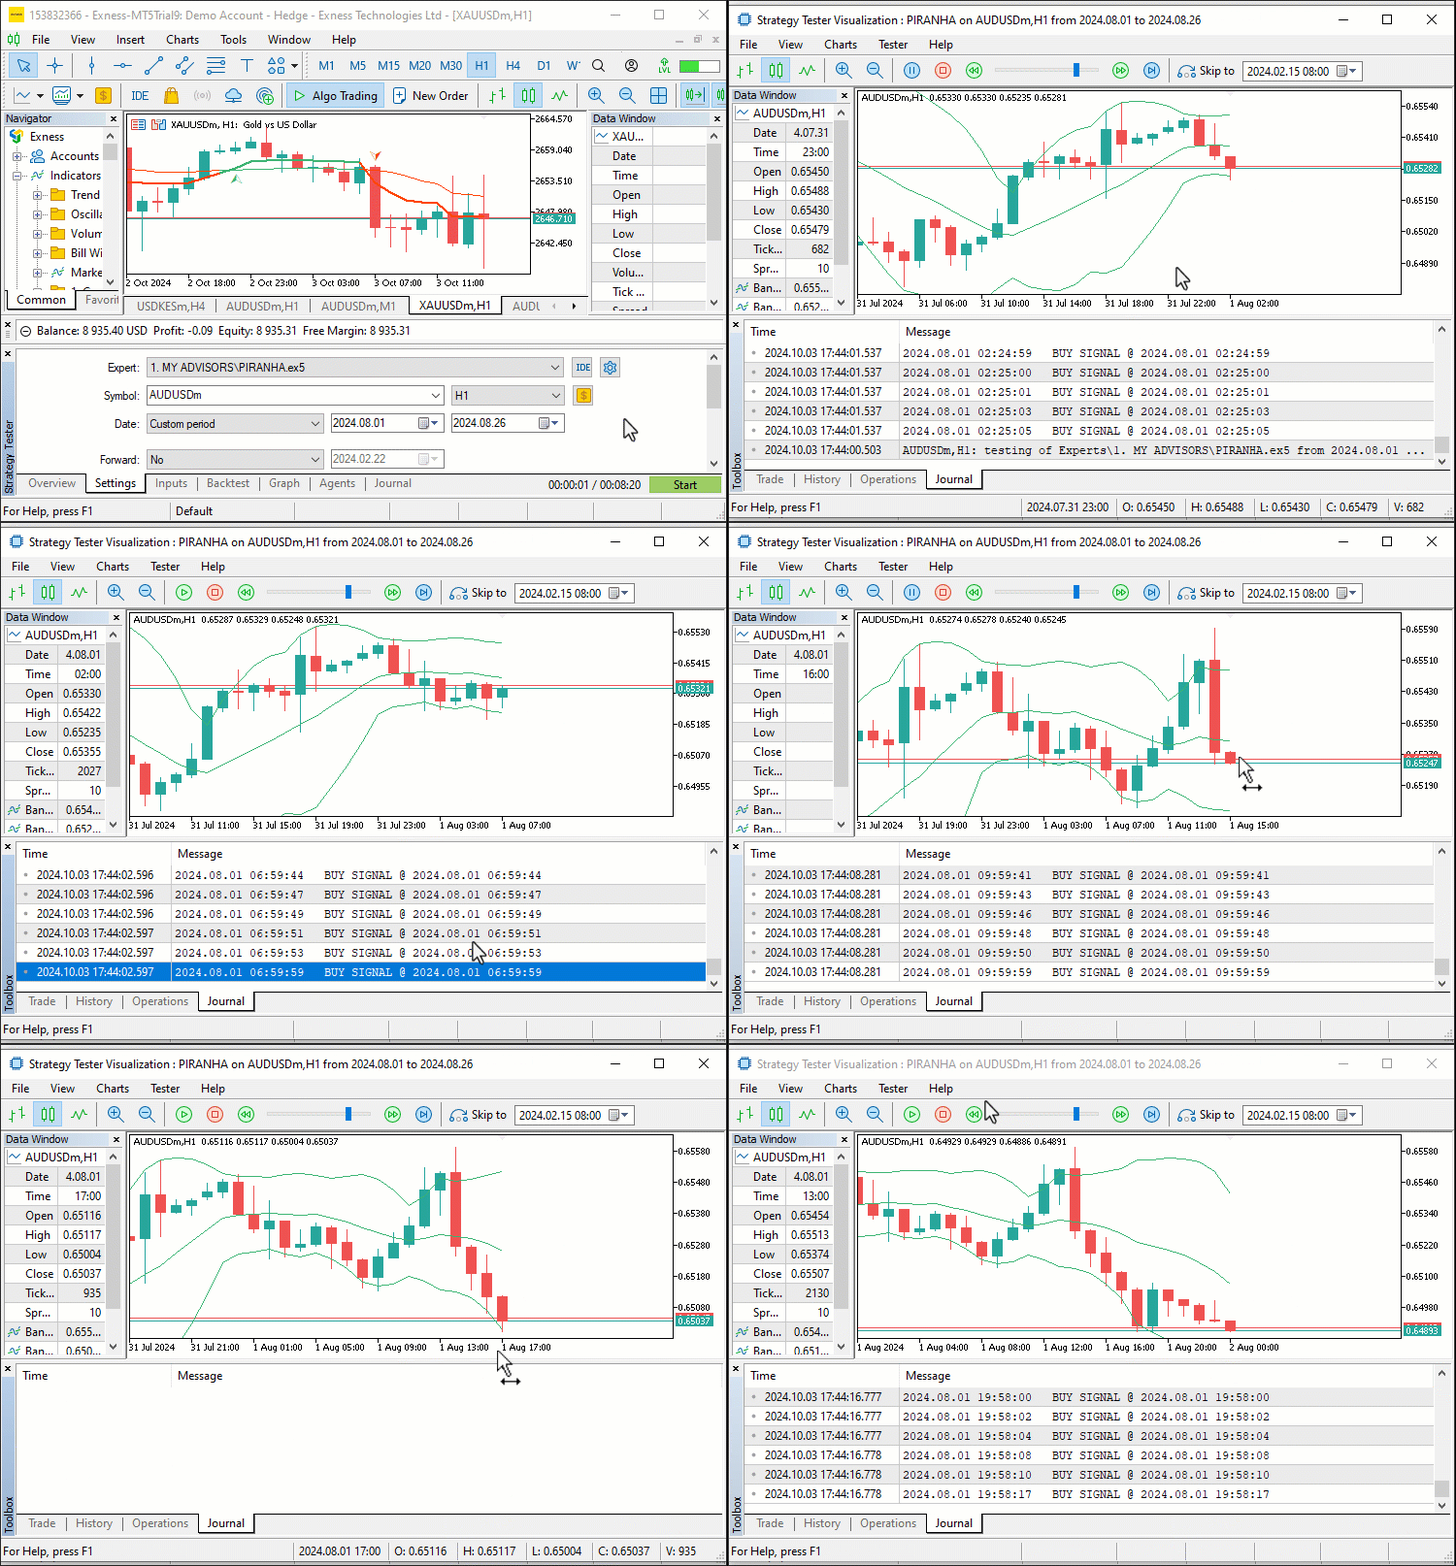
From the provided output, we can see that we print the signals on every tick the bullish conditions are met. We want to print the signal once per bar on every instance we have the conditions being met. To achieve this, we use the following logic.
   //--- Check for a buy signal when price crosses below the lower Bollinger Band
   if (low0 < bb_lower[0] && signalTime != currTimeBar0){
      Print("BUY SIGNAL @ ", TimeCurrent());  //--- Log the buy signal with the current time
      signalTime = currTimeBar0;              //--- Update signal time to avoid duplicate trades
   }
Here, we refine our buy signal condition by adding an extra check to ensure we don't generate duplicate trades within the same bar. Initially, we only verified if the lowest price of the current bar, stored in the variable "low0," was below the most recent lower Bollinger Band value ("bb_lower[0]"). Now, we incorporate a secondary condition: "signalTime != currTimeBar0", which ensures that the current bar timestamp ("currTimeBar0") is different from the last recorded signal time ("signalTime"). We then update "signalTime" to match "currTimeBar0" to confirm that we only consider one buy signal per bar, even if the price crosses below the band multiple times. When we run the update, we get the following output.
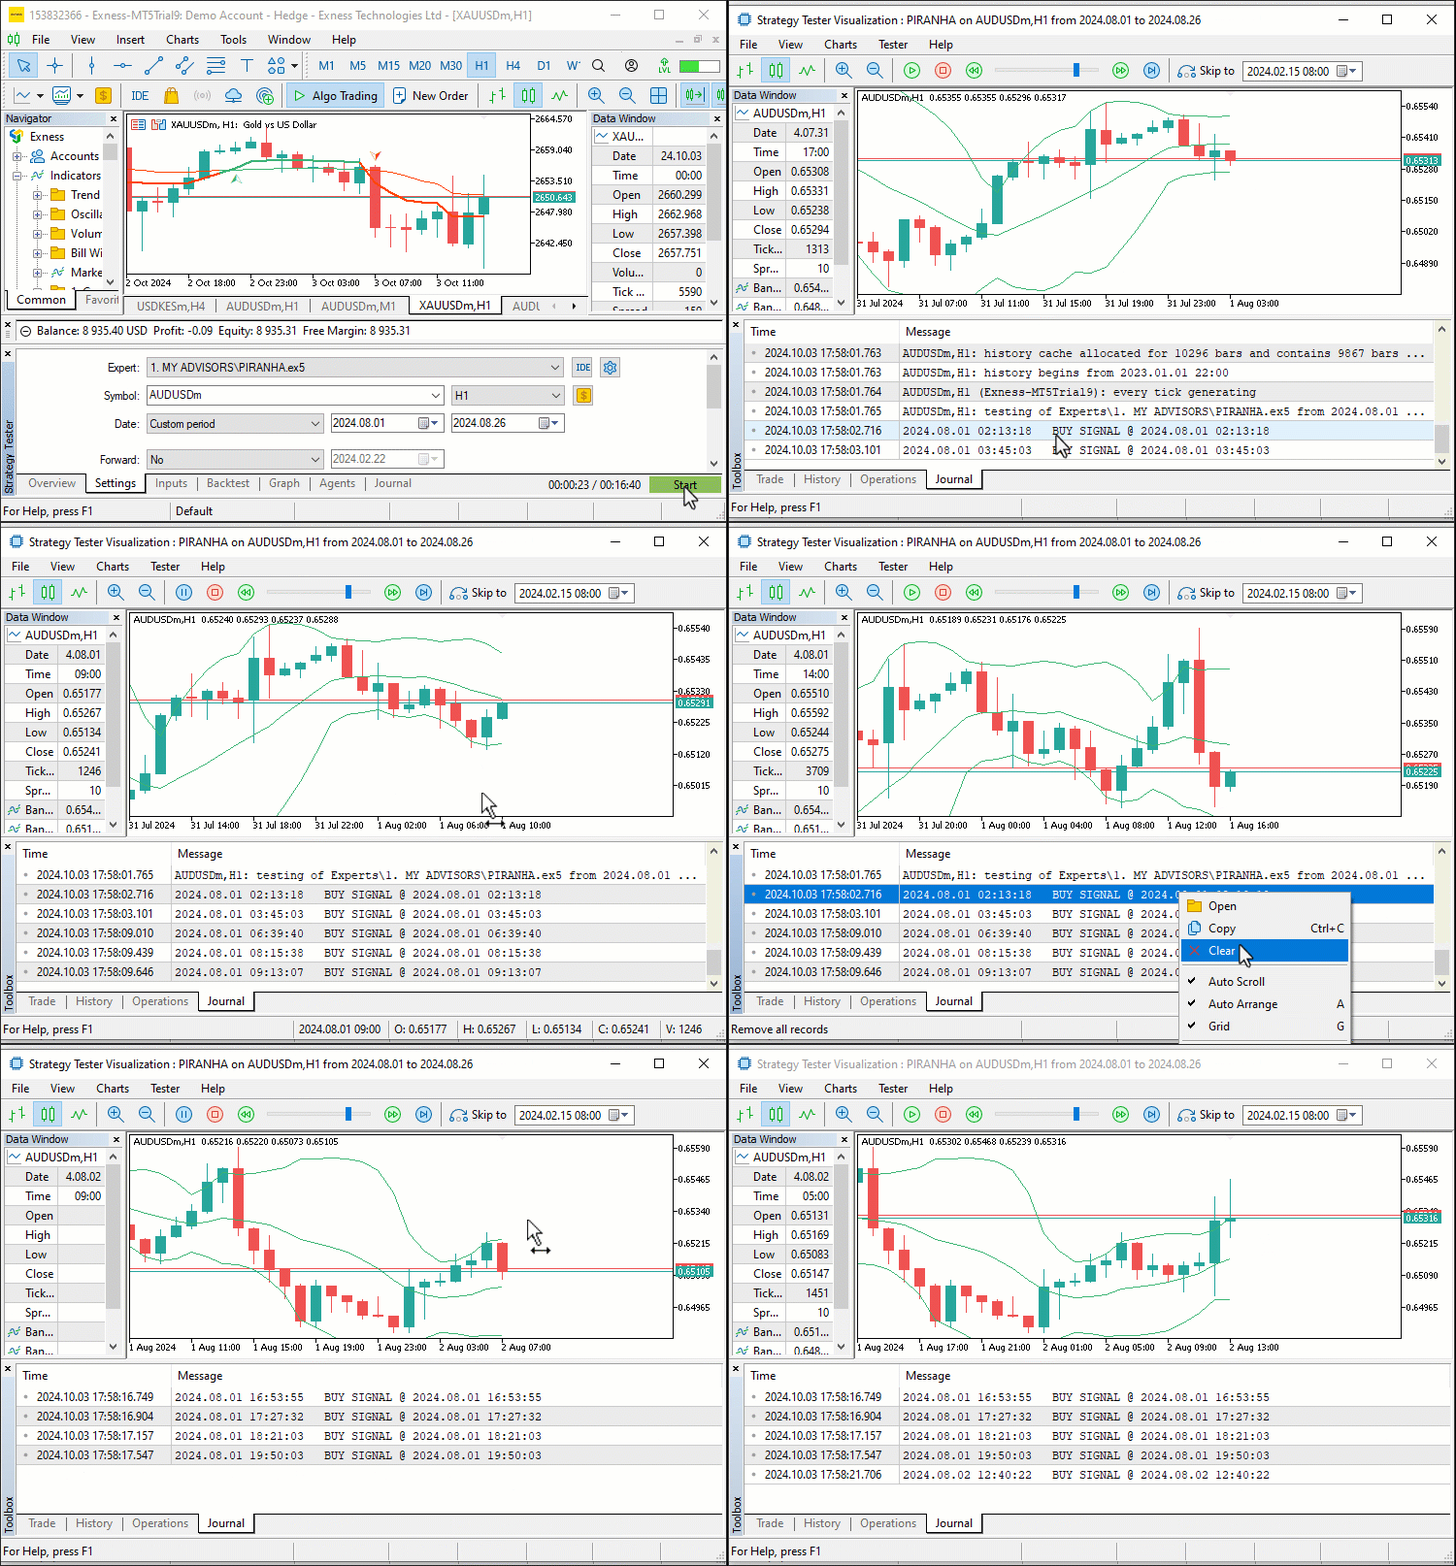
That was a success. We can now see that we print the signals once per bar. We can then continue to take action on the generated signals by opening buy positions.
      if (PositionsTotal() == 0 && !isPrevTradeBuy){
         obj_Trade.Buy(0.01, _Symbol, Ask, Ask - 100 * _Point, Ask + 50 * _Point);  //--- Open a buy position with predefined parameters
         isPrevTradeBuy = true; isPrevTradeSell = false;  //--- Update trade flags
      }
Here, we add conditions to ensure that a buy trade is only executed under specific circumstances. First, we check if the total number of open positions is zero by using the function PositionsTotal, which ensures that no other trades are currently active. Next, we verify that the last executed trade was not a buy by evaluating "!isPrevTradeBuy". This prevents consecutive buy orders and ensures that our EA does not open a new buy position if the previous trade was already a buy.
If both conditions are met, we proceed to open a buy position using "obj_Trade.Buy". We specify the order volume as "0.01" lots, with the current trading symbol (_Symbol) and the "Ask" price. The stop loss and take profit levels are set at 100 and 50 points below and above the asking price respectively, defining our risk management rules. After successfully opening a buy trade, we update the trade flags: "isPrevTradeBuy" is set to "true" and "isPrevTradeSell" is set to "false", indicating that the last trade was a buy and preventing another buy until a sell signal is triggered. For the sell logic, a similar approach is used as follows.
   //--- Check for a sell signal when price crosses above the upper Bollinger Band
   else if (high0 > bb_upper[0] && signalTime != currTimeBar0){
      Print("SELL SIGNAL @ ", TimeCurrent());  //--- Log the sell signal with the current time
      signalTime = currTimeBar0;               //--- Update signal time to avoid duplicate trades
      if (PositionsTotal() == 0 && !isPrevTradeSell){
         obj_Trade.Sell(0.01, _Symbol, Bid, Bid + 100 * _Point, Bid - 50 * _Point);  //--- Open a sell position with predefined parameters
         isPrevTradeBuy = false; isPrevTradeSell = true;  //--- Update trade flags
      }
   }
Once we compile and run the program, we get the following output.
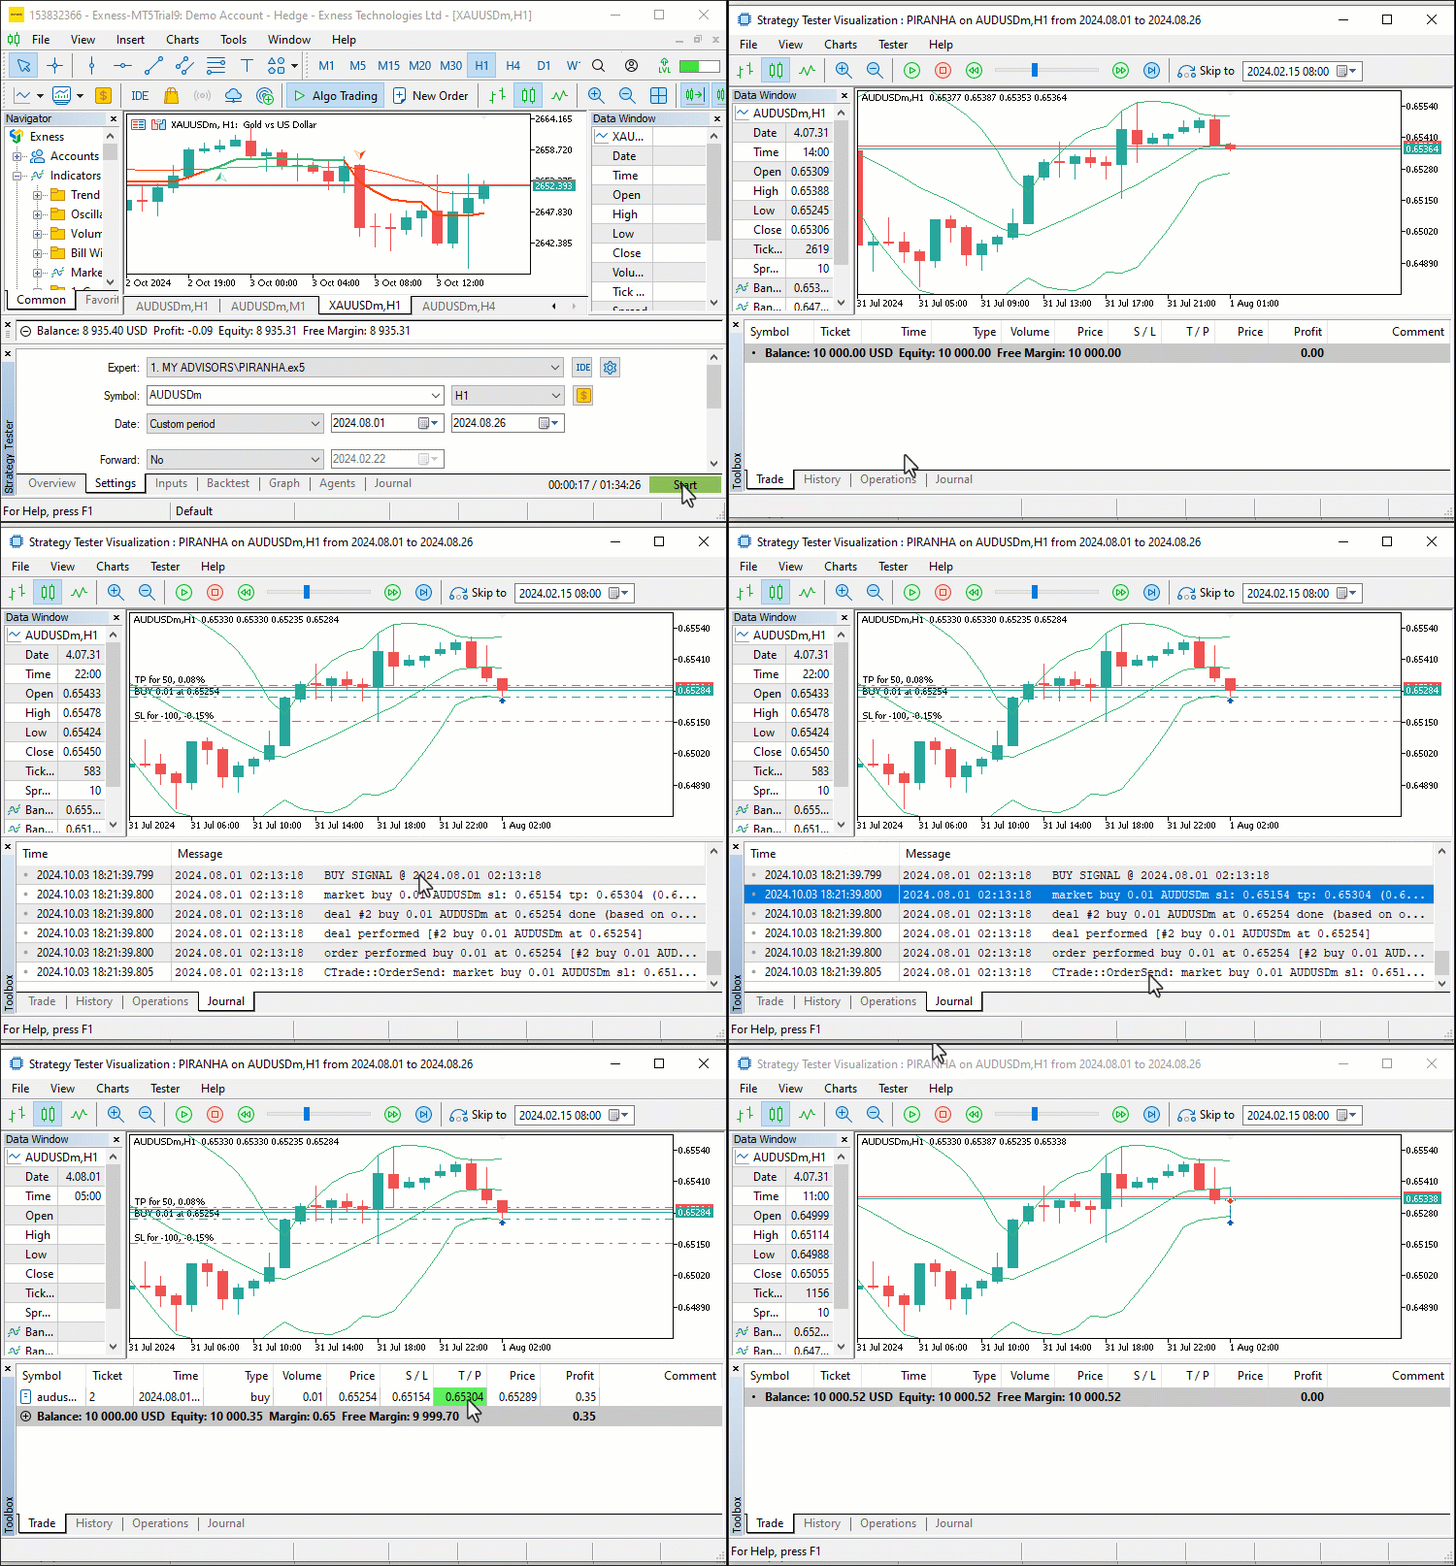
We can see that we successfully executed the buy position. With the implementation complete, we have integrated the PIRANHA strategy using Bollinger Bands and configured the program to respond to buy and sell signals based on defined conditions. In the next section, we will focus on testing the program to evaluate its performance and fine-tune the parameters for optimal results.
Testing
After completing the implementation, the next critical step is to test the Expert Advisor (EA) thoroughly to evaluate its performance and optimize its parameters. Effective testing ensures that the strategy behaves as expected in various market conditions, minimizing the risk of unforeseen issues during trading. Here, we will use the MetaTrader 5 Strategy Tester to perform backtesting and optimization to find the best possible input values for our strategy.
We will begin by setting up our initial input parameters for the Stop Loss (SL) and Take Profit (TP) values, which significantly impact the strategy’s risk management. In the original implementation, the SL and TP were defined using fixed pip values. However, to give the strategy enough room to breathe and better capture market movements, we’ll modify the input parameters to be more flexible and optimized during testing. Let’s update the code as follows:
//--- INPUTS
input int sl_points = 500;
input int tp_points = 250;

//---

   //--- Check for a buy signal when price crosses below the lower Bollinger Band
   if (low0 < bb_lower[0] && signalTime != currTimeBar0){
      Print("BUY SIGNAL @ ", TimeCurrent());  //--- Log the buy signal with the current time
      signalTime = currTimeBar0;              //--- Update signal time to avoid duplicate trades
      if (PositionsTotal() == 0 && !isPrevTradeBuy){
         obj_Trade.Buy(0.01, _Symbol, Ask, Ask - sl_points * _Point, Ask + tp_points * _Point);  //--- Open a buy position with predefined parameters
         isPrevTradeBuy = true; isPrevTradeSell = false;  //--- Update trade flags
      }
   }

   //--- Check for a sell signal when price crosses above the upper Bollinger Band
   else if (high0 > bb_upper[0] && signalTime != currTimeBar0){
      Print("SELL SIGNAL @ ", TimeCurrent());  //--- Log the sell signal with the current time
      signalTime = currTimeBar0;               //--- Update signal time to avoid duplicate trades
      if (PositionsTotal() == 0 && !isPrevTradeSell){
         obj_Trade.Sell(0.01, _Symbol, Bid, Bid + sl_points * _Point, Bid - tp_points * _Point);  //--- Open a sell position with predefined parameters
         isPrevTradeBuy = false; isPrevTradeSell = true;  //--- Update trade flags
      }
   }
The inputs allow us to do dynamic optimization on different symbols and trading commodities. Once we run this, we get the following output.
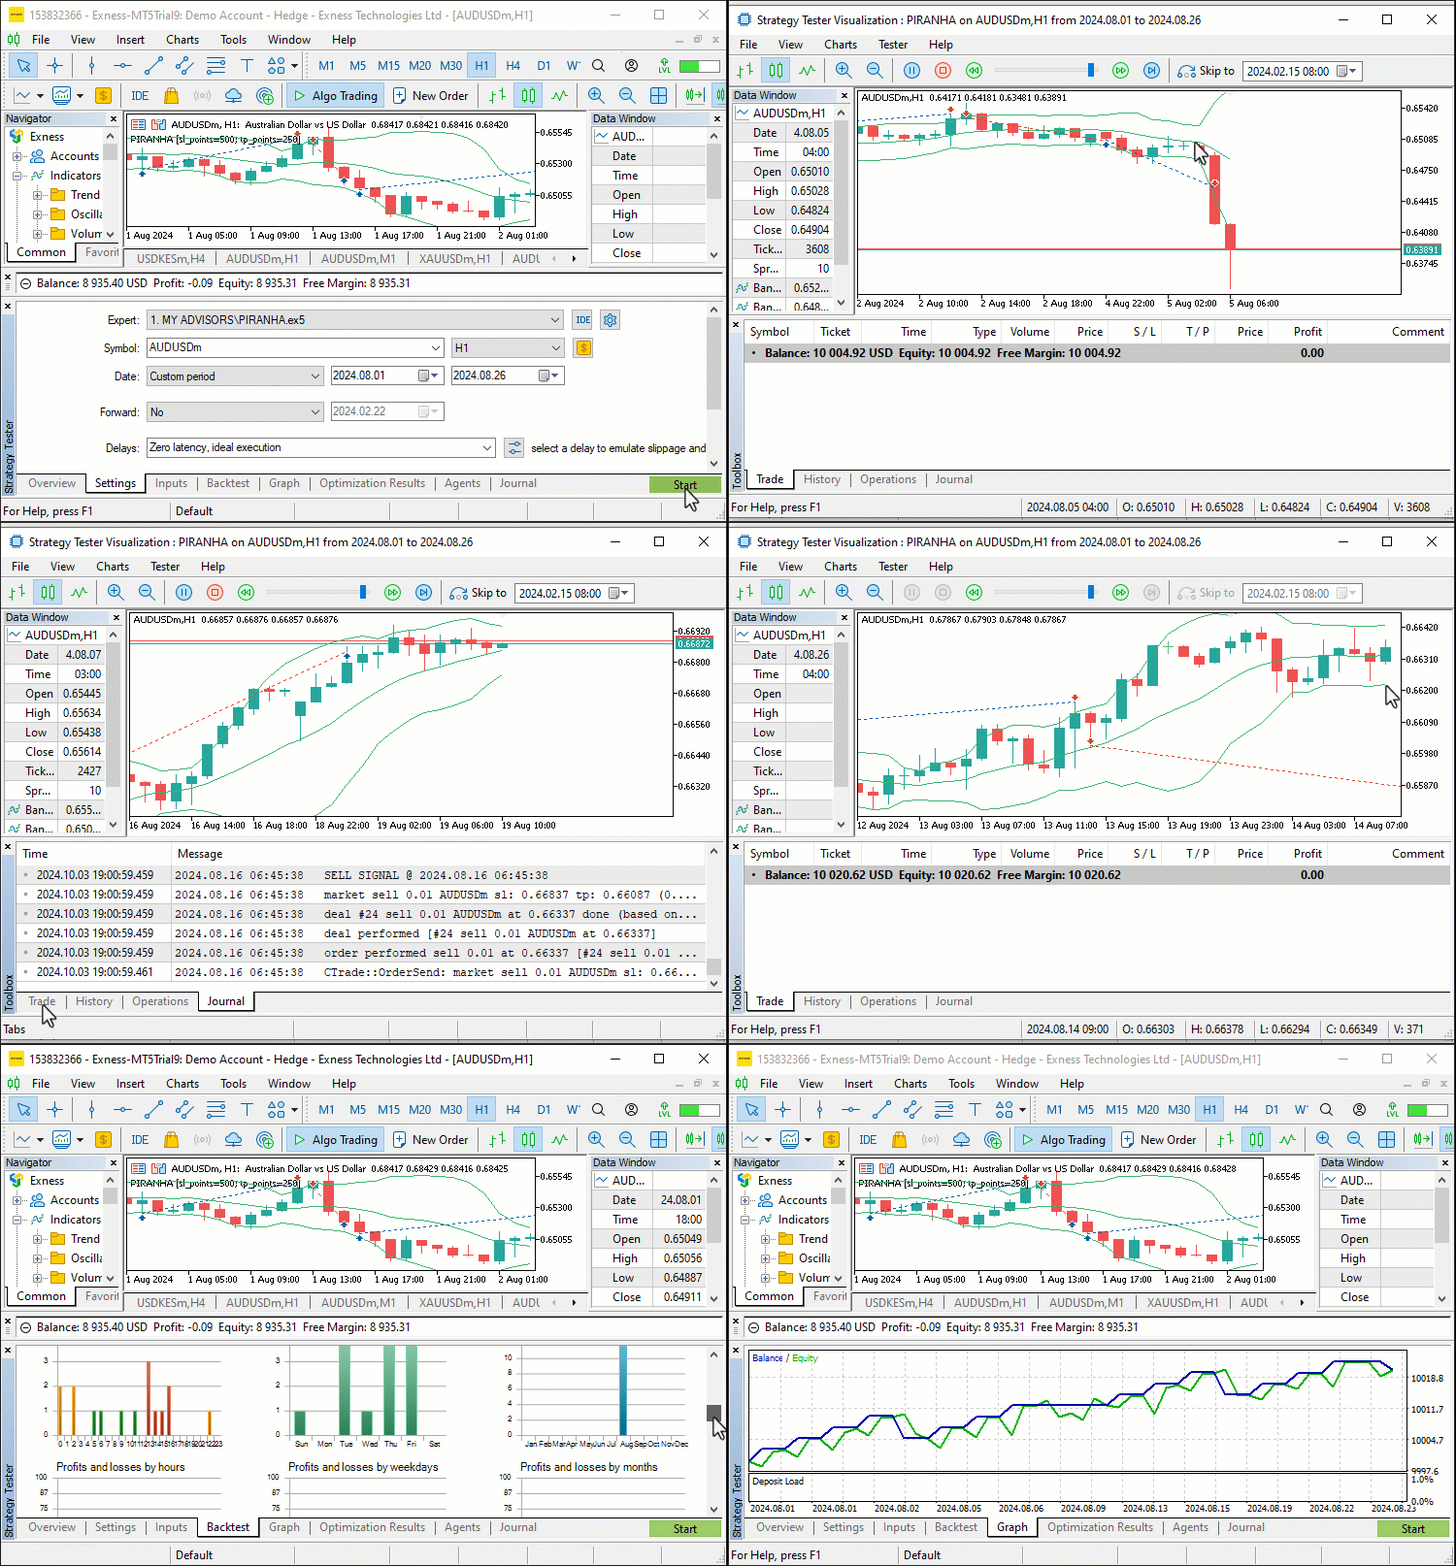
That was a success! We can conclude that the program worked as expected. The final source code snippet responsible for the creation and implementation of the Piranha strategy is as follows:
//+------------------------------------------------------------------+
//|                                                      PIRANHA.mq5 |
//|                        Allan Munene Mutiiria, Forex Algo-Trader. |
//|                                     https://forexalgo-trader.com |
//+------------------------------------------------------------------+

//--- Properties to define metadata about the Expert Advisor (EA)
#property copyright "Allan Munene Mutiiria, Forex Algo-Trader."   //--- Copyright information
#property link      "https://forexalgo-trader.com"               //--- Link to the creator's website
#property version   "1.00"                                       //--- Version number of the EA

//--- Including the MQL5 trading library
#include <Trade/Trade.mqh>      //--- Import trading functionalities
CTrade obj_Trade;               //--- Creating an object of the CTrade class to handle trading operations

input int sl_points = 500;
input int tp_points = 250;

//--- Defining variables for Bollinger Bands indicator and price arrays
int handleBB = INVALID_HANDLE;  //--- Store Bollinger Bands handle; initialized as invalid
double bb_upper[], bb_lower[];  //--- Arrays to store upper and lower Bollinger Bands values

//--- Flags to track if the last trade was a buy or sell
bool isPrevTradeBuy = false, isPrevTradeSell = false;  //--- Prevent consecutive trades in the same direction

//+------------------------------------------------------------------+
//| Expert initialization function                                   |
//+------------------------------------------------------------------+
int OnInit()
  {
   //--- Create Bollinger Bands indicator handle with a period of 12, no shift, and a deviation of 2
   handleBB = iBands(_Symbol, _Period, 12, 0, 2, PRICE_CLOSE);

   //--- Check if the Bollinger Bands handle was created successfully
   if (handleBB == INVALID_HANDLE){
      Print("ERROR: UNABLE TO CREATE THE BB HANDLE. REVERTING");  //--- Print error if handle creation fails
      return (INIT_FAILED);  //--- Return initialization failed
   }

   //--- Set the arrays for the Bollinger Bands to be time-series based (most recent data at index 0)
   ArraySetAsSeries(bb_upper, true);  //--- Set upper band array as series
   ArraySetAsSeries(bb_lower, true);  //--- Set lower band array as series

   return(INIT_SUCCEEDED);  //--- Initialization successful
  }

//+------------------------------------------------------------------+
//| Expert deinitialization function                                 |
//+------------------------------------------------------------------+
void OnDeinit(const int reason)
  {
   //--- Function to handle cleanup when the EA is removed from the chart
   IndicatorRelease(handleBB); //--- Release the indicator handle
  }

//+------------------------------------------------------------------+
//| Expert tick function                                             |
//+------------------------------------------------------------------+
void OnTick()
  {
   //--- Retrieve the most recent Bollinger Bands values (3 data points)
   if (CopyBuffer(handleBB, UPPER_BAND, 0, 3, bb_upper) < 3){
      Print("UNABLE TO GET UPPER BAND REQUESTED DATA. REVERTING NOW!");  //--- Error if data fetch fails
      return;
   }
   if (CopyBuffer(handleBB, LOWER_BAND, 0, 3, bb_lower) < 3){
      Print("UNABLE TO GET LOWER BAND REQUESTED DATA. REVERTING NOW!");  //--- Error if data fetch fails
      return;
   }

   //--- Get current Ask and Bid prices
   double Ask = NormalizeDouble(SymbolInfoDouble(_Symbol, SYMBOL_ASK), _Digits);  //--- Normalize Ask price to correct digits
   double Bid = NormalizeDouble(SymbolInfoDouble(_Symbol, SYMBOL_BID), _Digits);  //--- Normalize Bid price to correct digits

   //--- Get the low and high prices of the current bar
   double low0 = iLow(_Symbol, _Period, 0);    //--- Lowest price of the current bar
   double high0 = iHigh(_Symbol, _Period, 0);  //--- Highest price of the current bar

   //--- Get the timestamp of the current bar
   datetime currTimeBar0 = iTime(_Symbol, _Period, 0);  //--- Time of the current bar
   static datetime signalTime = currTimeBar0;           //--- Static variable to store the signal time

   //--- Check for a buy signal when price crosses below the lower Bollinger Band
   if (low0 < bb_lower[0] && signalTime != currTimeBar0){
      Print("BUY SIGNAL @ ", TimeCurrent());  //--- Log the buy signal with the current time
      signalTime = currTimeBar0;              //--- Update signal time to avoid duplicate trades
      if (PositionsTotal() == 0 && !isPrevTradeBuy){
         obj_Trade.Buy(0.01, _Symbol, Ask, Ask - sl_points * _Point, Ask + tp_points * _Point);  //--- Open a buy position with predefined parameters
         isPrevTradeBuy = true; isPrevTradeSell = false;  //--- Update trade flags
      }
   }

   //--- Check for a sell signal when price crosses above the upper Bollinger Band
   else if (high0 > bb_upper[0] && signalTime != currTimeBar0){
      Print("SELL SIGNAL @ ", TimeCurrent());  //--- Log the sell signal with the current time
      signalTime = currTimeBar0;               //--- Update signal time to avoid duplicate trades
      if (PositionsTotal() == 0 && !isPrevTradeSell){
         obj_Trade.Sell(0.01, _Symbol, Bid, Bid + sl_points * _Point, Bid - tp_points * _Point);  //--- Open a sell position with predefined parameters
         isPrevTradeBuy = false; isPrevTradeSell = true;  //--- Update trade flags
      }
   }
  }
//+------------------------------------------------------------------+
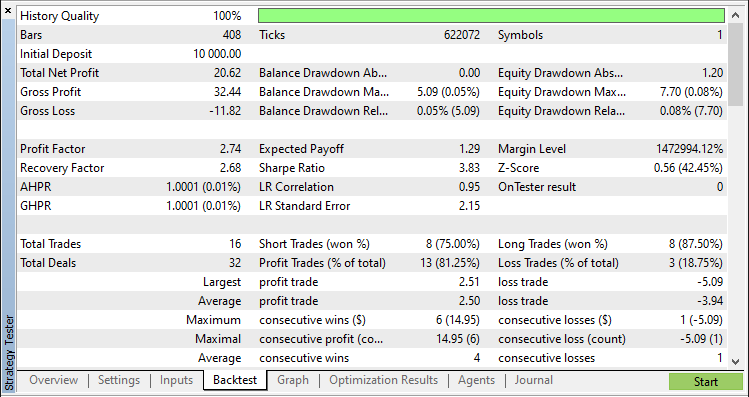
Backtest Results:
Backtest Graph:
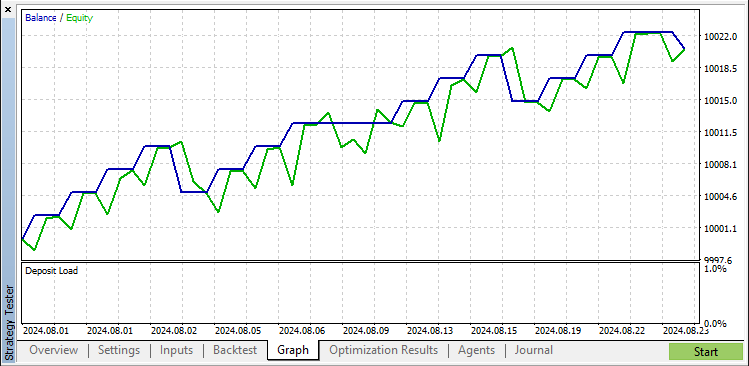
We optimized the input parameters and verified the strategy's performance with the strategy tester during this testing phase. The adjustments that we made to the Stop Loss and Take Profit values gave the PIRANHA strategy more flexibility. It now can handle market fluctuations. We've confirmed that the strategy works as intended and achieves favorable results when we backtest and optimize it.
Conclusion
In this article, we explored the development of an MetaQuotes Language 5 (MQL5) Expert Advisor based on the PIRANHA strategy, utilizing Bollinger Bands to identify potential buy and sell signals. We began by understanding the fundamentals of the PIRANHA strategy, followed by a detailed overview of Bollinger Bands, highlighting their role in detecting market volatility and setting up trade entries and exits.
Throughout the implementation, we illustrated the step-by-step coding process, configured indicator handles, and implemented the trade logic. To ensure optimal performance, we adjusted critical inputs and tested the program using MetaTrader 5’s Strategy Tester, validating the strategy’s effectiveness in various market conditions.
Disclaimer: The information presented in this article is for educational purposes only. It is intended to provide insights into creating an Expert Advisor (EA) based on the PIRANHA strategy and should serve as a foundation for developing more advanced systems with further optimization and testing. The strategies and methods discussed do not guarantee any trading results, and the use of this content is at your own risk. Always ensure thorough testing and consider potential market conditions before applying any automated trading solution.
Overall, this article serves as a guide for automating the PIRANHA strategy and customizing it to suit your trading style. We hope that it provides valuable insights and encourages further exploration into creating sophisticated trading systems in MQL5. Happy coding and successful trading!
 Features of Custom Indicators Creation
 Developing a multi-currency Expert Advisor (Part 12): Developing prop trading level risk manager
 Features of Experts Advisors
 Header in the Connexus (Part 3): Mastering the Use of HTTP Headers for Requests
- Free trading apps
- Over 8,000 signals for copying
- Economic news for exploring financial markets
You agree to website policy and terms of use