MetaTrader 4용 새 기술 지표

Hello fellow trader, I have built this indicator by combining trend and entry mechanisms i have used for years. This is one of my high probability strategies. All calculations are done based on pure price action-based market structure. Multiple confluences are used to validate and filter entries. All calculations are done behind the scenes, and you are given only buy sell signals. Accuracy becomes higher and higher as you trade higher timeframes, also based on my experience with the technique,
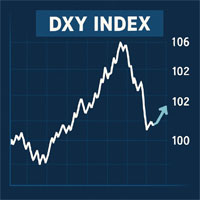
DXY Index indicator to help predict USD effect to your trade. DXY Index will help to see the power of USD.
For example if you trade XAUUSD and the DXY Index weaker, it could be the XAU will be bullish.
The same if DXY Index getting stronger, it could be that XAU will be bearish. I hope this indicator will help many trader to have better position to trade. Use this indicator wisely.

SMC 세션 지표는 ICT 개념, 유동성 사냥 및 세션 기반 전략 에 의존하는 스마트 머니 트레이더를 위해 제작된 정밀 도구입니다.기관 수준 트레이더가 사용하는 가장 입증되고 인기 있는 개념을 사용하여 중요한 세션 기반 거래 구역을 원활하게 매핑합니다.이 올인원 세션 지표는 다음을 포함하여 가장 효과적이고 확률이 높은 범위 전략으로 차트를 오버레이합니다.ICT 아시아 범위, 런던 브레이크아웃, 뉴욕 범위, ICT 런던 오픈 킬존, ICT 뉴욕 오픈 킬존, 오프닝 범위 브레이크아웃(ORB) ( 런던, 뉴욕, 도쿄 포함) 및 강력한 자정 오프닝 범위 .또한 시드니, 도쿄, 런던 및 뉴욕 을 포함한 주요 외환 거래 세션을 강조 표시합니다.각 범위는 TimeBox 방법론을 사용하여 최대 정확도로 그려져 주요 FVG(공정 가치 갭), 범위 스윕, 세션 최고/최저 및 잠재적인 마켓 메이커 조작 구역을 식별하는
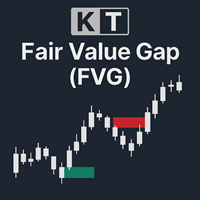
KT Fair Value Gap(FVG)는 시장에서 일시적인 가격 불균형이 발생한 구간을 식별하고 시각적으로 강조 표시합니다. 이러한 갭은 가격이 계속 움직일 수 있는 잠재적인 구간이 되며, 경우에 따라 반전 지점(역방향 FVG라고도 함)으로 작용할 수 있습니다. 강세 FVG: 녹색 박스로 표시되며, 가격이 상승 흐름을 다시 이어갈 수 있는 지지 구간 역할을 합니다. 갭이 메워지면 가격이 반전될 수 있는 전환 구간이 되기도 합니다. 약세 FVG: 빨간색 박스로 표시되며, 가격이 하락세를 지속할 수 있는 저항 구간을 나타냅니다. 강세 FVG와 마찬가지로 갭이 메워진 후에는 반전이 일어날 수도 있습니다.
주요 기능 깔끔하고 직관적인 디자인: FVG 영역을 명확하게 보여주도록 설계되어 차트를 복잡하게 만들지 않으며, 트레이더가 집중할 수 있도록 도와줍니다. 인사이트 대시보드: 화면에 표시되는 소형 패널에서 처리된 FVG와 미처리된 FVG의 비율을 한눈에 확인할 수 있습니다. 완벽한 사용

런던 세션 브레이크아웃 전략 지표는 ICT(Inner Circle Trader) 및 스마트 머니 컨셉(SMC)을 따르는 트레이더를 위해 설계되었으며, 런던 세션 동안 세션 기반 유동성 헌트, 킬존, 그리고 마켓 메이커의 움직임 에 중점을 둡니다. 이 도구 는 00:00 (GMT)에서 07:00(GMT) 사이의 최고가와 최저가를 포착하는데, 이는 일반적으로 런던 킬존 또는 마켓 메이커 범위 로 알려져 있습니다. 이 지표는 트레이더가 기관 거래와 변동성 급증이 가장 빈번하게 발생하는 잠재적 브레이크아웃 구역을 파악하는 데 도움을 줍니다.
이 지표는 세션 타임박스, 가격 범위, 적정 가격 갭(FVG), 그리고 돌파 수준을 깔끔한 그래픽을 통해 시각적으로 강조합니다. 런던 세션의 핵심 움직임인 유동성 스윕, 범위 조정, 그리고 급격한 가격 확장 에 대한 분석을 지원합니다. 유동성 구역 및 시장 구조 변
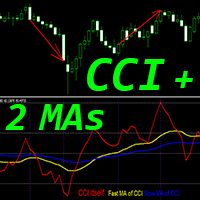
MT4용 Crypto_Forex 지표 "CCI 및 2개 이동 평균", 리페인트 없음.
- Commodity_Channel_Index(CCI)는 추세 방향의 모멘텀 트레이딩에 매우 유용합니다. - "CCI 및 2개 이동 평균" 지표를 통해 CCI 지표의 빠른 이동 평균과 느린 이동 평균을 확인할 수 있습니다. - 상승 추세 - 빠른 이동 평균이 느린 이동 평균 위에 있는 경우; 하락 추세 - 빠른 이동 평균이 느린 이동 평균 아래에 있는 경우. - CCI는 트레이딩에 가장 많이 사용되는 오실레이터 중 하나로, 현재 가격과 과거 평균 가격의 차이를 측정합니다. - 옵션 1 - 50에서 -50 사이의 중앙 영역에서 추세 방향으로 진입하고, 지표가 200/-200 영역에 도달하면 청산합니다. - 중요 레벨: +/-200, 옵션 2 - +200 이상에서는 매도 진입, -200 이하에서는 매수 진입으로 추세 방향으로 진입합니다. - 이 지표는 추세 변화를 매우 일찍 확인할 수 있는 기회를
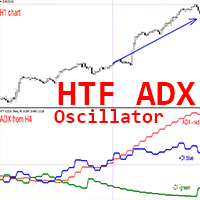
MT4용 Crypto_Forex 지표 HTF ADX.
- MT4용 전문 HTF ADX 지표로 거래 방식을 업그레이드하세요. HTF는 상위 시간대를 의미합니다. - ADX(빨간색 선)는 추세 강도를 측정하는 데 사용됩니다. ADX 값이 20 이상이고 상승 추세를 보이면 추세가 강하다는 것을 의미합니다. - +DMI(파란색 선)가 -DMI(녹색 선) 위에 있으면 가격이 상승하고 있으며, ADX는 상승 추세의 강도를 측정합니다. - -DMI(녹색 선)가 +DMI(파란색 선) 위에 있으면 가격이 하락하고 있으며, ADX는 하락 추세의 강도를 측정합니다. - 이 지표는 다중 시간대 추세 거래에 매우 유용합니다. 상위 시간대의 ADX를 현재 차트에 적용할 수 있습니다.
// 훌륭한 트레이딩 로봇과 지표는 여기에서 확인하실 수 있습니다: https://www.mql5.com/en/users/def1380/seller 본 제품은 MQL5 웹사이트에서만 제공되는 정품입니다.

MT4용 Crypto_Forex 지표 Heiken Ashi Histo Filter - 훌륭하고 효율적인 보조 트레이딩 도구입니다! 리페인트 필요 없음!
- 새로운 고급 계산 방식 사용 - "계산 가격" 매개변수에 10가지 옵션 제공 - 가격 변동 패턴과 함께 사용하면 더욱 효과적입니다. - 녹색 히스토그램 - 상승 패턴을 찾습니다. - 자홍색 히스토그램 - 하락 패턴을 찾습니다. - 이 지표를 사용하면 표준 전략도 업그레이드할 수 있는 풍부한 기회를 제공합니다. - 지표에는 모바일, PC 및 이메일 알림 기능이 내장되어 있습니다.
// 훌륭한 트레이딩 로봇과 지표는 다음 링크에서 확인하실 수 있습니다. https://www.mql5.com/en/users/def1380/seller MQL5 웹사이트에서만 제공되는 오리지널 제품입니다.
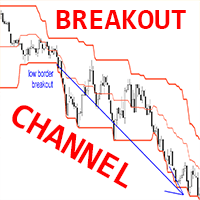
Crypto_Forex MT4용 브레이크아웃 채널 지표, 리페인트 없음.
- 이 지표는 고가/저가 브레이크아웃을 기반으로 하는 완벽한 거래 시스템으로 사용할 수 있습니다. - 이 지표는 단 하나의 매개변수, 즉 HYSTORY DEPTH만 가지고 있으며, 이는 지표가 고려하는 캔들 수를 나타냅니다. - HYSTORY DEPTH 매개변수 권장 값: D1 - 20(1개월), H4 - 30(1주일), H1 - 24(1일). - 브레이크아웃 채널은 세 개의 선으로 구성됩니다. 고가 경계선 - 최근 N개(HYSTORY DEPTH 매개변수) 캔들의 최고가, 저가 경계선 - 최근 N개(HYSTORY DEPTH 매개변수) 캔들의 최저가, 그리고 중간선. - 이 지표는 다른 지표/가격 움직임 패턴과 함께 사용할 수 있습니다. - 브레이크아웃 채널 지표 사용 예시는 그림에서 확인할 수 있습니다.
// 훌륭한 트레이딩 로봇과 지표는 여기에서 확인하실 수 있습니다: https://www.mql5.co
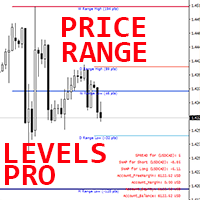
MT4용 외환 지표 "가격 범위 레벨 프로"
- "가격 범위 레벨 프로" 지표는 매우 유용한 전문 보조 거래 도구입니다. - 가격(가격 범위 레벨)을 통해 도달 가능한 가장 가능성 있는 일별, 주별, 월별 수준을 보여줍니다. - 일별 범위는 당일 거래자에게 유용합니다. - 주별 및 월별 범위는 스윙 및 장기 거래자에게 유용합니다. - 이 지표는 이익실현 목표가를 계획하거나 손절매를 설정하는 데 매우 유용합니다. - 정보 스프레드 스왑 표시 기능 - 해당 통화쌍의 현재 스프레드와 스왑을 표시합니다. - 계좌 잔액, 자본금, 증거금도 표시합니다. - 정보 스프레드 스왑 표시는 차트의 어느 곳에서나 찾을 수 있습니다. 0 - 왼쪽 상단, 1 - 오른쪽 상단, 2 - 왼쪽 하단, 3 - 오른쪽 하단
// 훌륭한 트레이딩 로봇과 지표는 여기에서 확인하실 수 있습니다: https://www.mql5.com/en/users/def1380/seller 본 제품은 MQL5 웹사이트에서만 제공되

MT4용 Crypto_Forex 지표 "RSI SPEED" - 훌륭한 예측 도구, 재도색 불필요
- 이 지표는 물리학 방정식을 기반으로 계산됩니다. RSI SPEED는 RSI 자체의 1차 미분값입니다. - RSI SPEED는 주요 추세 방향으로 스캘핑 진입에 유용합니다. - HTF MA(그림 참조)와 같은 적절한 추세 지표와 함께 사용하세요. - RSI SPEED 지표는 RSI 자체의 방향이 얼마나 빨리 변하는지를 보여주며, 매우 민감합니다. - 모멘텀 거래 전략에는 RSI SPEED 지표 사용을 권장합니다. RSI SPEED 지표 값이 0보다 작으면 가격 모멘텀이 하락하고, 0보다 크면 가격 모멘텀이 상승합니다. - 모바일 및 PC 알림 기능이 내장되어 있습니다.
// 훌륭한 트레이딩 로봇과 지표는 여기에서 확인하실 수 있습니다: https://www.mql5.com/en/users/def1380/seller 본 제품은 MQL5 웹사이트에서만 제공되는 정품입니다.
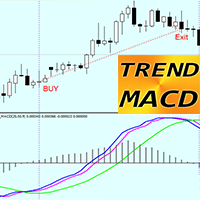
MT4용 TREND MACD 지표 - 훌륭하고 효율적인 거래 도구입니다!
- 이 지표는 큰 가격 변동을 포착하는 데 집중하는 추세 트레이더에게 유용합니다. - TREND MACD는 3개의 선으로 구성됩니다. 녹색선은 주요 추세 방향을 나타내며, 파란색과 자홍색선은 진입 및 청산 시점을 나타냅니다. - 지표를 사용하면 수익을 극대화할 수 있습니다. 수익성 있는 거래에서 너무 일찍 청산하지 않도록 합니다. - 지표에는 모바일 및 PC 알림 기능이 내장되어 있습니다.
매수 거래에 지표를 사용하는 방법(그림 참조): 1) 파란색선과 자홍색선이 모두 녹색선 위에 있는지 확인합니다. 2) 파란색선이 자홍색선 위에 있으면 매수합니다. 3) 파란색선이 자홍색선 아래에 있으면 청산합니다. 4) 매도 거래의 경우 반대로 합니다.
// 훌륭한 트레이딩 로봇과 지표는 여기에서 확인하실 수 있습니다: https://www.mql5.com/en/users/def1380/seller 본 제품은 MQL5
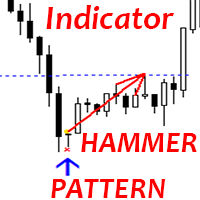
MT4용 Crypto_Forex 지표 "망치 패턴"
- "망치 패턴" 지표는 가격 변동 거래에 매우 강력한 지표입니다. 재도색이나 지연 없이 작동합니다. - 이 지표는 차트에서 상승 망치 패턴을 감지합니다. 차트에 파란색 화살표 신호가 나타납니다(그림 참조). - PC, 모바일 및 이메일 알림 기능을 제공합니다. - "망치 패턴" 지표는 지지/저항선과 함께 사용하기에 매우 좋습니다. ..................................................................................................................................................... // 훌륭한 트레이딩 로봇과 지표는 다음 링크에서 확인하실 수 있습니다: https://www.mql5.com/en/users/def1380/seller 본 제품은 MQL5 웹사이트에서만 제공되는 정품 제품입니다.
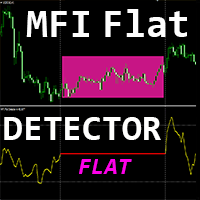
Crypto_Forex 지표 "MFI FLAT Detector"는 트레이딩에 효율적인 보조 도구입니다! 리페인트 없이도 가능합니다. MT4용 이 훌륭한 지표로 트레이딩 방식을 업그레이드해 보세요.
- 이 지표는 차트에서 가격이 평평한 영역을 표시합니다. 플랫 감지를 담당하는 "플랫 민감도" 매개변수를 가지고 있습니다. - "MFI FLAT Detector"는 다이버전스 감지에 매우 유용하며, 가격 움직임과 함께 사용하면 더욱 효과적입니다. - 추세 추종 시스템에서 플랫 영역을 감지하고 해당 영역에서의 거래를 피할 수 있습니다. - 반전 스캘핑(플랫 경계에서 반전 거래)에도 사용할 수 있습니다. - 표준 MFI 오실레이터 대신 "MFI FLAT Detector"를 사용할 수 있는 방법은 많습니다. - 자금 흐름 지수(MFI) 자체는 가격과 거래량 데이터를 사용하여 과매도 및 과매수 영역을 식별하는 기술적 오실레이터입니다. - MFI가 80 이상이면 매수 과열에서 매도 진입을, 20

뉴욕 레인지 지표는 ICT(Inner Circle Trader) 개념, 스마트 머니 거래, 그리고 기관 가격 행동 기법을 적용하는 트레이더를 위해 개발된 세션 기반 분석 도구입니다. 뉴욕 세션에 맞춰 특별히 설계된 이 지표는 런던 종가 와 뉴욕 시가가 겹치는 중요한 시점인 12:00 에서 14:00(GMT) 사이의 가격 범위를 포착합니다. 세션 최고가와 최저가를 파악하고, 공정가치 갭(FVG)을 감지하며, 잠재적인 유동성 스윕 구역을 강조하여 트레이더가 마켓 메이커의 움직임, 세션 레인지 이탈, 그리고 되돌림 기회를 정확하게 분석할 수 있도록 지원합니다.
이 전략은 뉴욕 킬존 과 런던 뉴욕 세션이 겹치는 동안 발생하는 시장 구조 변화 와 축적 또는 분배 패턴을 이해하는 데 중점을 둡니다. 이 지표는 구조 붕괴(BOS), 시장 구조 변화(MSS), 변위 캔들, 불균형
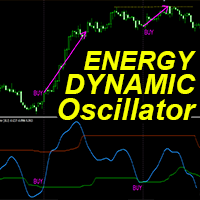
"다이내믹 에너지 오실레이터"는 MT4를 위한 고급 맞춤형 암호화폐/외환 지표이자 효율적인 트레이딩 도구입니다!
- 차세대 오실레이터 - 사용 방법은 그림을 참조하세요. - 다이내믹 에너지 오실레이터는 적응형 과매수/과매수 영역을 제공합니다. - 추세 시장에서 매우 유용한 기술적 모멘텀 지표입니다. - 오실레이터는 과매수/과매수 영역에서 정확한 진입 시점을 찾는 보조 도구입니다. - 과매도: 녹색선 아래, 과매수: 주황색선 위. - 일반 오실레이터보다 훨씬 정확합니다. 적합한 시간대: M30, H1, H4, D1, W1. - PC 및 모바일 알림 기능 제공.
// 훌륭한 트레이딩 로봇과 지표는 다음 링크에서 확인하실 수 있습니다: https://www.mql5.com/en/users/def1380/seller MQL5 웹사이트에서만 제공되는 오리지널 제품입니다.
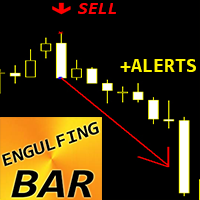
MT4용 Crypto_Forex 지표 ENGULFING 막대 패턴.
- "ENGULFING 막대" 지표는 가격 변동 거래에 매우 강력한 지표입니다. 재도색이나 지연 없이 작동합니다. - 이 지표는 차트에서 Engulfing 막대 패턴을 감지합니다. - 상승 Engulfing 막대 - 차트에 파란색 화살표 신호(그림 참조). - 하락 Engulfing 막대 - 차트에 빨간색 화살표 신호(그림 참조). - PC, 모바일 및 이메일 알림 기능을 제공합니다. - "ENGULFING 막대 패턴" 지표는 지지/저항 레벨과 결합하기 매우 좋습니다.
// 훌륭한 트레이딩 로봇과 지표는 다음 링크에서 확인하실 수 있습니다: https://www.mql5.com/en/users/def1380/seller MQL5 웹사이트에서만 제공되는 오리지널 제품입니다.

이 인디케이터는 공격적인 스캘핑 과 바이너리 옵션의 빠른 진입 을 위해 설계되었습니다 . 모든 캔들마다 신호를 생성하여 언제든지 시장 상황을 정확히 파악할 수 있습니다.
실시간 거래를 확인하세요: https://youtu.be/QR5F_9uIb6k Happy Scalping 채널에 가입하세요: https://www.mql5.com/en/channels/forexnewadvisor
리페인팅 없음 : 현재 캔들의 신호는 실시간 으로 생성됩니다. 아직 캔들이 마감되지 않았다면 가격이 이전 캔들의 종가를 상회하거나 하회할 때 색상이 바뀔 수 있습니다.
하지만 캔들이 마감되면 , 신호의 색상은 완전히 고정됩니다 . 바뀌지 않고, 사라지지 않으며, 이동하지 않습니다. 보이는 그대로가 그대로 유지됩니다.
왜 이렇게 설계되었을까요? 많은 스캘퍼들이 돌파나 급격한 움직임 이 발생할 때 즉시 신호를 받고 싶어 합니다. 그래야 그 순간 빠르게 진입해 수익을 낼 수 있기 때
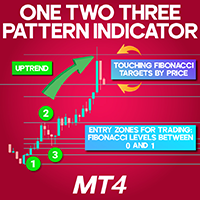
1-2-3 Pattern Indicator for MetaTrader 4
The 1-2-3 Pattern Indicator for MetaTrader 4 is a sophisticated technical tool designed to identify potential market reversals. It highlights three significant turning points, connecting them with a ZigZag pattern to visually map the price trajectory. Once the formation is complete, the indicator automatically generates Fibonacci retracement levels between the first two points to assist with trade planning. «Indicator Installation & User Guide»
MT4 Indi
FREE

Core Drift Index: Your Reliable Guide in the World of Trading Core Drift Index is an innovative trend indicator designed for precise detection of market directions and reversal points . This powerful tool enables traders to optimize their investments , minimize risk, and maximize profit. Key Features and Benefits Intuitive Trend Detection Core Drift Index clearly shows trend direction, helping traders make timely entry and exit decisions. High Probability of Success With its high accuracy
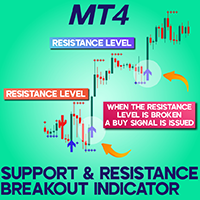
Support Resistance Breakout Indicator (SRBAI) download for MetaTrader 4
The Support Resistance Breakout Indicator (SRBAI) available for MetaTrader 4 (MT4) is designed to highlight significant pivot zones by mapping support and resistance levels on the price chart. Blue dashed lines represent support zones, while red dashed lines indicate resistance levels. Once the price breaks through a support area, the indicator generates a sell alert with a red downward-pointing arrow. Conversely, a resista
FREE

Average Daily Range (ADR) Indicator for MetaTrader 4 The Average Daily Range (ADR) Indicator for MetaTrader 4 is a vital technical analysis tool used to assess the typical price movement range an asset experience during a trading day.
By analyzing the average distance between daily highs and lows over a specified number of days, this indicator defines the ADR High (upper boundary) and ADR Low (lower boundary), helping traders identify possible support and resistance zones. «Indicator Installatio
FREE
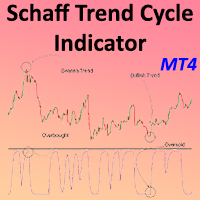
Schaff Trend Cycle Indicator for MetaTrader4 The Schaff Trend Cycle Indicator for MetaTrader4 merges the core functionalities of two widely used indicators—MACD (Moving Average Convergence Divergence) and the Stochastic Oscillator. This tool is engineered to identify trend reversals and momentum extremes with enhanced sensitivity. Readings below 25 often signal an oversold market, while values above 75 highlight overbought conditions. This makes the STC highly reliable for early trend recognitio
FREE
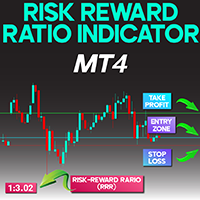
Risk Reward Indicator for MetaTrader 4
The Risk Reward Indicator for MetaTrader 4 is developed to assist traders in determining the potential risk and return of a trading position. It calculates the Risk-to-Reward Ratio (RRR) using three key levels: Entry Price (EP), Stop Loss (SL), and Take Profit (TP).
This tool graphically presents the RRR at the top-left corner of the chart and highlights the trade levels with three distinct horizontal lines:
• Green Line – Indicates the Take Profit level
•
FREE
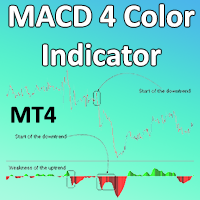
MACD 4 Color Indicator for MetaTrader 4
The MACD 4 Color Indicator for MetaTrader 4 (MACD 4C) is a refined upgrade of the traditional MACD, designed to not only indicate trend direction but also visualize the strength of the trend using four distinct color codes. These color variations are derived from the gradient of the moving average lines. It is particularly effective for identifying when a trend begins or starts to fade. The tool also incorporates divergence and convergence principles, mak
FREE
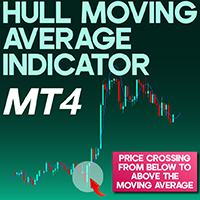
Hull Moving Average Indicator MetaTrader 4
The Hull Moving Average (Hull MA) indicator, developed by Alan Hull, is designed to minimize delay in standard moving averages and enhance responsiveness in trend evaluation. Available on the MetaTrader 4 platform, this indicator allows traders to spot short-term directional moves with greater clarity. It serves as an effective tool for identifying optimized trade entry and exit points. «Indicator Installation & User Guide»
MT4 Indicator Installation
FREE
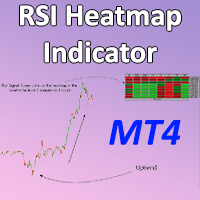
RSI Heatmap Indicator for MetaTrader4 The RSI Heatmap Indicator is a powerful technical tool in MetaTrader 4 that allows traders to assess the relative strength conditions of different currency pairs via a color-coded heatmap. By merging the Relative Strength Index (RSI) with a visual heatmap approach, this indicator simplifies market analysis by displaying strength and directional bias of multiple instruments at a glance. This indicator produces a heatmap based on calculated RSI levels across v
FREE
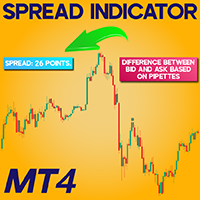
Spread Indicator download For Meta Trader 4
The Spread Indicator on MetaTrader 4 (MT4) serves to reveal the real-time gap between the Bid and Ask values. This variance, calculated in points (pipettes), appears clearly at the upper-left section of the chart window. «Indicator Installation & User Guide»
MT4 Indicator Installation | Spread Indicator Download for MT5 | ALL Products By TradingFinderLab | Best MT4 Indicator: Refined Order Block Indicator for MT4 | Best MT4 Utility: Trade
FREE
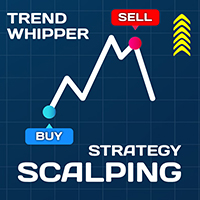
Trend detection is one of the basic challenges of every trader. Finding a way to tell when to enter a trade is very important, timing is a game changer, not too early and not too late. Sometimes, due to not knowing the market conditions, the trader closes his positions with a small profit or allows the losses to grow, these are the mistakes that novice traders make. Indicator Trend Whipper is a complete trading strategy and can improve the trader's trading process. The trend detection algorithm

Indicator defines the buy and sell arrows with high performance and consistent results . Automatic analysis of market opportunities ; Identifies a direction of a trend; Suitable for trend trading or following the trend;
This is FREE demo version of the indicator and works only on "EURUSD M5".
Forex Trend Commander full version: All details about the indicator here : Works in all symbols + free Multi Currency Scanner + free SPECIAL BONUS .
FREE
Warp Range Sensor: The Color of Your Trend Warp Range Sensor is a trend direction indicator that visually displays the current market condition by coloring bars red and blue based on trend direction. What Does Warp Range Sensor Do? Identifies the Current Trend Direction Blue bars indicate an uptrend Red bars signal a downtrend Universal Application
Compatible with all currency pairs and timeframes , from short-term scalping to long-term trading. Powered by Market Context & Historical Data
W

Rocket pro is a powerful indicator for MetaTrader 4, designed to identify the most relevant trends in the financial market. If you are looking for a tool that accurately predicts movements, Rocket pro is your ally.
Live signal: https://www.mql5.com/en/signals/2303662 How it works: This indicator combines three different methods - volume analysis, candlestick closing and symmetrical trend - to detect and signal buying and selling opportunities. Rocket pro is like a "rocket" when it detects a bu

Divergence Divergence refers to when the price of a currency pair moves in one direction while the trend indicator is moving in the opposite direction. With divergence, there can be positive and negative signals. Divergences in Forex trading are quite common signals of technical analysis. These are basic early Forex signals indicating the trend reversal and filter false signals. Application of this indicator It is usually not easy to detect divergences by the trader and it may be time-consuming
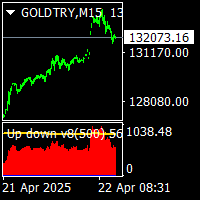
Up down v8 indicator is no repaint counter trend indicator . it try to find market up down points. it works all timeframes and all pairs. suitable for beginner and experienced trader. there is wave and c values to set defaults. minimum processed value cnt can be equal to wave value. traders can change them suitable up down points on different time frames. indicator use moving averages histograms and volatilty trigger. when red histogram is over volatility level that is tops. . when blue histogr
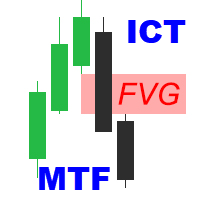
ICT Fair Value Gaps MTF Indicator Unlock the power of Fair Value Gaps (FVGs) across multiple timeframes using the ICT Fair Value Gaps Multi - Timeframe Indicator —a precision tool built for traders who follow the Smart Money Concept (SMC) . Key Features : Multi-Timeframe FVG Detection : Automatically identifies Fair Value Gaps from higher timeframes (M15, H1, H4, etc.) and plots them on your active chart for immediate insight. Break of Structure (BOS) & Change of Character (CHoCH

Convenient Dashboard for Moving Average Crossover Trading Strategy . On the panel, numbers display how many candles ago a signal occurred. The number 0 means the signal is on the current candle (it may disappear if the crossover does not hold). The number 1 means the signal was on the previous candle (arrows remain, as moving averages have confirmed the crossover). Moving averages can optionally be added, but the indicator works without them. Advantages of the indicator : Automa

Price Change Indicator Introduction The Price Change Indicator is a powerful tool designed to help traders identify significant price movements over a specified period. By calculating and visualizing percentage changes between current and historical prices, it allows traders to quickly spot potential trading opportunities when markets show unusual volatility or momentum. Features Real-time monitoring of price changes Visual histogram display when changes exceed threshold Text display showing cur
FREE
As the suggested, with this indicator you are able to switch from one symbol or timeframe to another in the same single chart. So forget about opening tons of chart on your screen! It's not designed for ICT or SMC trader, but if you are that kind of trader you still can use it. Imagine you have a strategy containing various indicators and settings, on a single chart you can screen the entry opportunity then move to the next symbol or timeframe.
FREE
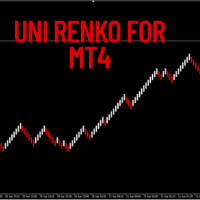
This versatile tool lets you create various Renko-style charts, including Median Renko, Mean Renko, and Traditional Renko with wicks . It offers a wide range of chart options to suit the needs of day traders, scalpers, and long-term investors.
Indicator Settings Starting Price. Box Size (in pips). Shift Percent. Timeframe Name. Show Wicks (On or Off). Amount of Bars.
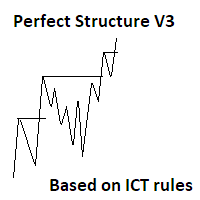
Here is the V3 of perfect structure. Whats new? (Please check added screenshots for better understanding.) 1. Coded based on ICT rules. 2. No more trend confusions...-- Added labels to show current trend 3. No more timeframe juggling and missing out important points, -- Now You can add indicator multiple times to mark multi timeframe structure on the same chart window( 1D structure on 4H or may be 4H structure on 15 min timeframe and more.....) 4. No more waiting in large range as sometimes mark
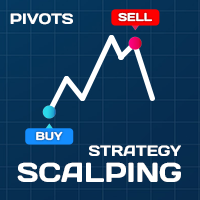
Scalping Strategy BUY SELL
Having a strategy in the market is one of the main conditions for trading. The presence of various and complicated indicators and tools sometimes makes trading difficult, and the user gets confused after trying various methods and gets stuck in a loss cycle, the result of which is usually clear. This indicator is a simple strategy based on the detection of pivots and short-term trends, which helps you to easily trade in trends. Sometimes a simple but efficient st

MACD Indicator The Moving Average Convergence and Divergence (MACD) is a trend following momentum indicator which shows the relationship between two moving averages that we chose and configure them on the indicator. The MACD is calculated by subtracting the 26-period exponential moving average and the 12 period D.A.M. These are the default parameters when you put the MACD indicator on the charts, and the period is usually 9 which means the last 9 candles. DT-Oscillator This is Robert C. Miner's
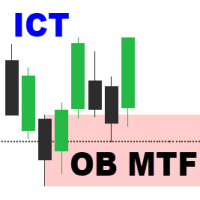
Order Block Multi Timeframe The Order Block Multi Timeframe is a powerful tool for Smart Money Concept (SMC) traders, combining high-accuracy Order Block detection with real-time Break of Structure (BOS) and Change of Character (CHoCH) analysis across multiple timeframes. Smart Money Insight, Multi-Timeframe Precision This indicator automatically identifies institutional Order Blocks —key price zones where large players have entered the market—and plots them directly on your ch

CHoCH & EQH/EQL: Market Structure and Liquidity Zones Indicator Overview: This versatile indicator is designed to help traders identify potential shifts in market structure and pinpoint key liquidity zones directly on their MetaTrader 5 charts. It automatically detects and visualizes two crucial price action concepts: Change of Character (CHoCH) for potential reversals, and Equal Highs/Lows (EQH/EQL) for significant support/resistance levels. Key Features: Change of Character (CHoCH) Detection:

H4 scalper
The H4 scalper indicator is built specifically for the H4 timeframe and works on all currency pairs.
The H4 scalper indicator is very good for scalping.
BUY and SELL signals are given by the white and yellow circles, respectively.
Take Profit can start from a minimum of 5, 10 pips.
For this indicator to work, you need to download two indicators, Trend envelopes v2 and DSS of momentum + arrows + alerts _ mtf nmc, which you can find in the first comment.
These two indicators are

Hello fellow trader, I have built this indicator by combining trend and entry mechanisms i have used for years. This is one of my high probability strategies. All calculations are done based on pure price action-based market structure. Multiple confluences are used to validate and filter entries. All calculations are done behind the scenes, and you are given only buy sell signals. Accuracy becomes higher and higher as you trade higher timeframes, also based on my experience with the technique,

The Neural Adaptive MACD is a customized MACD indicator for MT4 that visually represents momentum strength using four color-coded histogram bars: strong bullish, bullish, strong bearish, and bearish.
It features neural adaptive signal smoothing and integrates optional real-time alerts, notifying traders of new momentum shifts along with the symbol and timeframe.
This tool enhances decision-making by highlighting trend strength and change dynamics.
Can be used any forex, crypto....
Any timefr

Simple. Informative. Instantly Visible on Your Chart. Alwinson Active Trades Info (MT4 Version) is a lightweight custom indicator that displays a real-time summary of your currently open trades —right on your chart. No more switching tabs just to see what pairs are active and how much lot size is in play.
Alwinson Active Trades Info is also available for the MetaTrader 5 (MT5) version .
Key Features: Displays a list of all symbols with open positions in your trading account. Shows th

Arrow Indicator (Buy/Sell Alerts) – Simple Yet Powerful Tool! Product Version: 1.01 Indicator Type: Trend Reversal Signals Timeframes Supported: All (Recommended: H1, H4, D1) Key Features: Buy Signal : Green upward arrow () appears below the candle Sell Signal : Red downward arrow () appears above the candle Accurate Trend Reversal Detection – Based on tried and tested SMA strategy. ️ Clean Chart View – Minimalist, non-intrusive arrow signals for easy trading. Work
FREE

Z Score Pair Trade Indicator for MT4 is a powerful statistical tool designed to help traders identify mean-reversion opportunities and overbought/oversold market conditions with precision. Based on standard deviation and mean analysis, this indicator calculates the Z-score of a selected spread, price series, or custom input to determine how far the current value deviates from its historical average.
Unlock powerful market insights with the Z Score Pair Trade Indicator — a must-have tool for tr

CDS SR Fractal Level: Enhance Your Trading Accuracy with Automatic Fractal-Based Support and Resistance Levels The CDS SR Fractal Level indicator is an advanced trading tool designed by CDS to automatically identify and visualize key Support and Resistance (SR) levels. This indicator utilizes the concept of fractals to present relevant SR levels for your trading decisions. Key Features: Automatic Fractal Level Identification: The indicator dynamically marks fractal levels as they form on the pri

The Great Oracle – Your Guide to Consistent Trend Trading Success
The Great Oracle is a powerful trend-following indicator designed for traders who seek precision in their entries and exits. Whether you’re navigating trending markets or spotting opportunities in ranging conditions, The Great Oracle provides you with accurate signals and a second chance to join strong market trends. It’s the ultimate tool for traders who want to maximize profits while keeping risks manageable.
Key Features:
•
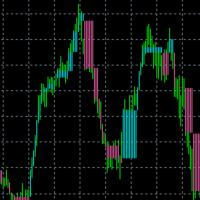
When there is no position, when changing the color, you can consider opening an order. With the fluctuation of the market, when the current color changes again, you need to close the position and leave. Suitable for different cycles, the trading rules are simple and require friends to explore on their own.
I hope friends who use this indicator can make a lot of money, rolling bigger and bigger like a snowball. thank you!
The presented indicator is an original development. The indicator gives signals to open/close a position. The indicator sensitivity can be adjusted in a literally infinite range, which allows it to be used for trading in any market. The indicator signals vary in strength depending on their consistency with the trend over three different time periods. The above indicator feature allows you to estimate the indicator signal potential in advance. Namely: If the signal is strong (coincides with the
The presented product is the author's implementation of the REI (Range Expansion Index) indicator developed by Thomas DeMark. REI Oscillator AM is an indicator that measures the rate of price change and signals overbought/oversold conditions if the price shows weakness or strength. The indicator value changes within the range from -100 to +100. Thomas DeMark suggests using the default period of 8 and the following algorithm for using the indicator: When the price rises above level 60 and then fa
FREE
One of the standard ways to determine the direction of price movement at a specific point in time is to calculate the linear regression for the values of such a price for a certain period of time. This indicator displays points on the price chart, built on the basis of the linear regression values of the selected price for the selected period of time.
The indicator also displays signals at moments of change in the direction of the calculated values of linear regression. The indicator is
FREE
The presented indicator is an original development. The indicator places two types of signals on the price chart: Signals to open a position; Signals to close a position. The indicator signals appear after the bar formation is complete and are not redrawn. The signals require confirmation, namely - the price must overcome the maximum (for buying) or minimum (for selling) of the bar on which the signal was placed. The indicator can send notifications about its signals to a mobile terminal and e-
FREE
The presented indicator is the author's implementation in the oscillator format of the classic Aroon indicator. The Aroon indicator was developed in 1995 by the Indian trader Tushar Chande. Chand's origin played a role in choosing an unusual name for the oscillator. "Aroon" is translated from Sanskrit as "Light of the morning dawn". The formula for calculating the classic Aroon indicator: Aroon-Up = ((specified number of periods) – (number of periods since the maximum was formed)) / (specified n
FREE
The presented indicator is the author's implementation of the classic Aroon indicator. The Aroon indicator was developed in 1995 by the Indian trader Tushar Chand. Chand's origin played a role in choosing an unusual name for the indicator. "Aroon" is translated from Sanskrit as "Light of the morning dawn". The formula for calculating the classic Aroon indicator: Aroon-Up = ((specified number of periods) - (number of periods since the formation of the maximum)) / (specified number of periods) * 1
FREE

The presented indicator allows you to visualize the current trend. The indicator identifies the trend using the following definition as an algorithm: A trend is a situation when each subsequent maximum price rise is higher/lower than the previous one, and similarly each subsequent maximum price fall is higher/lower than the previous one; The beginning of a new trend is considered to be when the current maximum/minimum overcomes all maximums/minimums of a specified number of previous bars. The i
FREE
The presented indicator is the author's implementation of the DMI indicator. DMI (Directional movement Index) is a directional movement index. The concept of the indicator was developed by Welles Wilder. This is a technical indicator, it is used to identify the trend direction, moments of the market exiting consolidation and to confirm potential reversal points. It is an oscillator consisting of two curves. The constituent components of the Directional Movement Index: +DI (Positive Directional
FREE

NOTE: CYCLEMAESTRO is distributed only on this website, there are no other distributors. Demo version is for reference only and is not supported. Full versione is perfectly functional and it is supported CYCLEMAESTRO , the first and only indicator of Cyclic Analysis, useful for giving signals of TRADING, BUY, SELL, STOP LOSS, ADDING. Created on the logic of Serghei Istrati and programmed by Stefano Frisetti ; CYCLEMAESTRO is not an indicator like the others, the challenge was to interpret only t
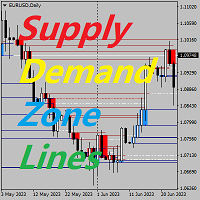
공급 및 수요 구역 주요 가격 지표 배경 시스템은 K-라인에서 자동으로 공급 및 수요 영역을 검색하고 실시간 주요 가격선을 그립니다. 거래자는 가격 거래선을 기준으로 거래할 수 있습니다. 주요 특징 시스템은 K-라인의 공급 및 수요 지역을 자동으로 검색합니다. 이 시스템은 또한 실시간 주요 가격선을 도출하고, 거래자는 가격 거래선을 기준으로 거래할 수 있습니다. 따라서 공급과 수요 구역 전략을 사용하는 거래자는 더 이상 공급과 수요 구역의 징후를 찾는 데 시간을 허비할 필요가 없습니다. 대신, 그들은 공급과 수요 영역 및 주요 가격에 대한 가격 반응에 집중하고 이에 맞는 거래 전략을 개발할 수 있습니다. 하지만 공급과 수요 구역 전략 자체는 변동성이 큰 기간 동안 더욱 효과적인 전략이므로 시장이 강한 추세를 보일 때는 주의해서 사용하거나 지표가 제시하는 제안을 추세 방향으로 사용해야 합니다.
범위 ShowZones: 공급 및 수요 구역을 표시할지 여부 DrawLines: 주요 가
멀티 타임프레임 캔들 지표는 트레이더가 하위 타임프레임 분석을 상위 타임프레임 구조에 맞춰 조정할 수 있도록 설계된 강력한 시각화 도구입니다. 선택한 상위 타임프레임(H1, H4, D1 등)의 캔들을 현재 차트에 직접 표시하여 차트를 전환하지 않고도 전반적인 시장 흐름을 더욱 명확하게 파악할 수 있도록 도와줍니다.
이 지표는 누구에게 필요한가요? 이 도구는 다음과 같은 경우에 적합합니다. 스마트 머니 컨셉트(SMC) / ICT 트레이더는 낮은 시간대에서 거래를 실행하면서 높은 시간대 편향에 의존합니다. 일일 또는 세션별 모멘텀과 동기화를 유지하고자 하는 스캘퍼와 당일 거래자. 작은 차트에서 진입 항목을 구체화하는 동안 HTF 구조를 빠르게 살펴보고 싶어하는 스윙 트레이더.
가격 움직임, 수요와 공급 또는 추세 추종 시스템을 이용해 거래하든, 이 지표는 상위 시간대의 강점에 의해 진입이 뒷받침되도록 보장합니다.
전략 개선 다중 시간대 캔들은 다음을 개선하는 데 도움이 됩니다
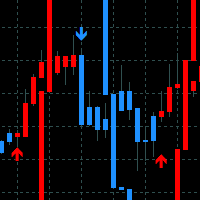
Reversal Bands -변동성 분석과 거래에서의 결과 적용을 위해 설계된 지표입니다. 추세에 따른 가격 방향과 반전 초기 단계에 대한 신호를 제공합니다.
표시기 기능
이 지표는 평활화 정도를 사용하여 변동성의 가속 및 감속 원칙에 따라 구성된 속도선을 기반으로 합니다. 이 선의 원동력은 변동성입니다. 변동성이 클수록 선은 가격에서 더 많이 벗어납니다. 빨간색 화살표, 캔들, 속도선은 상승 변동성을 나타내며, 이는 강세 방향과 일치합니다. 파란색 화살표, 캔들, 속도선은 하락 변동성을 나타내며, 이는 하락 방향을 뒷받침합니다. 추세 방향이 장기간 상승하고 속도선이 가격 위에 있는 경우, 반전 신호는 강세 추세가 지속되기 전에 수정을 보여주는 경우가 가장 많습니다. 또한 추세 방향이 장기 하락 추세이고 속도선이 가격 아래에 있는 경우, 반전 신호는 하락 추세가 지속되기 전에 수정을 보여주는 경우가 가장 많습니다. 편의상 속도선의 선과 화살표가 그래프 자체에 복제되었습니다. 변동
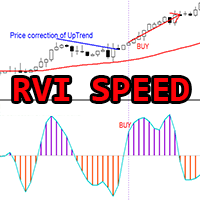
MT4용 Crypto_Forex 지표 "RVI 속도", 리페인트 없음.
- 이 지표는 물리학 방정식을 기반으로 계산됩니다. RVI 속도는 RVI 자체의 1차 미분값입니다. - Relative_Vigor_Index(RVI) 자체는 추세 시장에서 매우 유용한 기술적 모멘텀 지표입니다. - RVI 속도는 가격 조정 후 주요 추세 방향으로 모멘텀 진입에 유용합니다. - 표준 EMA(그림 참조)와 같은 적절한 추세 지표와 함께 사용하십시오. - RVI 속도 지표는 RVI 자체의 방향 전환 속도를 보여주며 매우 민감합니다. - RVI 속도 지표 값이 0보다 작으면 속도는 음수이고, 0보다 크면 속도는 양수입니다. - 이 지표에는 모바일 및 PC 알림 기능이 내장되어 있습니다.
// 훌륭한 트레이딩 로봇과 지표는 여기에서 확인하실 수 있습니다: https://www.mql5.com/en/users/def1380/seller 본 제품은 MQL5 웹사이트에서만 제공되는 정품입니다.
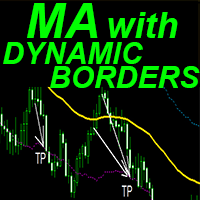
MT4용 Crypto_Forex 지표 "동적 경계를 갖춘 이동 평균"
- 이 지표는 이동 평균과 관련된 고유한 기능인 동적 변동성 경계를 제공합니다. - 동적 변동성 경계는 평균 참값(ATR)을 사용하여 계산합니다. - 이 지표는 이익실현(TakeProfit) 목표가 설정 및 경계선에서의 손절매(SL) 설정에 매우 유용합니다. - 가격 움직임 신호와도 결합하기 좋습니다. .................................................................................................................................................. // 훌륭한 트레이딩 로봇과 지표는 다음 링크에서 확인할 수 있습니다: https://www.mql5.com/en/users/def1380/seller MQL5 웹사이트에서만 제공되는 오리지널 제품입니다.
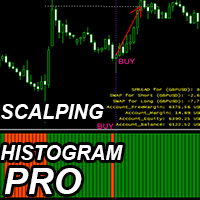
MT4용 Crypto_Forex 지표 "스캘핑 히스토그램 프로", 리페인트 없음.
- 스캘핑 히스토그램 프로 지표는 소폭 조정 후 가격 모멘텀의 주요 방향으로 진입 신호를 찾는 데 사용할 수 있습니다. - 스캘핑 히스토그램 프로는 두 가지 색상으로 제공됩니다. 주황색은 하락 모멘텀, 녹색은 상승 모멘텀입니다. - 동일한 색상의 히스토그램 막대가 10개 이상 연속으로 나타나면 강력한 모멘텀이 발생했음을 의미합니다. - 진입 신호는 히스토그램에서 반대 색상의 열과 초기 모멘텀 색상의 다음 열로 구성됩니다(그림 참조). - 스캘핑 목표가를 사용합니다. 차트에서 가장 가까운 고가/저가를 사용합니다. - 모바일 및 PC 알림 기능이 내장되어 있습니다. - 스프레드 스왑 정보 표시 기능이 있습니다. 해당 지표가 연결된 외환 통화쌍의 현재 스프레드와 스왑을 표시합니다. - 계좌 잔액, 자본금, 증거금도 표시됩니다. - 차트의 어느 모서리에나 Info Spread Swap Display를 배치
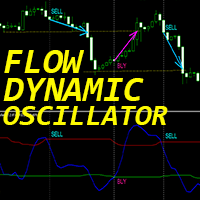
"다이내믹 플로우 오실레이터"는 MT4를 위한 고급 맞춤형 암호화폐/외환 지표이자 효율적인 트레이딩 도구입니다!
- 차세대 오실레이터 - 사용 방법은 그림을 참조하세요. - 다이내믹 플로우 오실레이터는 적응형 과매도/과매수 영역을 제공합니다. - 지표는 가격 및 거래량 데이터를 사용하여 과매도 및 과매수 영역을 식별합니다. - 오실레이터는 과매도/과매수 영역에서 정확한 진입 시점을 찾는 보조 도구입니다. - 과매도 값: 녹색선 아래, 과매도 값: 빨간색선 위. - 일반 오실레이터보다 훨씬 정확합니다. 적합한 시간대: M30, H1, H4, D1, W1. - PC 및 모바일 알림 기능 제공.
// 훌륭한 트레이딩 로봇과 지표는 다음 링크에서 확인하실 수 있습니다: https://www.mql5.com/en/users/def1380/seller MQL5 웹사이트에서만 제공되는 오리지널 제품입니다.
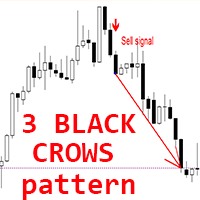
MT4용 Crypto_Forex 지표 "3 Black Crows 패턴"
- "3 Black Crows 패턴" 지표는 가격 변동 거래에 매우 효과적입니다. 재도색이나 지연 없이 작동합니다. - 이 지표는 차트에서 하락세 "3 Black Crows" 패턴을 감지합니다. 차트에 빨간색 화살표 신호가 나타납니다(그림 참조). - PC, 모바일 및 이메일 알림 기능을 제공합니다. - 형제 지표인 상승세 "3 White Soldiers 패턴" 지표도 이용할 수 있습니다(아래 링크 참조). - "3 Black Crows 패턴" 지표는 지지/저항선과 함께 사용하기에 매우 좋습니다.
// 훌륭한 트레이딩 로봇과 지표는 다음 링크에서 확인하실 수 있습니다: https://www.mql5.com/en/users/def1380/seller 본 제품은 MQL5 웹사이트에서만 제공되는 정품 제품입니다.
123456789101112131415161718192021222324252627282930313233343536373839404142434445464748495051525354555657585960616263646566676869707172737475767778798081828384858687888990919293949596979899100101102103104105106107108109110111112113114115116117118119120121122123124125126127128129130131132133134135136137138139140141142143144145146147148149
MetaTrader 플랫폼 어플리케이션 스토어에서 MetaTrader 마켓에서 트레이딩 로봇을 구매하는 방법에 대해 알아 보십시오.
MQL5.community 결제 시스템은 페이팔, 은행 카드 및 인기 결제 시스템을 통한 거래를 지원합니다. 더 나은 고객 경험을 위해 구입하시기 전에 거래 로봇을 테스트하시는 것을 권장합니다.
트레이딩 기회를 놓치고 있어요:
- 무료 트레이딩 앱
- 복사용 8,000 이상의 시그널
- 금융 시장 개척을 위한 경제 뉴스
등록
로그인
계정이 없으시면, 가입하십시오
MQL5.com 웹사이트에 로그인을 하기 위해 쿠키를 허용하십시오.
브라우저에서 필요한 설정을 활성화하시지 않으면, 로그인할 수 없습니다.