MetaTrader 4용 새 기술 지표 - 23

I. TrendPadPRO - Unveiling the Context of Informed Trend Trading The Context of Trend Trading is far more relevant and important than indicators, timeframes, personal perspectives or beliefs. TrendPadPRO 's unique features, including trend inertia (age) analysis, trend direction identification, and precise S/R levels, bring the knowledge of the Context of Trend Trading needed to make decisions in real time.
II. Usability of TrendPadPRO TrendPadPRO is a trading tool designed to cate
Using Standard Deviation but not sure if the Standard Deviation is high or low?
eRSD or Easy Relative Standard Deviation comes to your help. Using this you can get a ratio of Standard Deviation to Moving Average and make a good judgement about whether the Standard Deviation is useful or not.
Just add it to the chart and use it away - it supports all periods and moving average calculation methods through the input parameters.

세계적인 바이너리 옵션 거래에서는 정확한 시장 분석과 전략적인 의사 결정이 핵심입니다. 수익성 있는 기회를 찾아내는 뛰어난 거래 지표를 찾는 여정은 끝이 없습니다. 비밀 지표(Secret Indicator)가 등장합니다 - 최고이며 강력한 MT4 바이너리 옵션 거래 도구로서의 명성을 얻은 주목할 만한 도구입니다.
비밀 지표는 경험있는 트레이더와 전문 프로그래머들로 구성된 팀에 의해 수년간의 세심한 연구, 개발 및 테스트를 통해 만들어졌습니다. 독특한 알고리즘과 고급 수학적 모델은 바이너리 옵션의 빠른 속도로 변동하는 세계에서 트레이더에게 무적의 이점을 제공하기 위해 정교하게 조정되었습니다.
비밀 지표를 다른 거래 지표와 구분 짓는 특징은 놀라운 정확도로 수익성 있는 거래 기회를 발견하는 능력입니다. 이 신호는 강력한 기술적 지표, 가격 행동 분석 및 시장 감성 평가의 조합에서 유도됩니다. 이 다각적 접근법은 비밀 지표가 단기 변동과 장기 추세 모두를 포착하여 트레이더에게 시

승률 계산 시스템 탑재 인디케이터 [인디케이터 기능] 정기적인 기술적 분석을 사인 시그널로 직관적이고 쉽게 확인할 수 있는 지표입니다. 또한 현재 매개 변수의 승률을 확인할 수 있으며 승률이 낮을 때 신호를 주지 않는 자동 승률 결정 시스템이 포함되어 있습니다. 이를 통해 불필요한 입력을 줄이고 승률이 높을 때만 거래를 입력할 수 있습니다.
[중요 사항] ・재도장이 없습니다. 1분부터 매주까지 다양한 시간대에 사용할 수 있습니다. ・통화 제한은 없습니다. 모든 통화 쌍과 함께 사용할 수 있습니다. ・승률을 계산할 수 있습니다. ・사전 정의된 승률을 충족하거나 초과할 때만 신호가 생성됩니다. ・경하중 실현! 9개의 통화쌍으로 장기간 사용 및 동시 사용에 적합합니다. ・잘 알려진 지표이므로 신호를 관찰하면서 공부할 수 있습니다. ・디버깅이 완료되었습니다(모든 문제에 대해 디버거에서 확인).
[MACD 화살표 신호 설명] MACD(이동 평균 수렴 발산) 화살표 신호 표시기는

승률 계산 시스템 탑재 인디케이터 [인디케이터 기능] 정기적인 기술적 분석을 사인 시그널을 통해 직관적이고 쉽게 확인할 수 있는 지표입니다. 또한 승률을 검증하여 현재 파라미터의 적합성을 확인할 수 있으며 승률이 낮을 때 신호를 생성하지 않는 자동 승률 결정 시스템이 포함되어 있습니다. 이는 불필요한 입력을 줄이고 승률이 높은 기간에만 거래를 가능하게 합니다.
[중요 사항] ・다시 칠하지 않습니다. 1분부터 매주까지 다양한 시간대에 사용할 수 있습니다. ・통화 제한은 없습니다. 모든 통화 쌍과 함께 사용할 수 있습니다. ・승률을 계산할 수 있습니다. ・사전 정의된 승률을 충족하거나 초과할 때만 신호가 생성됩니다. ・경감 설계! 9개의 통화쌍으로 장기간 사용 및 동시 사용에 적합합니다. ・잘 알려진 지표이므로 신호를 관찰하면서 공부할 수 있습니다. ・디버깅이 완료되었습니다(모든 문제에 대해 디버거에서 확인).
[OSMA 화살표 신호 설명] OSMA(Moving Averag

승률 계산 시스템 탑재 인디케이터 [인디케이터 기능] 정기적인 기술적 분석을 사인 시그널을 통해 직관적이고 쉽게 확인할 수 있는 지표입니다. 또한 승률을 검증하여 현재 파라미터의 적합성을 확인할 수 있으며 승률이 낮을 때 신호를 생성하지 않는 자동 승률 결정 시스템이 포함되어 있습니다. 이는 불필요한 입력을 줄이고 승률이 높은 기간에만 거래를 가능하게 합니다.
[중요 사항] ・다시 칠하지 않습니다. 1분부터 매주까지 다양한 시간대에 사용할 수 있습니다. ・통화 제한은 없습니다. 모든 통화 쌍과 함께 사용할 수 있습니다. ・승률을 계산할 수 있습니다. ・사전 정의된 승률을 충족하거나 초과할 때만 신호가 생성됩니다. ・경감 설계! 9개의 통화쌍으로 장기간 사용 및 동시 사용에 적합합니다. ・잘 알려진 지표이므로 신호를 관찰하면서 공부할 수 있습니다. ・디버깅이 완료되었습니다(모든 문제에 대해 디버거에서 확인).
[볼린저 밴드 화살표 신호에 대한 설명] Bollinger Ba

승률 계산 시스템 탑재 인디케이터 [인디케이터 기능] 정기적인 기술적 분석을 사인 시그널을 통해 직관적이고 쉽게 확인할 수 있는 지표입니다. 또한 승률을 검증하여 현재 파라미터의 적합성을 확인할 수 있으며 승률이 낮을 때 신호를 생성하지 않는 자동 승률 결정 시스템이 포함되어 있습니다. 이는 불필요한 입력을 줄이고 승률이 높은 기간에만 거래를 가능하게 합니다.
[중요 사항] ・다시 칠하지 않습니다. 1분부터 매주까지 다양한 시간대에 사용할 수 있습니다. ・통화 제한은 없습니다. 모든 통화 쌍과 함께 사용할 수 있습니다. ・승률을 계산할 수 있습니다. ・사전 정의된 승률을 충족하거나 초과할 때만 신호가 생성됩니다. ・경감 설계! 9개의 통화쌍으로 장기간 사용 및 동시 사용에 적합합니다. ・잘 알려진 지표이므로 신호를 관찰하면서 공부할 수 있습니다. ・디버깅이 완료되었습니다(모든 문제에 대해 디버거에서 확인).
[일목 화살표 신호 설명] Ichimoku 화살표 신호 표시기는

승률 계산 시스템 탑재 인디케이터 [인디케이터 기능] 정기적인 기술적 분석을 사인 시그널을 통해 직관적이고 쉽게 확인할 수 있는 지표입니다. 또한 승률을 검증하여 현재 파라미터의 적합성을 확인할 수 있으며 승률이 낮을 때 신호를 생성하지 않는 자동 승률 결정 시스템이 포함되어 있습니다. 이는 불필요한 입력을 줄이고 승률이 높은 기간에만 거래를 가능하게 합니다.
[중요 사항] ・다시 칠하지 않습니다. 1분부터 매주까지 다양한 시간대에 사용할 수 있습니다. ・통화 제한은 없습니다. 모든 통화 쌍과 함께 사용할 수 있습니다. ・승률을 계산할 수 있습니다. ・사전 정의된 승률을 충족하거나 초과할 때만 신호가 생성됩니다. ・경감 설계! 9개의 통화쌍으로 장기간 사용 및 동시 사용에 적합합니다. ・잘 알려진 지표이므로 신호를 관찰하면서 공부할 수 있습니다. ・디버깅이 완료되었습니다(모든 문제에 대해 디버거에서 확인).
[포물선 표시기 설명] Parabolic Indicator는 추

승률 계산 시스템 탑재 인디케이터 [인디케이터 기능] 정기적인 기술적 분석을 사인 시그널을 통해 직관적이고 쉽게 확인할 수 있는 지표입니다. 또한 승률을 검증하여 현재 파라미터의 적합성을 확인할 수 있으며 승률이 낮을 때 신호를 생성하지 않는 자동 승률 결정 시스템이 포함되어 있습니다. 이는 불필요한 입력을 줄이고 승률이 높은 기간에만 거래를 가능하게 합니다.
[중요 사항] ・다시 칠하지 않습니다. 1분부터 매주까지 다양한 시간대에 사용할 수 있습니다. ・통화 제한은 없습니다. 모든 통화 쌍과 함께 사용할 수 있습니다. ・승률을 계산할 수 있습니다. ・사전 정의된 승률을 충족하거나 초과할 때만 신호가 생성됩니다. ・경감 설계! 9개의 통화쌍으로 장기간 사용 및 동시 사용에 적합합니다. ・잘 알려진 지표이므로 신호를 관찰하면서 공부할 수 있습니다. ・디버깅이 완료되었습니다(모든 문제에 대해 디버거에서 확인).
[스토캐스틱의 설명] 스토캐스틱은 시장 추세 반전 지점을 나타내

승률 계산 시스템 탑재 인디케이터 [인디케이터 기능] 정기적인 기술적 분석을 사인 시그널을 통해 직관적이고 쉽게 확인할 수 있는 지표입니다. 또한 승률을 검증하여 현재 파라미터의 적합성을 확인할 수 있으며 승률이 낮을 때 신호를 생성하지 않는 자동 승률 결정 시스템이 포함되어 있습니다. 이는 불필요한 입력을 줄이고 승률이 높은 기간에만 거래를 가능하게 합니다.
[중요 사항] ・다시 칠하지 않습니다. 1분부터 매주까지 다양한 시간대에 사용할 수 있습니다. ・통화 제한은 없습니다. 모든 통화 쌍과 함께 사용할 수 있습니다. ・승률을 계산할 수 있습니다. ・사전 정의된 승률을 충족하거나 초과할 때만 신호가 생성됩니다. ・경감 설계! 9개의 통화쌍으로 장기간 사용 및 동시 사용에 적합합니다. ・잘 알려진 지표이므로 신호를 관찰하면서 공부할 수 있습니다. ・디버깅이 완료되었습니다(모든 문제에 대해 디버거에서 확인).
[RSI(Relative Strength Index) 화살표 신

승률 계산 시스템이 적용된 지표 [인디케이터 기능] 이 지표는 기호 신호를 통해 정기적인 기술 분석을 직관적이고 명확하게 확인할 수 있습니다. 또한 승률을 확인하여 현재 파라미터의 적합성을 확인할 수 있으며 승률이 낮을 때 신호를 생성하지 않는 자동 승률 결정 시스템이 포함되어 있습니다. 이는 불필요한 응모를 줄이고 승률이 높은 기간에만 응모할 수 있도록 합니다.
[중요 설명] ・다시 칠하지 않습니다. 1분에서 매주까지의 시간대에 사용할 수 있습니다. ・통화 제한이 없습니다. 모든 통화 쌍에 사용할 수 있습니다. ・승률을 계산할 수 있습니다. ・미리 정의된 승률 이상이 충족될 때만 신호가 생성됩니다. ・부하 경감 대책으로 설계! 9개의 통화쌍으로 장기간 사용 및 동시 사용에 적합합니다. ・잘 알려진 지표로 신호를 관찰하면서 공부할 수 있습니다. ・모든 문제를 해결하기 위해 디버거에 의해 디버깅 및 검증되었습니다.
[CCI(Commodity Channel Index) Ar

승률 계산 시스템이 적용된 지표 [인디케이터 기능] 이 지표는 트레이더가 기호 신호를 통해 정기적인 기술 분석을 직관적이고 명확하게 확인할 수 있도록 합니다. 또한 승률을 확인하여 현재 파라미터가 적절한지 확인할 수 있으며 승률이 낮을 때 신호를 생성하지 않는 자동 승률 결정 시스템이 포함되어 있습니다. 이는 불필요한 응모를 줄이고 승률이 높은 기간에만 응모할 수 있도록 합니다.
[중요 설명] ・다시 칠하지 않습니다. 1분에서 매주까지의 시간대에 사용할 수 있습니다. ・통화 제한이 없습니다. 모든 통화 쌍에 사용할 수 있습니다. ・승률을 계산할 수 있습니다. ・미리 정의된 승률 이상이 충족될 때만 신호가 생성됩니다. ・부하 경감 대책으로 설계! 9개의 통화쌍으로 장기간 사용 및 동시 사용에 적합합니다. ・잘 알려진 지표로 신호를 관찰하면서 공부할 수 있습니다. ・모든 문제를 해결하기 위해 디버거에 의해 디버깅 및 검증되었습니다.
[하이킨 아시 애로우 시그널 설명] Hei

승률 계산 시스템이 적용된 지표 [인디케이터 기능] 이 지표는 트레이더가 기호 신호를 통해 정기적인 기술 분석을 직관적이고 명확하게 확인할 수 있도록 합니다. 또한 승률을 확인하여 현재 파라미터가 적절한지 확인할 수 있으며 승률이 낮을 때 신호를 생성하지 않는 자동 승률 결정 시스템이 포함되어 있습니다. 이는 불필요한 응모를 줄이고 승률이 높은 기간에만 응모할 수 있도록 합니다.
[중요 설명] ・다시 칠하지 않습니다. 1분에서 매주까지의 시간대에 사용할 수 있습니다. ・통화 제한이 없습니다. 모든 통화 쌍에 사용할 수 있습니다. ・승률을 계산할 수 있습니다. ・미리 정의된 승률 이상이 충족될 때만 신호가 생성됩니다. ・부하 경감 대책으로 설계! 9개의 통화쌍으로 장기간 사용 및 동시 사용에 적합합니다. ・잘 알려진 지표로 신호를 관찰하면서 공부할 수 있습니다. ・모든 문제를 해결하기 위해 디버거에 의해 디버깅 및 검증되었습니다.
[굉장한 오실레이터 화살표 신호 설명] A

승률 계산 시스템이 적용된 지표 [인디케이터 기능] 이 지표는 트레이더가 기호 신호를 통해 정기적인 기술 분석을 직관적이고 명확하게 확인할 수 있도록 합니다. 또한 승률을 확인하여 현재 파라미터가 적절한지 확인할 수 있으며 승률이 낮을 때 신호를 생성하지 않는 자동 승률 결정 시스템이 포함되어 있습니다. 이는 불필요한 응모를 줄이고 승률이 높은 기간에만 응모할 수 있도록 합니다.
[중요 설명] ・다시 칠하지 않습니다. 1분에서 매주까지의 시간대에 사용할 수 있습니다. ・통화 제한이 없습니다. 모든 통화 쌍에 사용할 수 있습니다. ・승률을 계산할 수 있습니다. ・미리 정의된 승률 이상이 충족될 때만 신호가 생성됩니다. ・부하 경감 대책으로 설계! 9개의 통화쌍으로 장기간 사용 및 동시 사용에 적합합니다. ・잘 알려진 지표로 신호를 관찰하면서 공부할 수 있습니다. ・모든 문제를 해결하기 위해 디버거에 의해 디버깅 및 검증되었습니다.
[Accelerator Oscillator

승률 계산 시스템이 탑재된 지표 【지시등 기능】 정상적인 기술적 분석을 시그널 사인을 통해 직관적이고 명확하게 확인할 수 있는 지표입니다. 또한 현재 매개변수가 적합한지 확인하고 승률이 낮을 때 신호를 보내는 것을 방지하는 자동 승률 결정 시스템이 있습니다. 이를 통해 불필요한 입력을 줄이고 승률이 높을 때만 거래를 입력할 수 있습니다.
【중요 설명】 ・다시 칠하지 않습니다. 1분부터 주간 차트까지 사용 가능합니다. ・통화 제한이 없습니다. 모든 통화 쌍에 사용할 수 있습니다. ・승률 계산 기능. ・정해진 승률 이상에 도달했을 때만 신호가 발생합니다. ・부하 감소에 최적화! 9개의 통화쌍으로 장기 운용 및 동시 사용에 적합합니다. ・잘 알려진 지표이기 때문에 신호를 따라가면서 공부할 수 있습니다. ・문제를 해결하기 위해 디버거에서 디버깅을 지원하고 검증했습니다.
【가격대 표시 설명】 PRICE RANGE는 가격 범위, 즉 가격의 상한과 하한을 나타내는 지표입니다. Eve

기술적 분석 12종 포함! 승률 계산 시스템을 갖춘 지표 【지시등 기능】 정상적인 기술적 분석 12가지를 시그널 사인을 통해 직관적이고 명확하게 확인할 수 있는 지표입니다. 또한 현재 매개변수가 적합한지 확인하고 승률이 낮을 때 신호를 보내는 것을 방지하는 자동 승률 결정 시스템이 있습니다. 이를 통해 불필요한 입력을 줄이고 승률이 높을 때만 거래를 입력할 수 있습니다.
【중요 설명】 ・다시 칠하지 않습니다. 1분부터 주간 차트까지 사용 가능합니다. ・통화 제한이 없습니다. 모든 통화 쌍에 사용할 수 있습니다. ・승률 계산 기능. ・정해진 승률 이상에 도달했을 때만 신호가 발생합니다. ・부하 감소에 최적화! 9개의 통화쌍으로 장기 운용 및 동시 사용에 적합합니다. ・잘 알려진 지표이기 때문에 신호를 따라가면서 공부할 수 있습니다. ・문제를 해결하기 위해 디버거에서 디버깅을 지원하고 검증했습니다.
【ECHIDNA 화살표 기호 설명】 ECHIDNA Arrow Sign Ind

M5 gold scalping indicator is an arrow indicator that shows reversal points on the chart. It does not repaint! Designed for scalping on gold (XAUUSD), but can also work on other currency pairs. On average, about 87% of signals indicate the precise direction of price movement, and approximately 9% of signals show the correct direction of price but at the end of its impulse. As an additional filter to get even more accurate signals, it is recommended to use any trending indicator (moving average,
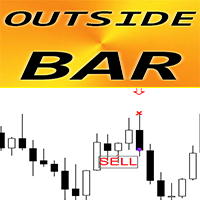
MT4용 외환 표시기 외부 바 패턴
표시기 "OUTSIDE Bar"는 가격 조치 거래에 대한 매우 강력한 표시기입니다. 다시 칠하지 않고 지연도 없습니다. 표시기는 차트에서 외부 막대 패턴을 감지합니다. Bullish OUTSIDE Bar - 차트의 파란색 화살표 신호(그림 참조) Bearish OUTSIDE Bar - 차트의 빨간색 화살표 신호(그림 참조) PC, 모바일 및 이메일 알림이 포함되어 있습니다. 표시기 "OUTSIDE Bar Pattern"은 지원/저항 수준과 결합하는 데 탁월합니다: https://www.mql5.com/en/market/product/100903
// 더 훌륭한 전문가 자문 및 지표는 여기에서 확인할 수 있습니다: https://www.mql5.com/en/users/def1380/seller // 또한 수익성 있고 안정적이며 신뢰할 수 있는 신호 https://www.mql5.com/en/signals/1887493에 참여하실 수 있습니다

US30 Revolt a Technical indicator that is 100% non-repaint and appears on the current candlestick works on all timeframes (recommended M15,M30,H1) The indicator is made for US30 but it can be used on other pairs as well When a blue arrow appears look for buying opportunities When a orange arrow appears look for selling opportunities Please watch the YouTube video on how to properly set up and use the indicator
FREE
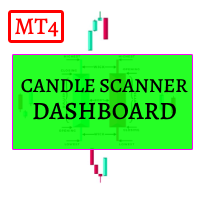
Candle Scanner Dashboard is an incredibly powerful tool in the financial markets. It excels at detecting market reversals, trend changes, and retracements. The dashboard displays patterns as they are identified, and with a simple click on each pattern, you can view them on their dedicated charts to precisely locate their occurrences. With its capability to detect 11 popular bullish and 11 bearish patterns, you can trust the dashboard to handle pattern identification effortlessly. It provides an

The indicator is based on identifying engulfing candlestick patterns within the current timeframe. When such patterns are found, it generates buy and sell signals represented by up and down arrows, respectively. However, the user is responsible for determining the prevailing trend. Once the trend is identified, they should trade in line with the corresponding signal that aligns with the trend direction.
FREE

This indicator identifies pinbar candlesticks on the chart and displays an arrow as a trade signal based on the candlestick pattern. It offers user-friendly features, including push notifications and other types of alerts. It is most effective for identifying entry points or potential reversals at premium or discount prices. Additionally, it works on any time frame.
FREE
VWAP Scanner is a multi-timeframe and multi-symbol dashboard and alert that checks all timeframes and symbols to find trading Opportunities based on Vwap Indicator
How to USE VWAP Scanner
First make a text file with name of Symbols Under Terminal\MQL4\Files
Write the name of symbols as its on mt4 with (,) to separate
Example :
EURUSD,USDJPY,USDCAD,GBPUSD,MCRO,MGLD,NIFTY Note- Its works in all Market And save this text file
Inputs of scanner
NameOfSymbolsTextFile = "Symbols
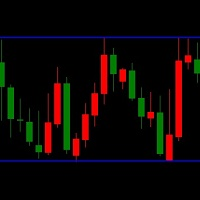
LT Triple Support Resistance Screen Method is a kind of levels indicator that consist of three SR lines. It is built by MQL4 programming language and can be used to MT4 platform. A free version indicator to determine the support and resistance levels easily This indicator works based on the screen method to calculate the most appropriate value for each buffer. A complex algorithm based on long research is applied to this free custom indicator. But this indicator has limited features and simpler
FREE

The selective pin bar is designed to identify reversals. To use the selective pin bar effectively, traders typically look for Strong Rejection: The tail of the pin bar should extend significantly beyond the surrounding price action. It indicates that there was a sharp rejection of higher or lower prices during the trading period. A strong rejection suggests that the market sentiment may be changing.
FREE

Indicator UU Bands สำหรับเทรดเดอร์ ที่ต้องการความแม่นยำ ในการเข้าเทรด หรือ หาจังหวะในการเข้าเทรด
ใช้ได้กับทุก ทามเฟรม
ข้อมูลของ อินดิเคเตอร์ 1. มี แบนด์ ด้วยกันทั้งหมด 7 เส้น 2. เส้น 3 เส้น ด้านบน เป็นแนวต้าน เคลื่อนที่ แนวต้านที่1 แนวต้านที่ 2 แนวต้านที่3 3. เส้น 3 เส้น ด้านล่าง เป็นแนวรับ เคลื่อนที่ แนวรับที่ 1 แนวรับที่ 2 แนวรับที่ 3 4. เส้นตรงกลาง เป็นเส้นแบ่ง เทรน สีเขียว หมายถึง แนวโน้มขึ้น สีแดง หมายถึง แนวโน้มลง 5. สัญลักษณ์ ลูกศร สามารถนำไปอ้างอิง เป็นจุดเข้าเทรดได้
คำแนะสำหรับกา
MT5 Version GaussChannelPro is a powerful and innovative trading indicator designed to enhance your trading strategy with the precision of Gaussian-based channels. Leveraging the principles of Gaussian (normal) distribution, this indicator creates a unique channel on your price chart, offering valuable insights into market trends and potential turning points. Utilizing advanced statistical analysis, GaussChannelPro calculates the optimal channel boundaries based on historical price data, present

Индикатор показывает точки входа. Индикатор не перерисовывает и не исчезает в истории. Индикатор может служить дополнением вашей торговой стратегии. При желание можно настроить индикатор как на агрессивную торговлю( но в этом случае будет много ложных сигналов) так же на пассивную торговлю. Хорошие показатели индикатор показывает сигналы на валютной паре GBPUSD на минутном таймфрейме.

Strength of 8 popular currencies (EUR, GBP, USD, CAD, AUD, NZD, CHF, JPY) is calculated from 28 pairs of Forex market following a Moving Average with custom period and method. You can use it by adding 2 indicators to the chart of Forex pair based on the pair currencies and use it as a confirmation on your strategies.
Currencies: EUR, GBP, USD, CAD, AUD, NZD, CHF, JPY
Inputs: Currency: 1 of the 8 currencies MA Period: Period of Moving Average MA Method: Method of Moving Average (SMA, EMA, S
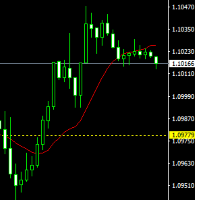
The indicator draws lines (with line objects) to the close prices of the previous day close, on selected timeframes. The indicator uses the closing price of the past day to draw a horizontal line, it can help you determine the direction of the market at the moment, which is necessary for making trades.. Parameters
Line Color Line style Line width Set on the top
FREE
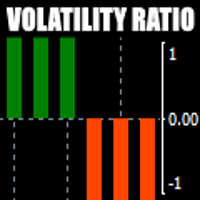
There is always a need to measure if the market is "quiet" or it is volatile. One of the possible way is to use standard deviations, but the issue is simple : We do not have some levels that could help us find out if the market is in a state of lower or higher volatility.
This indicator is attempting to do that : • values above level 0 are indicating state of higher volatility (=GREEN buffer) • values below level 0 are indicating state of lower volatility (=RED buffer)

모닝 브리핑 여기 mql5 와 텔레그램에서 FX Power MT4 NG 는 오랫동안 인기 있는 통화 강도 측정기인 FX Power의 차세대 버전입니다. 이 차세대 강도 측정기는 무엇을 제공합니까? 기존 FX Power에서 좋아했던 모든 것 PLUS GOLD/XAU 강도 분석 더욱 정밀한 계산 결과 개별 구성 가능한 분석 기간 더 나은 성능을 위한 사용자 정의 가능한 계산 한도 특별 멀티더 많은 것을보고 싶은 사람들을위한 특별한 다중 인스턴스 설정 모든 차트에서 좋아하는 색상을위한 끝없는 그래픽 설정 수많은 알림 옵션, 중요한 것을 다시는 놓치지 않도록 Windows 11 및 macOS 스타일의 둥근 모서리가 있는 새로운 디자인 마법처럼 움직이는 인디케이터 패널
FX 파워 키 특징 모든 주요 통화의 완전한 강세 이력 모든 시간대에 걸친 통화 강세 이력 모든 브로커 및 차트에서 고유 계산 결과 100% 신뢰할 수있는 실시간100 % 신뢰할 수있는 실시간 계산-> 다시 칠하지 않음
SWING X Black은 Binary Options와 Forex 거래를 조화롭게 연결하여 두 시장에서 강력한 통찰력을 활용할 수 있는 유연성을 제공합니다. 이 상호 호환성은 거래자들이 선호하는 거래 스타일에 관계없이 정보에 입각한 결정을 내릴 수 있도록 보장하여 성공의 기회를 높이는 데 도움이 됩니다. SWING X Black의 핵심 강점은 탁월한 신호 생성 기능에 있습니다. 고급 알고리즘을 기반으로 하는 이 지표는 잠재적인 추세 반전, 지지 및 저항 영역, 그리고 돌파구를 정확하게 식별하여 거래자들에게 명확한 진입 및 퇴출 지점을 제공합니다. 이 정밀도는 거래자들이 최소한의 위험으로 수익성 있는 기회를 포착하는 데 큰 도움이 됩니다. 빠르게 변화하는 거래 환경을 잘 이해하여 설계된 SWING X Black은 15분의 타임프레임에서 가장 빛을 발합니다. 이 짧은 시간 동안 거래자들은 시장 움직임을 신속하게 분석하여 시장 조건의 변화에 신속하게 대응할 수 있습니다. 15분의 만기

"HOW TO TRADE ANY CURRENCY PAIR WITH UNUSUAL PRECISION & PROFITABILITY!"
Buy Forex Trend Commander Indicator And You Will Get Trends Reversing PRO Indicator for FREE !
It's no secret that most traders reset their accounts. However, there are exceptions... Awesome exceptions! Successful traders "make money" every month. You really only need two things: good indicator for sure and proper money management. One indicator to work with Trending, Sideways and Volatile Markets. Proper money mana
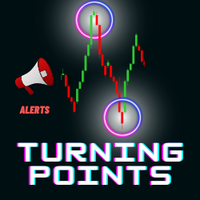
이 도구로 시장 구조를 빠르게 분석하고 중요한 가격 수준을 활용하세요.
시장 구조 이 사용자 지정 인디케이터는 중요한 가격 수준을 표시하며, 진입점 또는 수익 목표로 사용할 수 있습니다.
트레이딩 범위 파악 시장 턴오버 포인트를 참고하여 이 지표로 스캘핑하세요.
브레이크아웃 트레이딩 기회 이 지표를 사용하여 브레이크아웃 기회를 포착하세요. 이 트레이딩 전략은 우수한 위험 대비 보상 비율을 제공합니다.
맞춤 알림 가격이 특정 거래 범위를 벗어나면 휴대폰으로 알림을 받거나 이메일로 받아보세요. 이러한 알림을 트레이딩 전략에 맞게 사용자 지정해야 한다고 생각되면 언제든지 메시지를 보내주세요.
스마트 머니 개념 이 인디케이터는 스마트 머니 개념을 따르기 위해 독점 트레이더와 협력하여 개발되었습니다.
심플한 디자인 차트에 가능한 모든 영역을 그리는 대신 따라야 할 주요 영역이라고 생각되는 레벨 만 그리기로 결정했습니다. 따라서 지표가 간단하여

TrendStoch Channel Pro
Introducing our revolutionary indicator - "TrendStoch Channel Pro"! This powerful tool empowers traders to gain a comprehensive view of the market by seamlessly combining two essential features - observing larger time trends and the stochastic channel - directly on your chart.
With "TrendStoch Channel Pro," you'll experience a new level of trading precision. The indicator's ability to display larger time trends allows you to identify long-term market directions, enabli
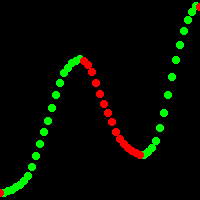
Doesn't redraw!
"Xhmaster formula forex indicator" - a new oscillator indicator with regression mathematical modeling of free numerical series. This indicator is 60% more accurate in identifying price reversal points compared to the standard "Xmaster formula" indicator, and it is less sensitive to small price fluctuations. "Xhmaster formula forex indicator" is a unique and advanced tool designed specifically for traders in the Forex market. It provides traders with excellent opportunities for s
Multicurrency indicator in table format. Signals appear with confirmation, no repaints. In the settings, you can select the number of candles/bars on which the signal will still be displayed so that the trader takes it into account and does not miss it. The indicator works on the current (open) timeframe. Notifications come for an open instrument. In the indicator settings, you can choose 1 of 4 Stochastic strategies Strategies (represented in screenshots): The main line crosses the signal line
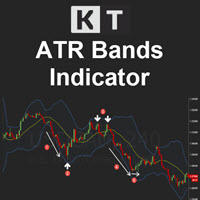
KT ATR Bands draws the volatility envelops and bands using a combination of Average True Range and Moving average. They are typically used to identify the potential reversal points and the periods of high and low volatility.
Features
Multi-Timeframe Ability: For example, you can have the atr bands from the daily timeframe on the H1 timeframe. Smart Alerts: You can turn on/off alerts for each band separately. Also, you can choose a minimum time interval between each alert to stop unnecessary,

Multicurrency indicator in table format. Signals appear with confirmation, do not redraw. The indicator works on the current (open) timeframe. Notifications come for an open instrument. The strategy includes: price touching the moving average in the direction of the trend, as well as an extraordinary recalculation of the classic ADX indicator to determine the trend as an additional filtering of entries. Entries are displayed on the chart as arrows and, as mentioned above, the arrows are not redr

indicator CE and RF Buy-Sell Chandelier Exit and Range Filter Buy Sell
It is the ultimate indicator for telling entry points or entering trades with high accuracy.
Trades must be short term trading only or Scalping only, not suitable for holding positions across several days.
Suitable for beginner traders and professional traders.
Easy Operation 1. Import Indicator, CE and RF into MT4 chart. 2. Waiting for the signal from the arrow pointing up means recommending a long position. and an
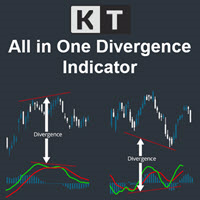
The KT All-In-One Divergence is designed to identify regular and hidden divergences between the price and 11 widely recognized oscillators. This powerful tool is indispensable for swiftly and accurately spotting market reversals. Its a must-have tool in any trader's arsenal, providing clear and accurate divergence patterns. Its accuracy and speed in identifying market reversals are remarkable, allowing traders to seize profitable opportunities confidently.
Features No Interference: You can a
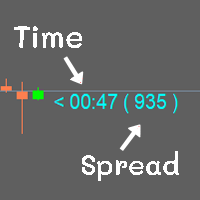
Show the time of candlesticks and spread. All data will be displayed in a rod. Can change color Can fix the size as needed
MT4 : Link https://www.mql5.com/en/market/product/102742 MT5 : Link https://www.mql5.com/en/market/product/102834
Most free code on various websites I didn't write it myself. I only do a little bit.
If you like it, please give 5 stars with it. Thank you.
FREE
RSI Divegence Win Pro
The RSI Drivergent is the best indicator for looking for price reversals.
RSI Drivergent Win Pro has used the strengths and best points of RSI to create in a format for traders to understand more easily.
Suitable for beginners and professional traders.
Case Up Trend : Blue line is below Yellow line. Case Down Trend : Blue line is abve Yellow line.
Usage is very easy. 1. Import the indicator into the MT4 chart. 2. Defind Overbought positions and defind oversold

Volume Cross Over is an indicator that measure positive and negative volume flow in a financial instrument, such as a stock, commodity, or index. It is base on the idea of On-Balance Volume developed by Joseph Granville. However instead of trending lines, this indicator shows volume cross over. When the closing price of an asset is higher than the previous closing price, then the Bull volume is greater than zero and Bear volume is negative. It suggests that buying volume is dominating, a
FREE
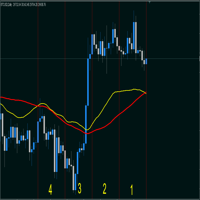
Индикатор суммируеn две средние скользящие, заданные в настройках и умножает на 2. (A + B)/2; Сдвиг на графике - смещает линию на графике.(ВАЖНО! учитывайте сдвиг на графике и сдвиг линии они суммируются, Т.Е. если смешение линий задано 50 и смещение на графике заданно 50 суммарно сдвинется на 100). Метод усреднения и тип цены классические как в средних скользящих. Период - колицество свечей для расчета. По умолчанию индикатор показывает среднею скользящию с периодом 26.
FREE
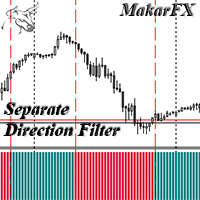
The indicator shows the Buy/Sell direction. The calculations use the opening prices and their rate of change for the billing period - "Calculation period" MTF indicator - "Calculation timeframe", no repaint - NRP. Two display types: "Simple histogram" or "Histogram level crossing" Alerts available: "Chart message", "Push message", "Email message" Two types of signals: "Change direction" or "Crossing level" Level settings: "Crossing UP level" and "Crossing DN level" Color settings. For EA: iCusto

The indicator shows the Buy/Sell direction. The calculations use the opening prices and their rate of change for the billing period - "Calculation period" MTF indicator - "Calculation timeframe", no repaint - NRP. Two display types: "Chart default" или "Chart color" For "Chart color" color customization available : "Bar color" Two types stop levels: "Simple stop level" or "Dynamic stop level " Color settings: "Stop level color" Alerts available: "Chart message", "Push message", "Email message" F

All Symbols AND All Time frames Scan
Document Introduction
The ABCD is a basic harmonic pattern. The ABCD pattern is a visual, geometric chart pattern comprised of three consecutive price swings. It looks like a diagonal lightning bolt and can indicate an upcoming trading opp

KT DMA is a modified and advanced version of the classic Displaced Moving Averages with buy/sell crossover alerts and a Multi-Timeframe scanner that shows DMA's direction across each real-time time frame. A Displaced Moving Average is a simple moving average that moves ahead or backward in a time frame (either short-term or long-term). It also allows you to predict price movement more accurately.
Features Depicts the trend direction using the alignment of three moving averages. Buy/Sell signa

here is a link to back test results
https://youtu.be/9BYDwS9aaqM
https://youtu.be/iLxh43HV91Y
However, the difficult task here for traders is to understand and select the indicator or tool that can help them with their trading plan and benefit their trading style. Traders want a tool that requires minimal effort and provides as much support as it can.
There are multiple reasons for which traders need an indicator. One such reason is to determine the buy-sell signals in the market. The

MT5 Version
Understanding market sentiment is a critical aspect of successful trading. Market sentiment refers to the overall feeling or attitude of traders and investors towards a particular financial instrument, such as a stock, currency pair, or cryptocurrency. It is a collective perception of market participants' emotions and beliefs about the asset's future price direction. Market sentiment can be bullish (positive), bearish (negative), or neutral (sideways). Knowing the market sentiment
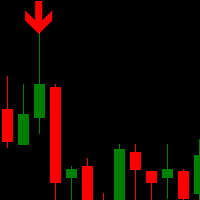
Trend Scalper Arrows is a unique trend reversal 100% non-repainting multi-algo indicator that can be used on all symbols/instruments: forex, commodities, cryptocurrencies, indices, stocks . Trend Scalper Arrows will determine the current trend at its early stages, gathering information and data from up to 10 standard algos When indicator give a valid buy or sell signal, a corresponding arrow will be printed on the chart, open trade at start of the next candle/bar indicating a
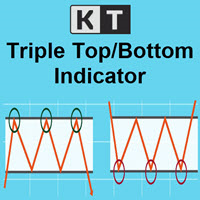
KT Triple Top-Bottom identifies the triple top/bottom pattern with a breakout signal in the opposite direction. It is used to identify potential trend reversals.
A Triple Top pattern is formed when the price reaches a high point three times, while a Triple Bottom pattern occurs when the price comes to a low point three times.
Features The indicator detects the triple top/bottom pattern with high precision and accuracy. The indicator suggests a shift in momentum, with sellers or buyers takin
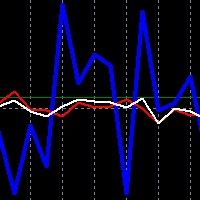
For the new traders of this strategy please remember the convention:
FORWARD trade = BUY AUDUSD and SELL NZDUSD at equal lot size
REVERSE trade = SELL AUDUSD and BUY NZDUSD at equal lot size
Risk is mittigated by the opposing nature of the trades, one tends to offset the other almost 70% of the time, and for when this is not the case we rely on the indicators accordingly - no stops are used in correlation hedge!
This is an enhanced oscillator like analysis of the relationship betw
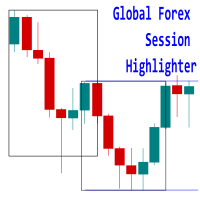
Introducing the 'Global Forex Session Highlighter' , a powerful tool designed to enhance your trading strategy by providing a visual representation of the Three major Forex trading sessions: Tokyo, London, and New York. This indicator is designed to help traders understand the dynamics of the global Forex market by highlighting the trading sessions directly on your MT4 chart. It provides a clear view of when each session starts and ends, allowing you to strategize your trades around the most
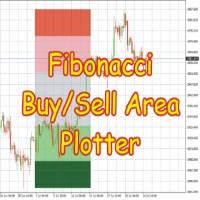
This Indicator is based on Fibonacci levels and draws Buy & Sell Areas. Buy areas are defined in green color (light green & dark green) while Sell areas are defined in red color (light red pink and darker color) Rectangles to easily know that whether price is in buy area or sell area. If price is in gray area, wait for price to come in to your desired area. You can use on any Forex Pairs.
This indicator calculates on the basis of h4 timeframe no matter what time frame you have selected, its cal

소개 Quantum Heiken Ashi PRO 차트 시장 동향에 대한 명확한 통찰력을 제공하도록 설계된 Heiken Ashi 양초는 노이즈를 필터링하고 잘못된 신호를 제거하는 기능으로 유명합니다. 혼란스러운 가격 변동에 작별을 고하고 더 매끄럽고 신뢰할 수 있는 차트 표현을 만나보세요. Quantum Heiken Ashi PRO를 정말 독특하게 만드는 것은 전통적인 촛대 데이터를 읽기 쉬운 색상 막대로 변환하는 혁신적인 공식입니다. 빨간색과 녹색 막대는 각각 약세와 강세 추세를 우아하게 강조하여 잠재적 진입점과 퇴장점을 매우 정확하게 파악할 수 있습니다.
Quantum EA 채널: 여기를 클릭하세요
MT5 버전: 여기를 클릭하세요
이 놀라운 지표는 다음과 같은 몇 가지 주요 이점을 제공합니다. 선명도 향상: Heiken Ashi 바는 가격 변동을 완화하여 시장 추세를 보다 명확하게 나타내므로 유리한 거래 기회를 쉽게 식별할 수 있
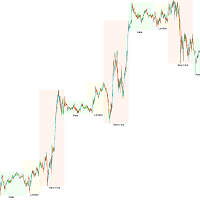
거래 세션, 시장 시간, 세션 시간, 외환 시간, 거래 일정, 시장 개/폐장 시간, 거래 시간대, 세션 지표, 시장 시계, ICT, 아시아 킬존, 런던 킬존, 뉴욕 킬존 트레이더들은 거래 시간대의 영향을 주목해야 합니다. 다른 시장 활동 시간과 거래량은 통화 쌍의 변동성과 거래 기회에 직접적인 영향을 미칠 수 있습니다. 트레이더들이 시장 상황을 종합적으로 이해하고 더 나은 거래 전략을 수립할 수 있도록 도와주기 위해 거래 세션 지표를 개발했습니다. 이 지표는 아시아, 런던, 뉴욕 시장의 거래 시간을 표시합니다. 사용자는 더 편리한 사용을 위해 다른 거래 시간대를 표시하거나 숨길 수 있습니다. 또한 설정에 따라 거래 세션의 이름을 표시하거나 숨길 수 있으며, 최대 표시 수를 제한할 수 있습니다.
실제 사용 프로세스는 매우 간단합니다. 지표를 구매한 후, 지표 파일을 메타트레이더 5 플랫폼의 지표 폴더에 복사하고, 메타트레이더 5 플랫폼에서 지표를 적용할 차트를 엽니다. 지표 목록에서
FREE

ICT, SMC, 스마트 머니 컨셉트(Smart Money Concept), 지지 및 저항(Support and Resistance), 추세 분석(Trend Analysis), 가격 행동(Price Action), 시장 구조(Market Structure), 주문 블록(Order Blocks), 브레이커 블록(Breaker Blocks), 모멘텀 변화(Momentum Shift), 강한 불균형(Strong Imbalance), HH/LL/HL/LH, 공정 가치 격차(Fair Value Gap), FVG, 프리미엄 및 디스카운트 영역(Premium & Discount Zones), 피보나치 리트레이스먼트(Fibonacci Retracement), OTE, 매수 측 유동성(Buyside Liquidity), 매도 측 유동성(Sellside Liquidity), 유동성 공백(Liquidity Voids), 시장 세션(Market Sessions), NDOG, NWOG, 실버 불릿(Silv
3-HMA Multi-Timeframe Trend Indicator를 사용하여 시장 추세의 힘을 전보다도 더 크게 해제하세요. 이 신뢰할 수 있는 도구는 복잡한 외환 거래 세계에서의 신뢰할 수 있는 파트너입니다. 이 도구는 유연성과 정확성을 염두에 두고 설계되었으며, 트렌드 추적의 중요성을 이해하고 Hull Moving Average (HMA)의 비교 불가능한 반응성을 활용하려는 트레이더에게 이상적입니다.
Hull Moving Average는 시장 지연을 최소화하는 놀라운 능력 덕분에 일반 이동 평균들과 구별됩니다. 이 독특한 특성은 HMA를 시장 추세의 변화를 빠르고 정확하게 식별하는 강력한 도구로 만들어, 트레이더들에게 필요한 중요한 이점을 제공합니다.
우리의 지표는 여러 시간대에 걸친 HMA 전략을 적용함으로써 HMA 전략의 효율성을 향상시킵니다. 이는 시장에 대한 포괄적인 시야를 제공함을 의미하며, 이를 통해 더욱 신중한 결정을 내리고 이익 가능성을 극대화할 수 있습

"Turbo Helper for scalping" is a fully prepared trading system. It shows the trader with an arrow on the chart when to open an order and in which direction. It also indicates to the trader with a square symbol when to close the trade. After that, the indicator displays the estimated number of points for the trade on the chart. This value may vary slightly as the indicator does not take into account the actual spread size and swap of your broker. However, to calculate more accurately, you can spe

The Smart Strategy Indicator is a trading system that allows you to analyze the market in terms of several aspects of technical analysis. The first of them is a price channel, which is built automatically and allows the trader to see the main direction of price movement. It also makes it possible to analyze the market using a channel strategy (breakout and rebound from channel lines).
Block 2 is the SAR system, which gives general information about the micro-movements in the market and this i
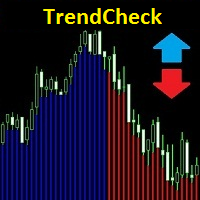
The indicator has a new logic, which significantly distinguishes it from many analogues. It gives early entry and exit signals, does not redraw its values - that is, if the indicator gave a signal to enter a trade, then this signal will not disappear and will not move - it will remain where it appeared, and it also gives signals to opening a candle, which gives the trader a significant advantage in trading.
The indicator is very easy to use. When a red line appears under the candles, you need

All Symbols AND All Time frames Scan
Document Introduction
A breakout refers to when the price of an asset moves above a resistance zone or moves below a support zone. A breakout indicates the potential for a price trend to break.Break provides a potential business opportunity. A break from the top signals to traders that it is better to take a buy position or close a sell position. A breakout from the bottom signals to traders that it is better to take sell positions or close the

Presenting the uGenesys Break of Structure and Change of Character Indicator The uGenesys Market Structure Indicator is the advanced solution designed specifically for forex traders seeking a competitive edge. This innovative tool goes beyond merely identifying Break of Structure (BoS) and Change of Character (CHoC); it also illuminates optimal entry and exit points on your forex charts, transforming your trading experience.
While the uGenesys Market Structure Indicator can reveal pivotal pa

This indicator was developed to facilitate the analysis of BBMA Oma Ally strategy In the previous version, it's almost similar scanner indicator was built the indicator identifies the basic pattern of BBMA Oma Ally (reentry, MHV, rejection EMA50 and extreme) To get information on the chart, please download the BBMA Labels indicator via this link In BBMA Oma Ally advanced strategy, to validate reentry on a major timeframe, a "full setup" is required on a lower timeframe
The full setup structu
FREE

The indicator marks the points on the chart where the standard ZigZag indicator has drawn its top or bottom. With this indicator, you can easily understand where the top or bottom was formed, and where it was redrawn. The indicator gives an alert when a new point appears. Warning! Parameter Applied Price - expands the possibilities of building the indicator. It is possible to build at OPEN, CLOSE and standard HIGH/LOW prices. Input parameters ----------- Depth - period of the ZigZag ind
FREE

The DVV indicator is a multifaceted informative indicator for the Forex market or the Cryptocurrency market . The indicator gives clear and reliable signals without redrawin g. The indicator can be used in bots by taking readings from its zero buffer.
Please note that for different currency pairs, the settings must be selected separately, this is not difficult.
Changing the input parameters greatly affects the display. I will show four options for using the indicator. The indicator
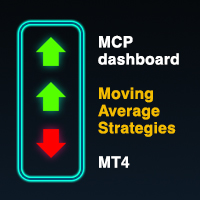
Multicurrency indicator in table format. Signals appear with confirmation, no repaints. Works on the current (open) timeframe. Notifications come for an open instrument. In the indicator settings, you can choose 1 of 4 Moving Average strategies. Strategies (represented in screenshots): Classic fast and slow moving average crossover Reverse signal of classic crossing (used for flat/sideways movement) Classic crossover relative to a slower moving average (Trend MA in settings) Price touching the f
MetaTrader 마켓은 거래 로봇과 기술 지표들의 독특한 스토어입니다.
MQL5.community 사용자 메모를 읽어보셔서 트레이더들에게 제공하는 고유한 서비스(거래 시그널 복사, 프리랜서가 개발한 맞춤형 애플리케이션, 결제 시스템 및 MQL5 클라우드 네트워크를 통한 자동 결제)에 대해 자세히 알아보십시오.
트레이딩 기회를 놓치고 있어요:
- 무료 트레이딩 앱
- 복사용 8,000 이상의 시그널
- 금융 시장 개척을 위한 경제 뉴스
등록
로그인
계정이 없으시면, 가입하십시오
MQL5.com 웹사이트에 로그인을 하기 위해 쿠키를 허용하십시오.
브라우저에서 필요한 설정을 활성화하시지 않으면, 로그인할 수 없습니다.