MetaTrader 4용 새 기술 지표 - 84

Multicurrency and multitimeframe modification of the indicator Bollinger Bands. On the dashboard you can see breakouts and touches of the Bollinger Bands. In the parameters you can specify any desired currencies and timeframes. The indicator can also send notifications when the price touches the Bollinger Bands, when the current volatility changes (expands or falls), and when the price touches all the bands. By clicking on a cell with a period, this symbol and period will be opened. This is MTF
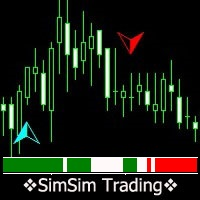
The indicator calculates and summarizes data from 25 standard indicators. What standard indicators to use, the trader chooses himself. As a result of the calculation, we obtain the current signal level. Positive values of the signal indicate a possible purchase, negative values indicate a sale.
The indicator implements a testing system that can be tested by downloading the demo version. And the main user chooses the indicators necessary for him and indicates the parameters of these indicator
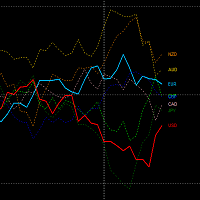
This indicator will allow you to monitor the relative strength of individual currencies within the entire monetary basket.
Getting information on the strength of the currencies will be simple and immediate, as will the identification of any differences.
It is possible to have three different display modes. In fact, it is possible to choose to display all the currencies, the currencies of the current symbol in evidence compared to the rest of the basket, or to isolate and display only the cu
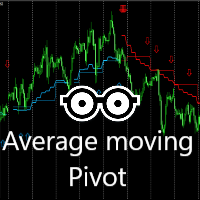
This indicator is very effective for trading everyday. A combination of moving averages and 2X Pivots calculation to produce a very convincing signal everyday. Blue colour signals a buy opportunity. Follow the arrows for possible buy points. The Blue pivots and average line, serves as possible support. Red colour signals a sell opportunity. Follow the arrows for possible sell points. The Red pivots and average line, serves as possible resistance. Best use on the 15 minutes, 30 minutes or 1 hour
FREE

Description
ABC Trend Levels is an indicator that identifies market trends and important trend support and resistance levels.
Recommendations
You can use this indicator to determine the trend and, accordingly, to determine the direction of opening a position or closing an opposite position.
Parameters
===== _INDICATOR_SETTINGS_ ===== - indicator settings Maximum History Bars - maximum number of history bars for calculating the indicator. Average True Range Period - ATR indicator perio
Description
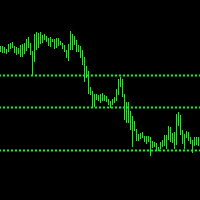
ABC Trend Levels Pro is an indicator that identifies market trends and important trend support and resistance levels.
Recommendations
You can use this indicator to determine the trend and, accordingly, to determine the direction of opening a position or closing an opposite position.
Parameters
===== _INDICATOR_SETTINGS_ ===== - indicator settings Maximum History Bars - maximum number of history bars for calculating the indicator. Average True Range Period - ATR indicator

The Unexpected indicator is surprisingly easy to use. You will appreciate the simplicity of the indicator in the very first days of trading. If you correctly determine the beginning of the trend, the result of the transaction will be appropriate. Trading based on trend indicators is the simplest and often the most effective. If you use a live binary options chart as a base, the chances of success are even higher.
This indicator can track the steady price movement in a certain direction. In th

The principle of this indicator is very simple: detecting the trend with Moving Average, then monitoring the return point of graph by using the crossing of Stochastic Oscillator and finally predicting BUY and SELL signal with arrows, alerts and notifications. The parameters are fixed and automatically calculated on each time frame. Example: If you install indicator on EURUSD, timeframe M5: the indicator will detect the main trend with the Moving Average on this timeframe (for example the Moving

A new trend determination algorithm has been developed for this indicator. The algorithm with acceptable accuracy generates input signals and output levels. Strategy for trend trading, filtering and all the necessary functions built into one tool! The principle of the indicator’s operation is to automatically determine the current state of the market when placing it on a chart, analyze historical data based on historical data and display instructions for further actions on the screen to the trad

BPS Panel
Breakout Pro Scalper Solution Panel
This indicator is part of the RPTrade Pro Solutions systems. BPS Panel is a daily trend indicator using Price Action, Dynamic Support and Resistances. It's designed to be used by anyone, even the absolute beginner in trading can use it. NEVER repaints . Indications are given from close to close . Designed to be used alone , no other indicators are required. Gives you the trend and potential Take Profit at the beginning of the day.
How

The indicator is designed for binary options and short-term transactions on Forex To enter a trade when a signal appears blue up arrow buy red down arrow sell signal For Forex enter on a signal exit on the opposite signal or take profit For binary options Enter on 1 candle, if the deal goes negative, set a catch on the next candle Works on all timeframes If you apply a filter like Rsi, you will get a good reliable strategy.. The algorithm is at the stage of improvement and will be further develo
Mean Reversion Probability indicator is a tool based on a mathematical theory of mean reversion . As the markets very often shows the behavior of diverging from its mean, up to a certain distance, and then start to converge its mean again. This is a very well known phenomenon in stochastic processes and the price series is also a stochastic variable so we apply certain mathematical and statistical procedures to estimate the turning point .
Using Mean Reversion indicator, traders could potential

Pivots MT4 - Простой и удобный индикатор уровней pivot , рассчитывает уровни по методам Classic , Fibonacci , DeMark , Camarilla , WooDie , Central Pivot Range . Индикатор выгодно отличается следующим
Рассчитывает уровни pivot по методам Classic , Fibonacci , DeMark , Camarilla , WooDie , Central Pivot Range ; Выводит на графике текущие уровни и уровни на предыдущих периодах; Выводит на графике выбранные метод и период, названия уровней и их ценовые значения. Параметры Pivot Method - Вып

Heikin Ashi is Japanese for "average bar", and may make it easier for you to identify trends. Our version of this popular indicator adjusts the size of the candles based on the zoom level of your chart, making it appear more naturally just like the traditional candlesticks. The colors are selected based on the color scheme you use on your charts, but can be customized anyway you would like. You may also choose whether to display only the Heikin Ashi candles, or show the other selected chart as w
FREE

Moving Average Convergence Divergence (MACD) combined with Traders Dynamic Index (TDI) Input parameters: signal mode: true if you want to plug it into STAT (Signal Tester and Trader) arrow shift: distance between TDI line to arrow on chart middle band: use middle band (middle bolinger band) signal filter price line: use 50 price line signal filter RSI period RSI price method volatility period moving average RSI period moving average signal period moving average method use MACD indicator fast MAC
FREE

IntradayMagic прогнозирует характер ATR и тиковых объёмов на 1 сутки вперёд. Индикатор не перерисовывается и не отстаёт. Используя Intraday Magic вы можете значительно повысить качество торговли и избежать излишних рисков. По его показаниям можно детектировать кризисные состояния рынка и моменты разворота тренда, уточнять моменты и направления входов. Это бесплатная ознакомительная версия ограничена символами (парами) включающими GBP. Никаких иных ограничений нет. Для других пар вы можете исполь
FREE
Pro Trade Signal Arrows is an indicator that generates trade arrows. It generates trade arrows with its own algorithm. Bu oklar alış ve satış sinyalleri verir. Gösterge kesinlikle yeniden boyanmıyor. Sinyalin verildiği nokta değişmez. Tüm grafiklerde kullanabilirsiniz. Tüm çiftlerde kullanabilirsiniz. Bu gösterge, giriş ve çıkış sinyallerini oklar ve uyarı olarak gösterir. When sl_tp is set to true, the indicator will send you the close long and close short warnings It tells you that you should
Trend Direction Estimation * Please use the free demo before renting or buying. This indicator works in all kinds of frames and presents you the trend in the time period you choose. This trial period (Rental for 1 month) offered for promotion is valid for a limited number of copies. At the end of the trial period, longer term rental and unlimited purchase options will also be opened in it's new prices. My expert advisor work is continuing for the strategies I have been developing for the Trend

Fourteen plus nine What is it for? Applying Tom DeMark’s TD Sequential serves the purpose of identifying a price point where an uptrend or a downtrend exhausts itself and reverses. . What are the main components of TD Sequential? TD Sequential has two parts – TD Setup and TD Countdown. The first phase of TD Sequential starts with a TD Setup and is completed with a 9 count. When the 9 count is completed, it is at that point, a price pause, price pullback, or reversal is likely. It is also at tha

An indicator that determines the point levels of price resistance. The arrows indicate price bounces in the indicated directions.
Arrows are not redrawn formed on the current candle, shown on the previous candle for convenience.
It has one setting - the formation intensity:
If the parameter is smaller, most of the signals are formed in a wide trend. If the parameter is larger, signals are formed in a narrower trend.
Input parameters
Formation Intensity - Arrow Formation Intensity Num

This indicator will draw monthly, weekly, and daily pivot. Pivot line will be calculated automatically again when the period ends. Auto Pivot Metatrader 4 Indicator The Auto Pivot indicator for Metatrader 4 automatically updates the pivot point (PP), support (S1,S2,S3) and resistance levels (r1,r2,r3) every day. Price above the pivot point means positive while price below the pivot point means negative. S3 indicates extremely oversold while price above resistance r3 means extremely overbought.
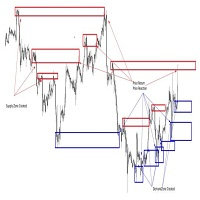
While most traders use various technical indicators, the price action is basically determined by the buying and selling activity. This is how support and resistance levels, which are commonly used terms in technical analysis is formed.
Traders know that when price reaches a support level, price can bounce off this support. This is also known as a level where this is high demand. A high demand area forms when there are more buyers than sellers.
In trading, investors tend to buy at the suppo
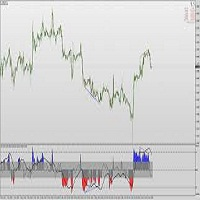
The "Preface" Input-
Broker time is required by the code that features PivotsTz and vLines. When data feed is live the broker time is available. When data feed is not live it is not available. The purpose of this "Preface" section is to find and input the Clock location that has the same time as the broker server. Then, even without live data feed we will still have the equivalent of the broker server time to work with, generated by the Clock, and the Pivots

StepOscillator - необычный осциллятор, выполнен в виде ступенчатой линии в отдельном окне индикатора. Кроме того, что линия меняет цвет при смене направления движения цены, что является сигналом к покупке или продаже, так же о силе тренда можно судить по размеру ступеньки, чем она выше, тем сильнее тренд. Кода ситуация на рынке близка к смене направления движения, линия индикатора становится практически плоской. Входные параметры: Price - цена по которой ведет расчет индикатор AlertsMessage - вк
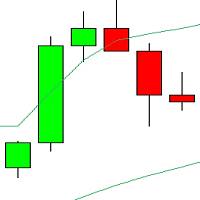
Indicator will send alerts when price has opened and closed outside bollinger bands. THIS INDICATOR SCANS EVERY PAIR ON SIDE OF MARKET WATCH SO YOU DON'T MISS A TRADE! Indicator has pop up alert for all currency pairs in your watch list. It is set up to notify you if price is outside of M15, H1, H4 automatically. This is great for seeing if market is a critical levels and at a possible reversal point.

The indicator shows the regression channel, in the calculation of which the gold Fibonacci section is used Levels are not built as graphical objects, but use indicator buffers - this allows using this indicator in Expert Advisors Near the channel borders price corrections and reversals are most probable Allows trend and counter trend trading within the channel The slope of the channel shows the direction of the market, and its width - the current volatility. Works on all timeframes, all currency

The principle of this indicator is very simple: detecting the trend with Moving Average, then monitoring the return point of graph by using the crossing of Stochastic Oscillator and finally predicting BUY and SELL signal with arrows, alerts and notifications. The parameters are fixed and automatically calculated on each time frame. Example: If you install indicator on EURUSD, timeframe M5: the indicator will detect the main trend with the Moving Average on this timeframe (for example the Moving

This indicators automatically draws the Support and resistances levels for you once you've dropped it on a chart. It reduces the hustle of drawing and redrawing these levels every time you analysis prices on a chart. With it, all you have to do is dropped it on a chart, adjust the settings to your liking and let the indicator do the rest. But wait, it gets better; the indicator is absolutely free! Get the new and improved version here: https://youtu.be/rTxbPOBu3nY Parameters Time-frame -> T
FREE
Scalp SWING indicator.
It works on any time frame and Instruments
It works on trending and ranging markets.
The signals are robust and does not repaint.
The system is robust and requires no supporting indicator.
You don’t need any multiple indicators to trade the markets.
The alerts/ notifications can be enabled to gain prompt entries.
The entries are at Top and Bottom of Trend Cycles
It is Very accurate and robust system- yet extremely simplified tools for the pro traders.
Sc

The principle of this indicator is very simple: detecting the trend with Moving Average, then monitoring the return point of graph by using the crossing of Stochastic Oscillator and finally predicting BUY and SELL signal with arrows, alerts and notifications. The parameters are fixed and automatically calculated on each time frame. Example: If you install indicator on EURUSD, timeframe M5: the indicator will detect the main trend with the Moving Average on this timeframe (for example the Moving

Индикатор MT4 для профессионалов. Задача индикатора - определить будущее поведение цены. Он определяет и рисует на графике: вершины и низинки волн в выбранном диапазоне цен линии прогнозируемых каналов на которых задерживается цена зоны вероятного горизонтального канала( флета) уровни Фибоначчи уровни на круглых значениях цены уникальные линии по вершинам волн. процент коррекции или импульса текущей и предыдущей волны время до окончания текущего бара. Принцип работы основан на разработанной но

The indicator shows key volumes confirmed by the price movement.
The indicator allows you to analyze volumes in the direction, frequency of occurrence, and their value.
There are 2 modes of operation: taking into account the trend and not taking into account the trend (if the parameter Period_Trend = 0, then the trend is not taken into account; if the parameter Period_Trend is greater than zero, then the trend is taken into account in volumes).
The indicator does not redraw .
Settings Histo

The indicator is designed for Forex Markets. The algorithm is based on Moving average and a few filters. When to enter into transactions The blue arrow is a buy signal. The red arrow is a sell signal Recommended options are set by default. -------------------------------------------------------- You can use Moving average to filter signals. Period 30 Method linear Weighted Apply high You can also use Alligator, Bollinger bands, RSI.

Scalping Line is an advanced average that we created for use in our trading strategy. The essence of our trading strategy is to open a buy deal when the line is blue and the price drops below the line. Or open a sell deal when the price rises above the line, and the color of the line is red. Thus, we open deals when the price for a short distance goes in the opposite direction from the general trend. We close the deal when we get the minimum profit. We trade on the timeframe M30 or H1. Better to
Indicator for binary options and scalping in the forex markets recommended expiration time 1-2 candles time frames to M30 signals when a blue dot appears it is a buy signal when the red dot appears signals appear with a candle signals do not disappear the indicator is developed on an exclusive algorithm you will not find this anywhere It is recommended to avoid trading during strong news releases
User Manual For more information pm me SL Currency28 Pair Dashboard is even used by the Banks to make profits. They take a strong currency and pitch against a weak currency This strategy i am made my other indicator SL Currency Strength Meter 28 Pair more improvement We can easily study the financial strength of multi-faceted trading SL Currency28 Pair Dashboard strength meter which creates multiple charts in a single window based on the price action of each currency in relation to

The indicator shows buy and sell signals. The " CounterTrend 4 " is designed to recognize profitable counter trend patterns from your chart. Features: The CounterTrend 4 is a Counter-Trend Trading with Simple Range Exhaustion System. Signals based on the daily trading range. The indicator calculates the trading range for the last few days and compare the price movements on short time intervals and generating short term reversal points. This is a leading indicator. It works on any instruments.
The brand new trading indicator using the TD Sequential strategy is presented by KING.Ai. This indicator were built base on the the theory of TD Sequential . TD Sequential difficult can by seen by human eye. Indicator can help to identical the pattern . KING.Ai Forex trader mainly use this strategy to "See Through" market . We do believe that it is a powerful method to predict reversal time of trend . Ross Hook were developed by Tom Demark, In the late 1970s he devised some indicators called

OscillatorMotion - индикатор выполнен в виде осциллятора и показывает направление движения цены. Для удобства пользования и более точной настройки индикатора можно изменять период, количество предыдущих свечей или баров, которое индикатор берет для анализа. Так же есть функции alert и push-уведомлений. Индикатор работает на любой валютной паре и на любом таймфрейме. Входные параметры: period - количество предыдущих баров для анализа AlertSignal - включить функцию да/нет PushSignal - включить фун

MostTransactions - индикатор анализирует какие транзакции преобладают на рынке в данный момент покупки или продажи. Как правило если большинство трейдеров продает, то цена идет вверх, если преобладают покупки, то цена идет вниз. Таким образом крупные игроки заставляют обычных трейдеров терпеть убытки. Этот индикатор призван решить данную проблему. Если количество сделок на покупку превышает определенное среднее значение, то на графике появляется зеленая точка и следует ожидать движения вниз, есл
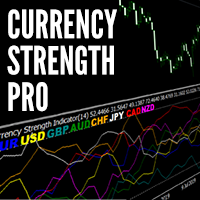
The Currency Strength Meter is the easiest way to identify the strongest and weakest currencies in the market. It works by applying clever calculations to 28 Forex pairs to establish which currencies are the driving force behind price action. By trading strength against weakness, we can greatly increase our chances of success and find some of the highest probability trends to trade. Technical Information
The strength meter uses the relative strength meter which is applied to all 8 major curren
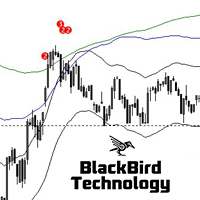
Multi MA Band Signal Indicator is a no-nonsense, no delay, no repaint indicator !
Moving Average bands together with a RSI filter is a 'simple', but very powerful and reliable signal.
Five "moving average bands" generate the signals. By default : MA25, 50, 100, 200 and 400. This can be changed in the parameters as well as the MA mode and the MA band deviation. The signal indicates the number of moving average bands that are crossed. The higher the value the stronger the signal. Two signal l

Trend Direction Arrows * Please use the free demo before renting or buying. This indicator works in all kinds of frames and presents you the trend in the time period you choose. You can try to enter the bars in the bars where the arrows are formed or it helps you to understand the trend direction in the time period you look at. This trial period (Rental for 1 month) offered for promotion is valid for a limited number of copies. At the end of the trial period, longer term rental and unlimited pu

This is a small and simple indicator for MetaTrader 4. It displays necessary information for current symbol such as : Symbol name. Total of sell volumes (lots). Total of buy volumes (lots). Total profit or loss. Some properties of this indicator such as 'Font Size', 'Text Color', 'Position', etc are customizable for your best experience. Hope this indicator helps you succeed in your trade.
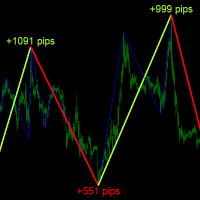
Description
ABC Trend Detector is an indicator that identifies impulses and trends in the market and displays their presence on the price chart. Found patterns are drawn as colored connecting lines between their highs and lows. Above / below each extreme, the value of the range (the number of pips) of the trend is displayed.
Recommendations
You can use this indicator to determine the trend and, accordingly, to determine the direction of opening a position or closing an opposite positi
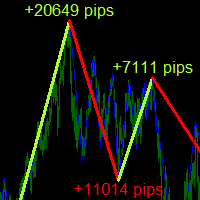
Description
ABC Trend Detector Pro is an indicator that identifies impulses and trends in the market and displays their presence on the price chart. Found patterns are drawn as colored connecting lines between their highs and lows. Above / below each extreme, the value of the range (the number of pips) of the trend is displayed.
Recommendations
You can use this indicator to determine the trend and, accordingly, to determine the direction of opening a position or closing an opposite posit

Henry - An indicator by which you can determine the levels and trend. The indicator calculates the saturation levels of the price chart. A signal to exit the resale area is a buy signal. A signal to exit the overbought area is a sell signal. Usually, you need to set relative values for the overbought and oversold levels of Bottom and Top - for this indicator.
Most often, a good trend is visible on the price chart visually. But an experienced trader must clearly understand the current balanc

FBO Trend Admiral is a professional yet simple to use trend following system. It detects the prevailing trend and gives entry points as arrows. To determine the trend it uses a unique filtering algorithm. Suitable for defining entry points for scalping as well as for intra-day trading. Features Works with the prevailing market trend. Suitable for all markets (currency pairs, metals and indices). Ideal for short time trading on the M1, M5 and M15 time frames. Does not redraw/repaint the arrows

Are you tired of the constant ups and downs? It is not worth becoming a victim of unstable market movements, it is time to somehow get rid of it! Already now, you can use Business Trend solutions to balance the analysis of price movements and get a clearer picture of price behavior.
Business Trend is a trend indicator for the MetaTrader 4 trading platform. This indicator allows you to find the most likely trend reversal points. You will no longer find a copyright indicator like this. A simple

The trader uses the Trend for Neuro indicator to determine the market situation. This is a trending algorithm that is convenient to download, install and use. The algorithm with acceptable accuracy generates input signals and output levels. Strategy for trend trading, filtering and all the necessary functions built into one tool! By launching the indicator, the user will see only two types of arrows that can change color to blue during an uptrend, to red during a downtrend there is no uncertaint

With this indicator, you can easily make price regions in all time zones. In addition, with the automatic supply demand finder, you can ensure that the new regions are found automatically. You can increase your transaction quality by reaching more accurate operations with this auxiliary Tool and indicator.
I share your trial version of EURUSD for free with you. If you want to buy the working version in all parities, you can contact me. +New version Gap Bar Add ( Press G keyboard ) Default co
FREE

The Perspective Trend indicator tracks the market trend with very high reliability. All intersection points will be ideal points at which the direction of the trend changes. Sharp price fluctuations, as well as noise around averaged prices, are ignored. Signal points, places where color changes, can be used as points of potential market reversal. The indiuctor algorithm implements a kind of technical analysis based on the idea that the market is cyclical in nature. This development can be used b

Ultimate pattern builder indicator
Allows you to build any pattern with up to 3 candlesticks (+ special fourth). This indicator is special because you can create any pattern you want, by modifying body and both wicks separately to your needs. If you ever wanted to create your own patterns , or just adjust any known popular pattern, then this is perfect for you. With this indicator you can learn how to build candles, testing it in strategy tester and get marked new candles on realtime charts, h
FREE

IntradayMagic predicts the nature of ATR and tick volumes for 1 day ahead. The indicator does not redraw and does not lag behind. Using Intraday Magic, you can significantly improve the quality of trading and avoid unnecessary risks. According to its indications, you can detect the crisis state of the market and the moments of trend reversal, specify the moments and directions of entries. How the indicator works Periodic events, exchange schedules, Bank schedules, expirations, and other similar
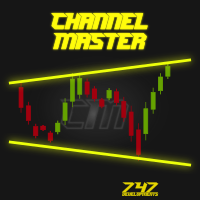
Channel Master is unique indicator for automatic channel finding. This indicator is fully adjustable by user. User can also put more instances of Channel Master to one chart with different channel size for better trend filtering. To find more information visit the 747Developments website. Features
Easy to use (just drag & drop to the chart) Fully adjustable Accessible via iCustom function Possible to use with any trading instrument Possible to use on any time-frame
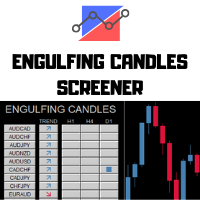
---> Check all the other products <---
The Engulfing Candles Screener is a deeply customizable dashboard.
You can chose a trend filter, using 2 EMAs, with custom periods applied on a custom TimeFrames Then you can choose 3 timeframes to search, any TimeFrame is suitable and the screener will find the engulfing candles in the selected timeframe. 3 Timeframes to scan All the major forex pairs and crosses - up to 28 symbols Deeply Customizable
How to setup the screener:
Let the crosses v
With this indicator, you can easily make price regions in all time zones. In addition, with the automatic supply demand finder, you can ensure that the new regions are found automatically. You can increase your transaction quality by reaching more accurate operations with this auxiliary Tool and indicator.
I share your trial version of EURUSD for free with you. If you want to buy the working version in all parities, you can contact me. +New version Gap Bar Add ( Press G keyboard ) +Redsword
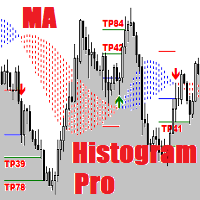
MA Histogram Pro is an expensive version of the indicator. It is equipped with the second Take Profit (TP) and is more equipped ( has a positive optimization method) than its cheaper brother. Simple and effective system with automatic optimization. See my forecasts .
MA Histogram are used primarily as trend indicators and also identify support and resistance levels.
Equipment:
Take Profit 1 Take Profit 2
Stop Loss Automatic optimization Result R/R Consecutive losses
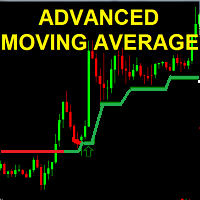
the Advanced MOVING AVERAGE indicator This is a formula of moving average based on support and resistance levels Two Colors indicator : UP trend --> Green Down trend -->Red Arrows UP/Down are shown for trend reversal indication ALERTS and mobile Push NOTIFICATIONS Simple Strategy : BUY on price over new green line Sell on price under new red line
Works on any TIMEFRAME MAin Input for calculation : index = 20.. 50..100..500 ... 1000 (Lower time frame -> Hi

The ADX Indicator is known to be used to determine the trend direction. Not only that, but it also has deviation (+DI and -DI) that determine the direction of the trend as well. The role of the indicator is to spot the trend and its direction and generate signals accordingly.
Indicator Settings: - ADX period : default is 14 periods (it works best with the timeframe H1). - Signal Width : the size of signals arrows. - Signal Distance : the distance of the signal arrow from the candle. - Signal c
FREE

No idea why demo is not working. you can check the GIF to see how it works.
Features With this scanner you can detect Candles which are below/above yesterday high/low lines. A pair's rectangle turns RED in dashboard if it is above the yesterday high, and rectangle turns GREEN in dashboard if it is below the yesterday low. It gives alerts in every 15m candle close. Contains a Dashboard which will help you to see all market pair's. It is possible to disable this sorting through to make it easie

TWO PAIRS SQUARE HEDGE METER INDICATOR Try this brilliant 2 pairs square indicator It draws a square wave of the relation between your two inputs symbols when square wave indicates -1 then it is very great opportunity to SELL pair1 and BUY Pair2 when square wave indicates +1 then it is very great opportunity to BUY pair1 and SELL Pair2 the inputs are : 2 pairs of symbols then index value : i use 20 for M30 charts ( you can try other values : 40/50 for M15 , : 30 for M30 , : 10 for H1 ,
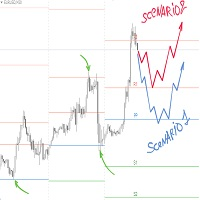
Pivot Point is a technical tool widely used by traders to predict major support and resistance price levels by calculating previous history and to predict the current price reversal points. Traders want to determine about the swing point from which there should be much possibility that the market price will be getting back, in such analysis pivot point plays an important rule. Different site explaining the logic of pivot point as:
A technical analysis indicator used to determine the overall t

The indicator displays 05 important parameters for traders 1. Display Bid -ASK price in big font 2. Display currency pair name and large time frame 3. TradeTick parameters 4. Swaplong and SwapShort 5. Point parameters used to calculate the price of SL or TP Indicators include 02 files supporting MT4 and MT5, You can download the link below. And follow the instructions of the video.

This indicator supports fast drawing of trendlines 1. Support drawing the next peak higher than the previous peak 2. Support drawing the lower peak after the previous peak 3. Support drawing the lower bottom of the bottom. 4. Support to draw the lower bottom higher than the previous bottom. 5. Support drawing trendline across the price zone. Peak connected vertex 6. Support drawing trendline across price range. Bottom connected Link to download and use for free. Including 02 files s

High-accuracy trend indicators, please use in 1H timeframe,Try not to use it in other cycles,Can be used on any currency pair. This indicator is a trend indicator, which can accurately judge the trend. Can be combined with other indicators to increase accuracy. Can be used as a good entry point, will continue to optimize if you have any questions, please contact the author.
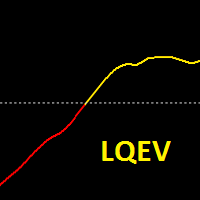
LINEAR QUADRATIC ESTIMATION OF VELOCITY OSCILLATOR Linear quadratic estimation (LQE) is an algorithm that generates predictions of unknown variables observed over time using statistical noise and other inaccuracies and predicts a single measurement more accurately than those based on it. linear quadratic estimation of velocity oscillator shows trend. You can use this oscillator all pairs and on all timeframes. Better results are H1 and H4.

Kalman Filter Velocity Oscillator Kalman filter is an algorithm that uses a series of measurements observed over time, containing statistical noise and other inaccuracies. The filter was originally designed to work with noisy data. Also, it is able to work with incomplete data. Another advantage is that it is designed for and applied in dynamic systems; our price chart belongs to such systems. This Oscillator works all pairs, all timeframes, on separete windows and zero based oscillator.

FREE DOWNLOAD Understanding Support & Resistance Support and Resistance are critical levels used by market participants in making decisions. This level is used to determine whether the price will continue or reverse direction. If this Support and Resistance is combined with candlestick forms, it is believed that it will be able to determine the next movement. Economic support can be interpreted as a level where supply begins to decrease and demand increases so that if that happens, prices will

Place price Alerts on extended Rectangles and Trendlines - Risk reward indicator mt4 Extend Rectangles & Trendlines to the right edge Mark your supply demand zones with extended rectangle and draw support resistance lines with extended trendline. Find detailed manuals here . Find contacts on my profile . MT4 Rectangle extender indicator will simplify and make it easier for you to analyze markets and stay notified about important events. When you extend rectangle or trendline the action bu
MetaTrader 마켓은 거래로봇과 기술지표를 판매하기에 최적의 장소입니다.
오직 어플리케이션만 개발하면 됩니다. 수백만 명의 MetaTrader 사용자에게 제품을 제공하기 위해 마켓에 제품을 게시하는 방법에 대해 설명해 드리겠습니다.
트레이딩 기회를 놓치고 있어요:
- 무료 트레이딩 앱
- 복사용 8,000 이상의 시그널
- 금융 시장 개척을 위한 경제 뉴스
등록
로그인
계정이 없으시면, 가입하십시오
MQL5.com 웹사이트에 로그인을 하기 위해 쿠키를 허용하십시오.
브라우저에서 필요한 설정을 활성화하시지 않으면, 로그인할 수 없습니다.