MetaTrader 4용 새 기술 지표

4.8(25 reviews) Rating on gogojungle
【 TrendLinePro2 】 MT4(MetaTrader 4) 라인 트레이딩 보조 지표입니다. 다우 이론에 충실하다고 가정하면 모든 사람에게 권장되는 매우 기본적인 사양입니다. 다우 이론에 기반한 트렌드를 인식하고, 나아가 실시간으로 지지선, 저항선, 트렌드선을 자동으로 그립니다. 정확도가 매우 높습니다.
【 행동 확인 】 Youtube에서 매주 주말에 행동을 확인하는 동영상이 업로드됩니다.
【 지그재그 】 차트 모양에서 생성된 원래 지그재그를 기반으로 다우 이론에 맞춰 작성되었습니다. 지그재그에서 읽을 수 있는 트렌드는 다우 이론에 따라 최대 8단계까지 묶습니다.
【 기호 】 다우 이론에 기반한 8단계 지그재그를 따라 트렌드 방향을 보여줍니다. 녹색(상승 추세) 빨간색(하락 추세) 흰색(추세 없음) 노란색(최소값에서 5개 이상의 추세가 상승 추세를 나타냄) 노란색(최

Reversal Zones Pro is an indicator specifically designed to accurately identify key trend reversal zones. It calculates the average true range of price movement from the lower to upper boundaries and visually displays potential zones directly on the chart, helping traders effectively identify important trend reversal points.
Key Features:
Reversal Zone Identification: The indicator visually displays potential reversal zones directly on the chart. This helps traders effectively identify impo
이동 평균선을 정밀 조정하는 궁극의 도구 이 도구는 이동 평균선 설정을 간소화하고 최적화하도록 설계된 고급 도구입니다. MA Tuner를 사용하면 사용자 친화적인 패널을 통해 핵심 매개변수(기간, 이동, 방법 및 가격)를 손쉽게 조정할 수 있으며, 촛대가 MA 선을 교차하는 빈도와 그에 대한 개방 및 종가 위치에 대한 자세한 통계 정보를 즉시 확인할 수 있습니다. 표준 이동 평균선 지표와 비교할 때 MA Tuner는 두드러진 장점을 제공합니다. 비록 MA Tuner가 표준 이동 평균선 지표와 동일한 MA 선을 그리지만, MA Tuner를 사용하면 매번 기간을 1로 증가시키거나 이동할 때마다 지표 창을 열 필요가 없습니다. 이러한 설계는 조작의 편리성과 효율성을 크게 향상시켜 주며, 복잡한 설정 조정에 시간을 낭비할 필요 없이 거래 전략 최적화에 더욱 집중할 수 있게 합니다. MA Tuner의 기능은 시장 동향 분석을 더욱 향상시킬 뿐만 아니라 실시간 거래 중에도 즉시 피드백을 제공
FREE
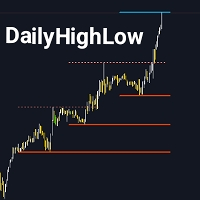
DailyHighLow 지표는 MetaTrader 4 (MT4) 플랫폼을 위해 개발되었으며, 트레이더가 일일 가격 움직임을 모니터링하는 데 도움을 줍니다. 이 지표는 특정 기간의 최고 및 최저 가격을 기반으로 자동으로 추세선을 그려주어 시장에 대한 시각적 통찰을 제공합니다. 주요 특징: 맞춤형 추세선: 추세선의 색상, 스타일 및 두께를 원하는 대로 조정할 수 있습니다. 비파괴 추세선과 파괴된 추세선을 모두 구성할 수 있습니다. 동적 업데이트: 최신 시장 데이터를 기반으로 추세선이 자동으로 업데이트되며, 파손 시각적 표시기를 제공합니다. 유연한 파라미터: 표시할 일수, 파손 후 선의 종료 시간 및 최고 및 최저 가격의 추세선 외관을 조정할 수 있습니다. 명확한 시각 효과: 파손된 추세선과 비파손된 추세선을 색상과 스타일로 구분하여 중요한 시장 수준을 신속하게 식별할 수 있습니다. DailyHighLow 지표는 거래 전략을 지원하는 유용한 도구로, 단기 및 장기 시장 추세를 분석하는 데
FREE

Smart Fibo Zones are powerful, auto-generated Fibonacci Retracements that are anchored to key market structure shifts . These zones serve as critical Supply and Demand levels, guiding you to identify potential price reactions and confirm market direction. Fibonacci calculations, widely used by professional traders, can be complex when it comes to identifying highs and lows. However, Smart Fibo Zones simplify this process by automatically highlighting order blocks and key zones, complete with St
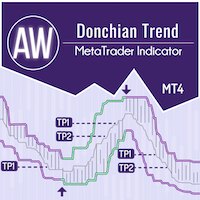
AW Donchian Trend는 Donchian 채널을 기반으로 하는 트렌드 지표입니다. 이 지표는 TakeProfit 및 StopLoss 수준을 계산할 수 있으며, 신호의 성공에 대한 고급 통계와 수신된 신호에 대한 세 가지 유형의 알림을 제공합니다. 설치 가이드 및 지침 - 여기 / MT5 버전 - 여기 지표를 이용한 거래 방법: AW Donchian Trend에서 거래하는 것은 세 가지 간단한 단계로 구성됩니다. 1단계 - 포지션 개설 M15 타임프레임에서 70% 이상의 성공률로 매수 신호가 수신되면 H1 및 D1의 추세 방향을 확인하고 신호 방향과 상위 타임프레임의 추세가 일치할 때 포지션을 오픈합니다.
2단계 - 정의 손절매 반대 신호 또는 StopLoss 수준의 동적 계산으로 StopLoss를 선택합니다. 3단계 - TakeProfit 전략 정의 전략 1: TP1에 도달하면 전체 포지션을 종료합니다.
전략 2: TP1에

Volume Break Oscillator는 가격 움직임을 오실레이터 형태로 볼륨 추세와 일치시키는 지표입니다.
저는 볼륨 분석을 제 전략에 통합하고 싶었지만 OBV, Money Flow Index, A/D, Volume Weighted Macd 및 기타 여러 지표와 같은 대부분의 볼륨 지표에 항상 실망했습니다. 그래서 저는 이 지표를 직접 작성했고, 얼마나 유용한지 만족스러워서 시장에 공개하기로 결정했습니다.
주요 기능:
가격이 볼륨 증가(브레이크)로 지원되는 방향으로 움직이는 단계를 강조합니다. 볼륨 증가가 멈추고 시장이 수축되는 단계를 강조합니다. 특히 시간 프레임(<=15분)이 있는 일중 거래에서 가격이나 볼륨이 움직이지 않아 시장이 향후 상승에 대비하는 단계를 강조합니다. 볼륨 증가로 지원되지 않는 다른 전문가 자문가의 거짓 신호를 걸러냅니다. 추세와 범위 단계를 시각화하는 것이 매우 쉽습니다. 입력 매개변수:
계산 설정:
계산 유형: FAST, NORM
"Real Time MultiIndicator"란 무엇인가요? "Real Time MultiIndicator"는 기술 분석을 단순화하고 최적화하기 위해 설계된 고급 거래 도구입니다. 이 혁신적인 지표는 여러 시간 프레임과 기술 지표에서 신호를 수집하여 하나의 명확하고 읽기 쉬운 표로 표시합니다. 차트를 계속 변경하거나 각 지표를 수동으로 분석하지 않고도 시장에 대한 전체적이고 상세한 통찰을 원하신다면, "Real Time MultiIndicator"가 최적의 솔루션입니다. 왜 "Real Time MultiIndicator"를 선택해야 하나요? 다중 시간 프레임 분석: "Real Time MultiIndicator"는 다양한 시간 프레임에서 시장을 동시에 모니터링할 수 있게 해줍니다. M15에서 H4까지, 이 지표는 각 시간 프레임에서 추세가 상승 중인지 하락 중인지를 명확하게 보여주어 시장의 전체적인 모습을 바탕으로 정보를 기반으로 한 결정을 내릴 수 있도록 도와줍니다. 다양한 지표
9월 1일 일요일까지 77.90달러에서 37.90달러로 할인 "Forex Scanner"란 무엇입니까? "Forex Scanner"는 실시간으로 외환 시장에 대한 포괄적인 개요를 제공하도록 설계된 강력한 거래 도구입니다. 이 고급 지표는 여러 기술 지표와 시간 프레임에서 주요 데이터를 수집하여 거래 기회를 신속하게 식별할 수 있게 해줍니다. 여러 자산과 매개변수를 모니터링하면서 차트를 변경하지 않고자 한다면 "Forex Scanner"는 완벽한 솔루션입니다. "Forex Scanner"를 선택해야 하는 이유는 무엇입니까? 다중 시간대 스캔: "Forex Scanner"는 분 단위에서 시간 단위까지 다양한 시간대에서 시장을 모니터링할 수 있게 해줍니다. 이 도구는 여러 시간 레벨에서 추세 및 거래 신호를 즉시 식별할 수 있도록 도와주며, 완전하고 상세한 시장 뷰에 따라 조치를 취할 수 있게 해줍니다. 다중 지표 통합: 이 지표는 ATR, RSI, 스토캐스틱, ADX, 피벗 및 MA와
Enhanced RSI는 트레이더에게 더 포괄적이고 정확한 시장 분석을 제공하기 위해 설계된 다재다능하고 맞춤화 가능한 기술 지표입니다. 이동 평균, RSI 및 MACD의 최고의 기능을 결합하여 이 지표는 모멘텀과 트렌드 강도에 대한 다차원적 관점을 제공합니다. 주요 특징: 완벽한 하이브리드화: Enhanced RSI는 이동 평균, RSI 및 MACD의 기능을 결합하여 가격 움직임에 대한 보다 완전한 그림을 제공합니다. 최대 유연성: 맞춤화 가능한 기간을 통해 이 지표는 모든 거래 스타일과 시간 프레임에 적응합니다. 다양한 활용: Forex부터 암호화폐, 주식, 지수에 이르기까지 모든 금융 자산에 대해 작동합니다. 분석 지원: Enhanced RSI는 자동 거래 시스템이 아니라 유용한 신호와 확인을 제공하여 기술 분석을 보완하는 도구입니다. 작동 방식: Enhanced RSI는 RSI의 지수 이동 평균을 계산하고 이를 MACD에서 나온 신호와 결합합니다. 그 결과는 과매수 및 과매도
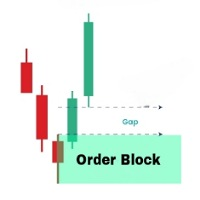
OrderBlock Analyzer는 MetaTrader 4 (MT4)용 맞춤형 지표로, 가격 차트에서 Order Block을 감지하고 강조 표시하는 데 도움을 줍니다. 이 지표는 중요한 시장 구조를 식별하고, 추세 반전이나 연속성이 있을 수 있는 영역을 표시합니다. OrderBlock Analyzer는 시장의 움직임을 기반으로 자동으로 Order Block을 그리며, 강세 및 약세 블록을 서로 다른 색상으로 구분합니다. 주요 특징: 강세 및 약세 Order Block 감지 및 표시 차트에서 Order Block의 실시간 업데이트로 거래 기회를 빠르게 식별 Order Block 및 그 외곽선의 색상, 선 스타일 및 두께 조정 가능 외곽선의 색상 및 두께 유연하게 설정 가능 이 지표는 추세 및 반전 기반의 거래 전략을 사용하는 모든 유형의 거래자에게 적합합니다.
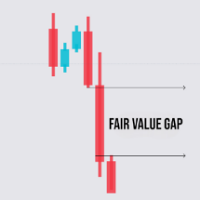
FVG Analyzer 는 MetaTrader 4를 위한 맞춤형 지표로, 가격 차트에서 공정 가치 간격(Fair Value Gaps, FVG)을 감지하고 강조 표시하는 데 사용됩니다. 이 도구는 가격 간격이 있는 영역을 식별하고, 이러한 간격을 기반으로 잠재적인 거래 기회를 제공합니다. 주요 기능: FVG 감지 : 강세 FVG : 다음 캔들의 최고가가 이전 캔들의 최저가보다 낮을 때, 상승 갭을 감지합니다. 약세 FVG : 다음 캔들의 최저가가 이전 캔들의 최고가보다 높을 때, 하락 갭을 감지합니다. 강조 표시 : 차트에 색상으로 표시된 사각형을 그려 FVG를 나타냅니다. FVG가 완전히 채워지면 색상을 변경하는 옵션이 제공됩니다. FVG 내에 시각적 지원을 위한 선을 표시하며, 선의 색상, 두께 및 스타일을 조정할 수 있습니다. 설정 가능한 매개변수 : 캔들의 수 : FVG 감지에 사용될 캔들의 수를 정의합니다. 최소 FVG 너비 : 감지할 FVG의 최소 너비를 정의합니다(포인트
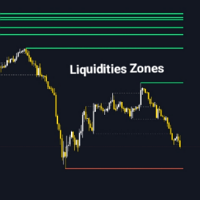
Liquidity Zone Detector는 ZigZag 지표를 사용하여 시장의 주요 유동성 존을 식별하고 강조하기 위해 설계된 고급 기술 지표입니다. 이 도구는 ZigZag에 의해 감지된 고점과 저점에 트렌드 라인을 그려서 중요한 유동성이 존재할 가능성이 있는 가격 수준을 찾습니다. Liquidity Zone Detector는 유동성의 축적 또는 방출을 기반으로 반전 또는 추세 지속 가능성이 있는 영역을 식별하는 데 도움을 줍니다. 주요 기능: 자동 유동성 존 식별 : ZigZag 지표에 의해 식별된 고점과 저점에 트렌드 라인을 그립니다. 고급 사용자 정의 : 유동성 라인의 색상, 두께 및 스타일을 조정할 수 있는 설정. 동적 색상 변경 : 유동성 수준이 도달했을 때 라인의 색상을 변경하는 옵션. 조정 가능한 ZigZag 매개변수 : 더 정확한 감지를 위해 ZigZag의 깊이, 편차 및 백스텝을 조정할 수 있습니다. Liquidity Zone Detector는 시장 구조를 분석하고
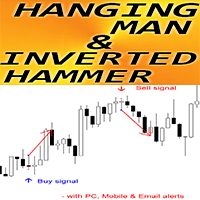
MT4용 외환 지표 "Hanging Man 및 역 망치 패턴"
지표 "Hanging Man 및 역 망치 패턴"은 가격 액션 거래에 매우 강력한 지표입니다. 다시 칠하거나 지연할 필요가 없습니다. 지표는 차트에서 강세 역 망치 패턴과 약세 행잉 맨 패턴을 감지합니다. 강세 역 망치 - 차트에 파란색 화살표 신호(그림 참조) 약세 행잉 맨 - 차트에 빨간색 화살표 신호(그림 참조) PC, 모바일 및 이메일 알림이 포함되어 있습니다. 지표 "Hanging Man 및 역 망치 패턴"은 지지/저항 수준과 결합하기에 매우 좋습니다.
// 더 많은 전문가 자문가 및 지표는 여기에서 확인할 수 있습니다. https://www.mql5.com/en/users/def1380/seller 이 MQL5 웹사이트에서만 제공되는 오리지널 제품입니다.
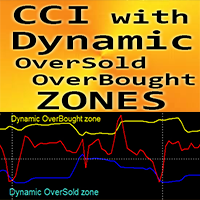
MT4용 외환 지표 "동적 과매도/과매수 구역이 있는 CCI"
상품 채널 지수(CCI)는 추세 방향으로 모멘텀 거래를 하는 데 매우 좋습니다. 동적 과매수 구역에서 매도 진입을 하고 동적 과매도 구역에서 매수 진입을 주요 추세 방향으로 하는 데 매우 좋습니다. 이 지표는 가격 액션 진입과 결합하는 데도 매우 좋습니다. 동적 과매수 구역 - 노란색 선 위 동적 과매도 구역 - 파란색 선 아래 CCI 오실레이터는 현재 가격과 과거 평균 가격의 차이를 측정합니다. ..................................................................................................................................................... // 더 많은 훌륭한 전문가 자문가와 지표는 여기에서 확인할 수 있습니다: https://www.mql5.com/en/users/def1380/seller 이
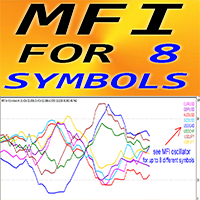
MT4용 외환 지표 "8개 심볼에 대한 MFI"
자금 흐름 지수(MFI)는 가격과 거래량 데이터를 사용하여 과매도 및 과매수 구역을 식별하는 기술적 오실레이터입니다. MFI가 80 이상일 때 과매도에서 매도 진입을 취하고 20 미만일 때 과매도에서 매수 진입을 취하는 것이 좋습니다. MFI는 분기 감지에 매우 유용하며 가격 액션과 결합하는 것도 좋습니다. "8개 심볼에 대한 MFI"는 단 하나의 차트에서 최대 8개의 다른 심볼에 대한 MFI 값을 제어할 수 있는 기회를 제공합니다. MFI 오실레이터는 강세 및 약세 가격 모멘텀에 대한 정보를 제공합니다.
// 더 많은 훌륭한 전문가 자문가 및 지표는 여기에서 확인할 수 있습니다. https://www.mql5.com/en/users/def1380/seller 이것은 이 MQL5 웹사이트에서만 제공되는 오리지널 제품입니다.
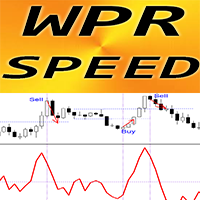
MT4용 외환 지표 "WPR SPEED" - 훌륭한 예측 도구!
이 지표의 계산은 물리학의 방정식을 기반으로 합니다. WPR SPEED는 WPR 오실레이터 자체의 1차 도함수입니다. WPR SPEED는 횡보 및 평탄 시장에서 스캘핑 진입에 적합합니다. WPR SPEED 지표는 WPR 자체가 방향을 얼마나 빨리 변경하는지 보여줍니다. 매우 민감합니다. WPR SPEED 지표는 모멘텀 스캘핑 거래 전략에 사용하는 것이 좋습니다. 지표의 큰 크기 피크를 찾습니다. 반대 방향으로 스캘핑 거래를 시작합니다(그림 참조). 지표에는 모바일 및 PC 알림이 내장되어 있습니다.
// 더 많은 훌륭한 전문가 고문 및 지표는 여기에서 확인할 수 있습니다. https://www.mql5.com/en/users/def1380/seller 이 MQL5 웹사이트에서만 제공되는 오리지널 제품입니다.
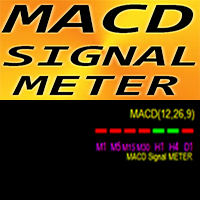
MT4용 Forex Indicator MACD Signal METER
매우 유용한 MACD Signal METER 지표는 7개 시간 프레임에 대한 현재 MACD 값(신호 위/아래)을 동시에 보여줍니다. 녹색 상자 - MACD가 신호 위에 있음 빨간색 상자 - MACD가 신호 아래에 있음 Forex Indicator MACD Signal METER는 다중 시간 프레임 거래를 위한 거래 진입 필터로 사용할 수 있습니다. ............................................................................................................................................... // 더 훌륭한 전문가 자문가와 지표는 여기에서 확인할 수 있습니다: https://www.mql5.com/en/users/def1380/seller 이 MQL5 웹사이트에서만 제공되는 오리지널 제품입니다.
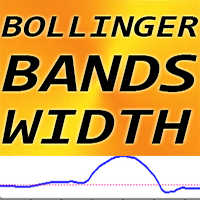
MT4용 Forex Indicator Bollinger Bands Width, No Repaint.
-BB Width 지표는 표준 Bollinger Bands 지표와 함께 사용하는 데 적합합니다. -이 소프트웨어는 모든 Bollinger Bands 지표 팬에게 필수입니다. 왜냐하면 이 두 지표의 조합은 브레이크아웃을 거래하는 데 매우 효율적이기 때문입니다. -BB Width 지표는 Bollinger Bands 간의 거리(스팬)를 보여줍니다.
BB Width 사용 방법(그림의 예 참조): 1) 지난 6개월 동안 BB Width의 가장 낮은 값을 찾고 이 값에 25%를 더하여 LEVEL을 구합니다. 2) BB Width 지표에 LEVEL을 첨부합니다. 또한 Bollinger Bands 지표를 차트에 첨부합니다. 3) 가격이 Bollinger Bands 지표 경계와 BB 폭 값 사이에 평평하게 고정될 때까지 기다리면 LEVEL 아래에 있습니다. 4) Bollinger Bands
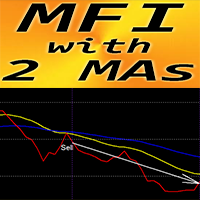
MT4용 외환 지표 "MFI 및 2개 이동 평균"
자금 흐름 지수(MFI)는 가격과 거래량 데이터를 사용하여 과매도 및 과매도 구역을 식별하는 기술적 오실레이터입니다. "MFI 및 2개 이동 평균" 지표를 사용하면 MFI 오실레이터의 빠르고 느린 이동 평균을 볼 수 있습니다. 지표는 매우 일찍 추세 변화를 볼 수 있는 기회를 제공합니다. 매개변수를 통해 이 지표를 설정하는 것은 매우 쉽고, 모든 시간 프레임에서 사용할 수 있습니다. 그림에서 매수 및 매도 진입 조건을 볼 수 있습니다. 매수(매도) 신호 조건: (1)-빠른 MA가 느린 MA를 위로(아래로) 교차, (2)-빨간색 MFI 선이 빠른 MA 위(아래)에 있음, (3)-빨간색 선이 노란색 MA에 가까이 다가감, (4)-빨간색 선이 노란색 선에서 위로(아래로) 반등, (5)-매수(매도) 후크가 방금 형성됨 - 여기에서 거래 시작, (6)-중요: MA 다음에 첫 번째 후크만 사용 cross
// 더 훌륭한 전문가 자문가와
Triple SD Osc (Triple synthetic digital oscillator) is a tool that allows you to combine into one whole the readings of three popular indicators simultaneously for a comprehensive analysis of price behavior. The user can select three different oscillators from the list of classic oscillators built into the MT4 trading platform and configure each of them separately. The indicator combines the values of user-selected oscillators and builds a synthetic oscillator based on them. To cut off false s
The Period Breakout Indicator is a versatile tool designed for traders seeking to identify breakout opportunities based on customizable time periods. This indicator automatically determines the highest and lowest prices within a user-defined period, allowing you to tailor it precisely to your trading strategy. Key Features: Customizable Time Periods: Define the start and end times based on your preferred trading hours or any specific period. The indicator will then calculate the highest and low
FREE
A Full Concept of BUY/SELL Scalping Strategy Trend detection is one of the basic challenges of every trader. Finding a way to tell when to enter a trade is very important, timing is a game changer, not too early and not too late. Sometimes, due to not knowing the market conditions, the trader closes his positions with a small profit or allows the losses to grow, these are the mistakes that novice traders make. Indicator Trend Whipper is a complete trading strategy and can improve the trader's tr

!!!The free version works only on "EURUSD"!!! WaPreviousCandleLevels MT4 shows the previous candle levels, it shows the previous candle Open High Low Close levels (OHLC Levels) in different time frame. It's designed to help the trader to analyse the market and pay attention to the previous candle levels in different time frame. We all know that the OHLC Levels in Monthly, Weekly and Daily are really strong and must of the time, the price strongly reacts at those levels. In the technical analys
FREE
Author's implementation of the classic technical analysis indicator Heiken Ashi. This indicator makes it easier to identify a trend and is the basis of many strategies. At its core, the Heiken Ashi (HA) indicator is just a way to construct a price candlestick chart. In the classic version of the indicator, the opening point of the HA candle is the average value between the opening and closing prices of the previous HA candle, and the closing point of the HA candle is the average value between th

Divergence Divergence refers to when the price of a currency pair moves in one direction while the trend indicator is moving in the opposite direction. With divergence, there can be positive and negative signals. Divergences in Forex trading are quite common signals of technical analysis. These are basic early Forex signals indicating the trend reversal and filter false signals. Application of this indicator It is usually not easy to detect divergences by the trader and it may be time-consuming

he "Super Trampoline" is an innovative trading indicator designed to simplify decision-making in financial markets. It analyzes chart data and provides clear and timely signals on when to buy or sell an asset, based on a proven strategy of candlestick pattern analysis. Product Advantages: Intuitive Interface : "Super Trampoline" integrates directly into your trading terminal, displaying signals as simple arrows on the chart. This means you don't need deep technical analysis knowledge to start us

Introducing "Super Transplant with Filter" — a game-changing tool for traders who value precision, reliability, and simplicity. This indicator combines advanced trend analysis techniques with intelligent signal filtering, allowing you to make decisions based on the most relevant data. Benefits of "Super Transplant with Filter": Accuracy in Every Trade : The indicator meticulously analyzes market data, identifying key trends while filtering out false signals. This enables you to make more informe
MACD Indicator The Moving Average Convergence and Divergence (MACD) is a trend following momentum indicator which shows the relationship between two moving averages that we chose and configure them on the indicator. The MACD is calculated by subtracting the 26-period exponential moving average and the 12 period D.A.M. These are the default parameters when you put the MACD indicator on the charts, and the period is usually 9 which means the last 9 candles. DT-Oscillator This is Robert C. Miner's

WaPreviousCandleLevels MT4 shows the previous candle levels, it shows the previous candle Open High Low Close levels (OHLC Levels) in different time frame. It's designed to help the trader to analyse the market and pay attention to the previous candle levels in different time frame. We all know that the OHLC Levels in Monthly, Weekly and Daily are really strong and must of the time, the price strongly reacts at those levels. In the technical analysis, the user can use them as a support and res
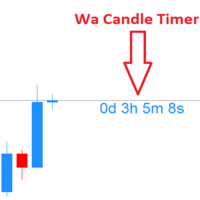
Wa Candle Timer MT4 is an indicator which shows the user how much time is remaining until the next candle will form. When it remains less than 5% before the current candle will be closed, the color of the time changed. These are the settings: 1- Color of Candle Timer when it remains MORE than 5% percentage of current bar to be closed. 2- Color of Candle Timer when it remains LESS than 5% percentage of current bar to be closed. 3- Candle Timer Font Size. 4- Candle Timer font (e.g.: "Arial").
FREE
Scalping Strategy BUY SELL
Having a strategy in the market is one of the main conditions for trading. The presence of various and complicated indicators and tools sometimes makes trading difficult, and the user gets confused after trying various methods and gets stuck in a loss cycle, the result of which is usually clear. This indicator is a simple strategy based on the detection of pivots and short-term trends, which helps you to easily trade in trends. Sometimes a simple but efficient st

The indicator monitors price movements in relation to a dynamic trailing stop line derived from the Average True Range (ATR). The trailing stop line adjusts based on market volatility, with the ATR determining the distance of the stop from the current price. This allows the stop to widen during periods of high volatility and tighten during calmer market conditions. The indicator tracks how the price interacts with this trailing stop line, marking potential reversal points when the price crosses
FREE

The indicator defines the buy and sell arrows with high performance and consistent results. Suitable for trend trading or following the trend. Automatic analysis of market opportunities ; Help traders earn more from their investments;
Never repaints, recalculates or backpaints signals; This is FREE demo version of the indicator and works only on "GBP USD M5" . The demo version does not work on SUFFIX OR PREFIX brokers ! Forex Trend Commander All details about the indicator here :
FREE

This indicator/dashboard , is place on a single symbol. It shows the percentage of movement withing all time frames from M1 to W1.The text will change green if all % are in the positive for a buy signal.The text will change red if all % are below zero and in negative for a sell signal. There are audible notifications, as well as on screen notifications along with push notifications that can be turned on and ON/OFF in the settings.
This is a sure way to Find trends quickly and efficiently, with
Доброго времени суток.
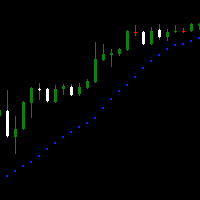
Вашему вниманию простой, но крайне удобный продукт для любителей индикатора Parabolic SAR . Он представляет собой окно осциллятора, на который выводится несколько тайм-фреймов в режими реального времени вместе с индикатором.
Настройки интуитивно понятные, что бы включать и отключать количество выбранных таймов - необходимо применять PERIOD_CURRENT, в таком случае дополнительный тайм не откроется.
Пишите в комментариях к продукту, что бы вы хотели увидеть в новых вер
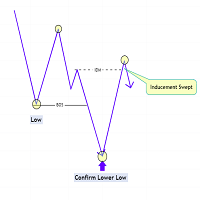
The Market Structure with Inducements & Sweeps indicator is a unique take on Smart Money Concepts related market structure labels that aims to give traders a more precise interpretation considering various factors.
Compared to traditional market structure scripts that include Change of Character (CHoCH) & Break of Structures (BOS) -- this script also includes the detection of Inducements (IDM) & Sweeps which are major components of determining other structures labeled on the chart.
SMC &
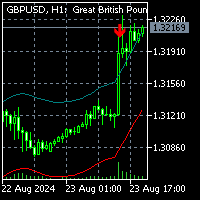
To get access to MT5 version click here . This is the exact conversion from "Nadaraya-Watson Envelope" by " LuxAlgo ". (with non-repaint input option) This is not a light-load processing indicator if repaint input is set to true . All input options are available. Buffers are available for processing in EAs. I changed default input setup to non-repaint mode for better performance required for mql market validation procedure . Here is the source code of a simple Expert Advisor operating

MT4 is a Histogram version of MT5: https://www.mql5.com/en/market/product/122151 Introducing Trade Sniper: Your Edge in the Markets. Tired of missing profitable trades or getting caught on the wrong side of the market? Meet Trade Sniper, the cutting-edge indicator that harnesses the power of trends to give you a razor-sharp advantage in your trading. Trend Sniper is not just another run-of-the-mill indicator. It's a sophisticated tool that combines advanced algorithms with time-tested trading

Session Standard Deviation Date Range Analyzer: Evaluate the standard deviation of each bar's price (high, low, close, open, weighted, median, and typical) within defined trading sessions and date ranges, providing detailed insights into price volatility and market behavior. **Note:** When the trading platform is closed, the indicator may not load correctly. To ensure it works, you may need to load the indicator, unload it, and then load it again. **Note:** This indicator can only be used with
FREE
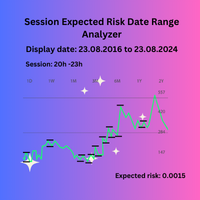
Session Expected Risk Date Range Analyzer: Analyzes price data across specified date ranges to provide detailed insights into financial risk and volatility, using each bar's price metrics for accurate risk assessment.
The Session Expected Risk Date Range Analyzer is a sophisticated tool designed to offer traders and analysts detailed insights into the expected financial risk across specific date ranges. Unlike traditional session-based analysis, this indicator focuses on calculating risk met
FREE
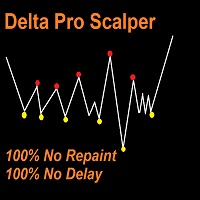
Delta Pro Scalper - Your Ultimate Trend Trading Solution, Delta Pro Scalper is a TREND indicator that automatically analyzes the market and provides information about the trend without redrawing or delay.
The indicator uses candlestick OHLC data and analyzing them to determine up trend or down trend, You MUST wait till closing candle, once the dot appear the next open candle you can open buy or sell position. Red Dot = Bearish Trend (Open SELL)
Yellow Dot = Bullish Trend (Open BUY) Here's th

Выпадающее меню для трендовых линий и прямоугольника. Позволяет редактировать цвет, стиль и толщину. При выделении линии появляется меню, каждая функция разделена. Можно сразу нажать и поменять на нужное. Толщина меняется по другому, нужно нажать на цифру, она станет в синем цвете, нажать нужную цифру от 1 до 4, в зависимости от нужной толщины, нажать интер.

MACDneun gajang ingi issneun momenteom mich chuse jipyo jung hanaibnida. tonghwa gangdo cheugjeong-gineun yeoleo tonghwaleul giban-eulo haneun chuse jipyoigido habnida. MACD tonghwa gangdo cheugjeong-gineun MACD mich tonghwa gangdo cheugjeong-giui algolijeum-eul gajin hanaui chateu jipyoibnida. ttohan won keullig gineung-i iss-eo daesibodeue 28gaeui juyo ssang-gwa bojo ssang-i pyosidoemyeo teugjeong ssang-eul keullighamyeon chateuga jadong-eulo seontaeghan chateulo byeongyeongdoebnida. jepum ja

Indicator Waiting Volatility - an indicator for determining volatility zones and flat conditions.
Over time, the price on the chart is in different trends, goes down, goes up, or stays the same. The indicator helps the trader determine which trend the price is in.
In its work, it uses several tools for technical analysis; first, the direction of the trend is determined, then, in this direction, the indicator monitors changes in volatility.
If the price fluctuates within the noise, it is in tr

SENSE는 선택된 GANN 방식과 프랙탈 계산을 결합한 자동화된 시스템입니다. 이 시스템은 거래를 개시하고 청산할 위치를 알려줍니다. 더 이상 복잡한 계산에 시간을 낭비할 필요가 없습니다. SENSE가 모든 것을 알아서 해줍니다. 인디케이터를 설치하기만 하면 됩니다.
기본 원칙:
가격이 흰색 선 위에 있으면 시장은 강세입니다.
흰색 선 위에서 매수, 아래에서 손절 녹색 선은 상승 목표 가격이 흰색 선 아래에 있으면 시장은 약세입니다.
흰색 선 아래에서 매도, 그 위에 스톱 빨간색 선은 하락 목표 녹색 또는 빨간색 이중선은 강세 구간을 나타냅니다.
왜 센스인가?
수익 목표: SENSE는 자동으로 이익 실현 목표를 설정하여 트레이딩 성공을 극대화할 수 있도록 도와줍니다. 자동 적응: 인디케이터는 모든 차트주기에 대해 자동으로 다시 계산하여 수동으로 조정할 필요 없이 정확하고 신뢰할 수 있는 신호를 제공합니다.
스캘핑에도 좋습니다.
데모를 확인해 보세요

트렌드 트레이딩의 힘을 마스터하세요
이 지표는 초보자, 중급자, 전문가 트레이더 모두를 위해 설계되었습니다. 모든 통화 쌍에서 실제 트렌드를 정확하게 감지하여 트레이딩 프로세스를 단순화합니다.
왜 이 지표를 선택해야 할까요?
- 간단한 거래: 더 이상 복잡한 분석이 필요하지 않습니다. 지표를 차트에 로드하고 매수 또는 매도 신호를 기다리기만 하면 됩니다. 하루 종일 차트를 볼 필요가 없습니다. - 명확한 진입 신호: 지표는 매수 신호에 파란색 화살표, 매도 신호에 빨간색 주황색 화살표를 제공하여 정확한 진입 포인트를 제공합니다. 또한, 트렌드 라인은 현재 시장 트렌드를 확인하기 위해 색상이 변경됩니다. - 이상적인 타임프레임: 최상의 결과를 얻으려면 5분 타임프레임을 사용하는 것이 좋습니다. H1 타임프레임으로 지표를 다시 로드하여 신호를 확인하면 더 정확한 데이터를 얻을 수 있습니다. - 스캐너와 함께 사용 시 더욱 강력해집니다: 내장된 스캐너를 사용하여 모든 통화 쌍
Follow Line 지표는 시장 트렌드를 정확하게 식별하고 따라가는 트레이더에게 필수적인 도구입니다. 이 지표는 가격 변동에 따라 동적으로 조정되며, 가격 움직임을 매끄럽고 지속적으로 추적하는 선을 그립니다. 시각적으로 단순하고 트렌드 변화를 신호하는 데 효과적인 Follow Line은 모든 트레이더의 전략에 훌륭한 추가 요소가 됩니다. 주요 특징: 트렌드 추적: Follow Line은 가격을 면밀히 추적하여 트레이더가 진행 중인 시장 트렌드를 쉽게 식별할 수 있도록 합니다. 시각적 단순성: 명확하고 잘 정의된 선으로, 경험이 적은 트레이더도 시장 방향을 빠르게 이해할 수 있습니다. 적응성: 다양한 시간대와 도구에서 작동하여, 데이 트레이딩에서 스윙 트레이딩까지 다양한 거래 전략에 이상적입니다. 사용 방법: 설치: 분석하려는 금융 상품의 차트에 Follow Line 지표를 추가합니다. 설정: 거래 전략에 맞게 지표의 매개변수를 조정합니다. 트렌드 분석: Follow Line 선을
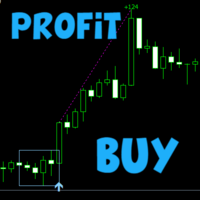
Scalper Box MT4
Fully ready strategy for trading on all markets (Stocks, Futures, Forex and Cryptocurrencies).
Indicator signals are not repaint!!!
Discounted price - 50$ (2 copies only) The next price is 99$
How to trade?
Wait for a signal from the indicator Scalper Box MT4 (blue arrow - buy, red arrow - sell).
After the signal we immediately enter the market, SL set behind the formed box.
Using trend filter indicator and template
Recommended timeframe:
M5 - Ideal for Sca
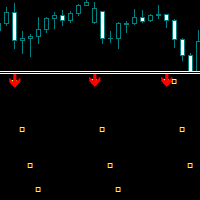
A technical indicator designed specifically for scalping, which can determine volatility impulses and show their duration.
It has flexible parameters for manual adjustment, allowing you to apply the indicator functionality to any trading instrument.
Recommended time frames for use are M5, M15, M30, H1 and H4.
There are several types of alerts.
All signals never change or repaint at the close of the candle.
The indicator is configured by parameters from top to bottom.
Trend Length - Spec

폭탄 은행 신호: MetaTrader 4의 신뢰도 지표
Bomb Bank Signal은 금융 시장에서 가장 관련성이 높은 추세를 식별하도록 설계된 MetaTrader 4의 강력한 지표입니다. 움직임을 정확하게 예측하는 도구를 찾고 있다면 Bomb Bank가 바로 여러분에게 필요한 동맹입니다.
작동 방식:
이 지표는 거래량 분석, 양초 종가, 대칭 추세 등 세 가지 방법을 결합하여 매수 및 매도 기회를 감지하고 신호를 보냅니다. Bomb Bank는 매수 기회를 포착할 때는 '폭탄'과 같고, 매도 신호를 감지할 때에는 '해골'과 같습니다.
폭탄 은행은 왜 다른가요?
완전한 신뢰성: 폭탄 은행 신호는 신호를 제거하지 않습니다. 일단 신호가 발행되면 그 신호는 계속 유지되므로 기회를 절대 놓치지 않습니다. 극도의 정확성: Bomb Bank는 잘못된 신호를 보내지 않습니다. 시장이 발전함에 따라 조정하면서 실시간으로 업데이트하지만 이전 신호의 투명성은 유지합니다. 실시간

This indicator is not a guarantee of profitability but is designed to provide valuable insights and reduce the time spent analyzing charts, allowing you to focus on what matters most—your time.
The "Candle Info" indicator is designed to analyze and display specific candle formations directly on the chart within MetaTrader 4 (MT4). The indicator provides traders with visual cues about market sentiment by identifying various candle formations, such as Higher Highs, Lower Lows, Higher Lows, and
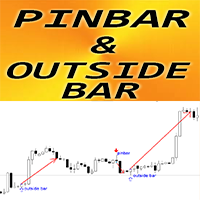
MT4용 외환 지표 "핀 바 & 아웃사이드 바 패턴"
지표 "핀 바 & 아웃사이드 바 패턴"은 가격 액션 거래에 매우 강력합니다. 지표는 차트에서 핀 바와 아웃사이드 바 패턴을 감지합니다. 상승 패턴 - 차트에 파란색 화살표 신호(그림 참조) 하락 패턴 - 차트에 빨간색 화살표 신호(그림 참조) 다시 칠하지 않음; 지연 없음; PC, 모바일 및 이메일 알림 지표 "핀 바 & 아웃사이드 바 패턴"은 지원/저항 수준과 결합하기에 매우 좋습니다. ................................................................................................................................................... // 더 많은 훌륭한 전문가 고문 및 지표는 여기에서 확인할 수 있습니다. https://www.mql5.com/en/users/def1380/seller 이 MQL5 웹사이트에서
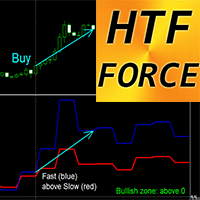
MT4용 Forex Indicator HTF Force Oscillator
HTF Force는 다중 시간 프레임 거래를 위한 강력한 지표입니다. HTF는 - Higher Time Frame을 의미합니다. Force 지수는 가격과 거래량 데이터를 단일 값으로 결합하는 최고의 지표 중 하나입니다. High 시간 프레임의 값은 추세 방향을 보여줄 수 있습니다(하락 추세 - 0 아래; 상승 추세 - 0 위) Fast Force - 파란색 선, Slow Force - 빨간색 선 매수 신호 - Fast 선이 Slow 선을 위로 교차하고 둘 다 - 0 위(그림 참조) 매도 신호 - Fast 선이 Slow 선을 아래로 교차하고 둘 다 - 0 아래(그림 참조) 지표에는 모바일 및 PC 알림이 내장되어 있습니다.
// 더 훌륭한 전문가 자문가와 지표는 여기에서 확인할 수 있습니다: https://www.mql5.com/en/users/def1380/seller 이 MQL5 웹사이트에서만 제공
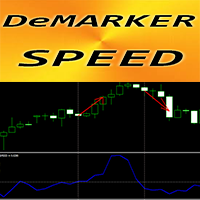
MT4용 외환 지표 "DeMarker Speed"
이 지표의 계산은 물리학의 방정식을 기반으로 합니다. DeMarker Speed는 DeMarker 자체의 1차 도함수입니다. DeMarker 오실레이터 곡선은 지표 계산 기간 동안 이전 최고가와 최저가에 대한 현재 가격 위치를 나타냅니다. DeMarker Speed는 표준 DeMarker 오실레이터가 과매도/과매수 구역(그림 참조)에 있을 때 스캘핑 진입에 적합합니다. DeMarker Speed 지표는 DeMarker 자체가 방향을 얼마나 빨리 변경하는지 보여줍니다. 매우 민감합니다. DeMarker Speed 지표의 값이 < 0이면 속도는 음수입니다. DeMarker Speed 지표의 값이 > 0이면 속도는 양수입니다. 지표에는 모바일 및 PC 알림이 내장되어 있습니다.
// 더 훌륭한 전문가 자문가와 지표는 여기에서 확인할 수 있습니다. https://www.mql5.com/en/users/def1380/sel
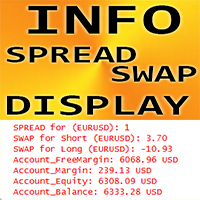
MT4, 트레이딩 지원 도구용 외환 지표 "INFO 스프레드 스왑 디스플레이".
INFO 스프레드 스왑 디스플레이 지표는 부착된 외환 쌍의 현재 스프레드와 스왑을 표시합니다. 또한 계정 잔액, 자본 및 마진을 표시합니다. 차트의 어느 모서리에서나 지표 값을 찾을 수 있습니다. 0 - 왼쪽 상단 모서리, 1 - 오른쪽 상단, 2 - 왼쪽 하단, 3 - 오른쪽 하단 색상과 글꼴 크기도 설정할 수 있습니다. ............................................................................................................................................... // 더 훌륭한 전문가 자문가와 지표는 여기에서 확인할 수 있습니다. https://www.mql5.com/en/users/def1380/seller 이것은 이 MQL5 웹사이트에서만 제공되는 오리지널 제품입니다.
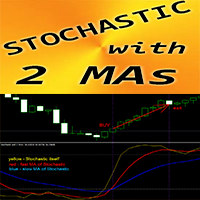
MT4용 외환 지표 "확률 및 2개 이동 평균"
스토캐스틱 오실레이터는 시장 최고의 지표 중 하나입니다. 많은 트레이더에게 완벽한 도구입니다. "스토캐스틱 및 2개 이동 평균" 표시기를 사용하면 스토캐스틱 오실레이터의 빠르고 느린 이동 평균을 볼 수 있습니다. 과매수 구역 - 80 이상; 과매도 1 - 20 미만 80 영역 이상에서 매도 항목을 가져오고 20 영역 미만에서 구매 항목을 가져오는 것이 좋습니다. 매수, 매도 진입 조건은 사진에서 확인하실 수 있습니다 매수(매도) 신호 조건을 고려하십시오. (1) -과매도(overBought)에서 빠른 MA가 느린 MA를 상향(하향) 교차합니다. 매수(매도) 거래 개시 (2) -확률적 가치는 과매수 영역에서 빠른 MA를 하향 교차합니다(과매도 영역에서 빠른 MA를 상향 교차): 매수(매도) 거래 종료
// 더 훌륭한 전문가 자문 및 지표는 여기에서 확인할 수 있습니다: https://www.mql5.com/en/users/def

MT4에 대한 외환 지표 "지원 저항 수준"
지표 "지원 저항 수준"은 거래에 매우 유용한 보조 지표입니다. '지지'와 '저항'은 차트에서 가격으로 존중되는 중요한 영역입니다. 지지 수준은 가격이 정기적으로 하락을 멈추고 다시 반등하는 수준입니다. 저항 수준은 일반적으로 가격이 상승을 멈추고 다시 하락하는 지점입니다. 표시기 "지원 저항 수준"은 최근 수준을 보여줍니다. 저항 수준 - 빨간색 선. 지원 수준 - 파란색 선 계산에 사용되는 막대 수, 선 유형 및 색상은 설정에서 조정할 수 있습니다. 지표 "지원 저항 수준"은 가격 조치 패턴을 통해 이익실현 목표, 가격 반전 및 재테스트를 계획하는 데 유용합니다.
// 더 훌륭한 전문가 자문 및 지표는 여기에서 확인할 수 있습니다: https://www.mql5.com/en/users/def1380/seller MQL5 홈페이지에서만 제공되는 오리지널 제품입니다.

YOU CAN NOW DOWNLOAD FREE VERSIONS OF OUR PAID INDICATORS . IT'S OUR WAY OF GIVING BACK TO THE COMMUNITY ! >>> GO HERE TO DOWNLOAD
V1 Scalper is an easy to use tool designed for trend scalping. It tries to spot good entry points in a major trend by using swing high and lows formed along the trend . This tool can be used on Fx Pairs , Indices , Commodities and stocks. Not often but in some signals , the arrow might repaint on the current candle so extra confirmation tools are advised for t
FREE
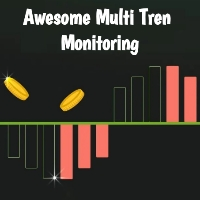
This indicator was created based on a multi-time trend monitoring system by combining several trend signals into 1 signal in the panel. This indicator is also equipped with an alert feature. Try to master how to reveal Fibo Weasel Candle Break Reetes to make it easier to use this indicator. for entry we only monitor the signal in the top left corner for the ongoing trend as a trading reference For the risk reward reference, we use the Fibo Weasel withdrawal reference which is in the same direct
FREE

Platone Breakout SMC - Advanced Trading Indicator Overview The Platone Breakout SMC is an innovative and powerful MetaTrader 4 (MT4) indicator designed for traders who seek to capitalize on smart money concepts (SMC) and breakout trading strategies. This indicator provides precision in identifying breakout levels, session times, and profit targets, ensuring that traders can execute well-informed trades with confidence. Trading Logic The core of the Platone Breakout SMC is its ability to identif
FREE
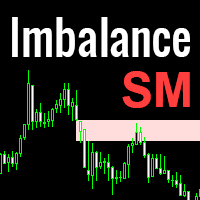
Imbalance is one of the important zones on the chart, to which the price will always strive to cover it. It is from the imbalance zone that the market most often makes significant reversals, rollbacks and gives entry points that you can successfully trade. In the Smart Money concept, the imbalance zone is used to find an entry point, as well as a place for take profit at the level of imbalance overlap by the price. Until the imbalance is overlapped, it is the closest target for the price. Ho
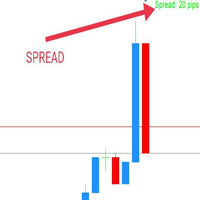
WaSpread MT4 Indicator shows the current spread in pips with color.
* Set the Spread Threshold and the color to identify when the current spread is below or above the Spread Threshold.
* Set X axis and Y axis and chose the Corner and the Anchor to position the Spread Label on the chart.
* Write the font and the font size for more confort.
* Activate alert if the current spread is above the spread threshold.
* For more precision, the user can choose to show the decimal numbers.
* The
FREE
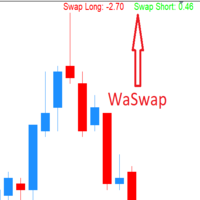
WaSwap MT4 Indicator shows the current Swap Long and current Swap Short with color.
* Set the Swap Threshold and the color to identify when the current swap is below or above the Spread Threshold.
* Set X axis and Y axis and chose the Corner and the Anchor to position the Swap Label on the chart.
* Write the font and the font size for more confort.
* Activate alert if the current Swap Long or the current Swap Short is below the swap threshold.
* The user will never swing with a negati
FREE
This indicator is designed for effective short-term trading and the most aggressive reinvestment of potential profits into new positions. The philosophy of its use involves entering based on the indicator signal and fixing profit/loss as quickly as possible when receiving an opposite indicator signal on an even shorter time period of the chart.
Thus, the algorithm for effectively using the presented indicator is as follows: 1. Wait for a buy/sell signal to appear. The signal appears at the mom

Aristotle Market Profile SMC Indicator: Overview: The Aristotle Market Profile SMC Indicator, is a comprehensive and highly customizable tool designed for traders seeking to integrate Market Profile analysis into their trading strategies. This advanced indicator is built to display the Market Profile across various trading sessions, including intraday, daily, weekly, and monthly periods, offering deep insights into market behavior and price levels over different timeframes. Key Features: Multip
FREE

This indicator works on MT4 and is very easy to use. When you receive a signal from it, you wait for that candle with the signal to close and you enter your trade at the beginning of the next new candle . A red arrow means sell and a green arrow means buy. All arrows comes with Alert like for easy identification of trade signal. Are you okay with that?
1 minute candle
1 minute expire

Adjustable Consecutive Fractals looks for 2 or more fractals in one direction and sends out a on screen alert, sound alert and push notification, for strong reversal points .
Adjustable Consecutive Fractals, shows the fractals on chart along with a color changing text for buy and sell signals when one or more fractals appear on one side of price.
Adjustable Consecutive Fractals is based Bill Williams Fractals . The standard Bill Williams fractals are set at a non adjustable 5 bars, BUT withe

The Binary Profit Maker,
This indicator works on MT4 and is very easy to use. When you receive a signal from it, you wait for that candle with the signal to close and you enter your trade at the beginning of the next new candle . A Up Purple arrow means Buy and a Down Purple arrow means Sell. All arrows comes with Alert like for easy identification of trade signal. Are you okay with that?
How To Enter Trade?
1 minute candle
1 minute expire

Average Session Range MT4: Calculate and Average the Sessions High-Low Range of Specific Time Sessions Over Multiple Days. The Session Average Range is a sophisticated and precise tool designed to calculate the volatility of specific time sessions within the trading day. By meticulously analyzing the range between the high and low prices of a defined trading session over multiple days, this tool provides traders with a clear and actionable average range. **Note:** When the trading platform is cl
FREE
123456789101112131415161718192021222324252627282930313233343536373839404142434445464748495051525354555657585960616263646566676869707172737475767778798081828384858687888990919293949596979899100101102103104105106107108109110111112113114115116117118119120121122123124125126127128129130131132133134135136137138139140
MetaTrader 플랫폼 어플리케이션 스토어에서 MetaTrader 마켓에서 트레이딩 로봇을 구매하는 방법에 대해 알아 보십시오.
MQL5.community 결제 시스템은 페이팔, 은행 카드 및 인기 결제 시스템을 통한 거래를 지원합니다. 더 나은 고객 경험을 위해 구입하시기 전에 거래 로봇을 테스트하시는 것을 권장합니다.
트레이딩 기회를 놓치고 있어요:
- 무료 트레이딩 앱
- 복사용 8,000 이상의 시그널
- 금융 시장 개척을 위한 경제 뉴스
등록
로그인
계정이 없으시면, 가입하십시오
MQL5.com 웹사이트에 로그인을 하기 위해 쿠키를 허용하십시오.
브라우저에서 필요한 설정을 활성화하시지 않으면, 로그인할 수 없습니다.