MetaTrader 4용 새 기술 지표 - 46

Indicator Statistics MultiPairs for MT4 1. Current Openning Ords - Symbols Openning + Buy Orders + Buy Volume + Sell Orders +Sell Volume - DrawDown by Symbols - Floating by Symbols 2. Closed Orders - Statistics by Today, Week, Month, YTD and Volume - Sum of Closed Orders by Symbol 3. Statistics by Day - Statistics by Say and Volume 4. DrawDown by Day - Each day DrawDown in Week - Percent of DrawDown Contact me at Telegram @MaiMew68

비교할 수 없는 공정가치 갭 MT4 지표(FVG)로 전에 없던 거래를 경험해보세요.
동급 최고로 평가받고 있습니다. 이 MQL5 시장 지표는 평범함을 넘어
트레이더들에게 시장 동향에 대한 탁월한 수준의 정확성과 통찰력을 제공합니다. EA 버전: WH Fair Value Gap EA MT4
SMC 기반 지표: WH SMC Indicator MT4 특징:
동급 최고 공정가치 갭 분석. 다중 시간대 지원. 맞춤형. 실시간 알림. 사용자 친화적 완벽함 원활한 호환성 이익:
비교할 수 없는 정밀성: 가장 뛰어난 공정가치 갭 지표를 손쉽게 파악할 수 있다는 사실을 알고 자신감을 가지고 결정을 내리세요. 최적화된 위험 관리: 자산의 실제 공정가치를 활용해 시장 조정을 파악하고 탁월한 정확성으로 위험을 관리합니다. 최고의 다재다능함: 데이 트레이딩, 스윙 트레이딩, 장기 투자 등 원하는 거래 스타일에 맞춰 지표를 맞춤 설정하세요. 다양한 시간대와 상
FREE
이 VWAP은 간단한 VWAP이지만 가격이 VWAP 라인에 도달하거나 VWAP 라인을 통과 할 때 알리는 알림이 통합되어 있습니다. 이 지표는 MetaTrader 4 (MT4)용 전통적인 VWAP 지표입니다. 기본 매개 변수는 일반적인 VWAP과 동일하지만 VWAP 계산 및 최적화를 수행할 수 있습니다. 가격이 VWAP에 닿거나 VWAP을 통과 할 때 경고, 휴대 전화 알림, 이메일 또는 소리 이벤트로 알림을받을 수 있습니다. MetaTrader 4용 VWAP 고정 지표 . 매개 변수: VWAP 주기 VWAP은 특정 시간 범위 내에서 계산됩니다. 전통적인 VWAP은 매일 새로운 분석을 시작하지만이 지표에서는이 옵션이 기본으로 제공되며 VWAP을 계산하기 위해 원하는 기간을 선택할 수 있습니다. 이는 M1에서 작동하더라도 H1에 대한 VWAP 계산을 시각화할 수 있음을 의미하며 H1에서의 각 새로운 막대에서 갱신됩니다. 이 계산 재시작은 선택한 시간 주기에 따라 발생합니다. 그러나 현
FREE

IX Power: 지수, 원자재, 암호화폐 및 외환 시장 통찰력을 발견하세요 개요
IX Power 는 지수, 원자재, 암호화폐 및 외환 시장의 강도를 분석할 수 있는 다목적 도구입니다. FX Power 는 모든 가용 통화 쌍 데이터를 사용하여 외환 쌍에 대해 가장 높은 정확도를 제공하는 반면, IX Power 는 기초 자산 시장 데이터에만 초점을 맞춥니다. 이로 인해 IX Power 는 비외환 시장에 이상적이며, 다중 쌍 분석이 필요하지 않은 간단한 외환 분석에도 신뢰할 수 있는 도구입니다. 모든 차트에서 매끄럽게 작동하며, 거래 결정을 향상시키기 위한 명확하고 실행 가능한 통찰력을 제공합니다.
1. IX Power가 트레이더에게 유용한 이유 다양한 시장 강도 분석
• IX Power 는 지수, 원자재, 암호화폐 및 외환 심볼의 강도를 계산하여 각 시장에 맞는 통찰력을 제공합니다.
• US30, WTI, 금, 비트코인 또는 통화 쌍과 같은 자산을 모니터링하여 거래 기회를 발견

이 제품은 표시기/신호 도구로부터 정보를 수신하고 특정 조건이 충족되면 화살표 또는 알림을 표시합니다.
예를 들어, MA25와 MA50이 교차할 때, SAR이 반전할 때, MACD가 플러스/마이너스를 변경하거나 종가가 볼린저 밴드를 교차할 때 화살표와 알림이 표시됩니다.
구체적인 구성은 샘플 설정 이미지를 참조하세요.
자세한 매뉴얼 및 구성 파일은 다음을 참조하세요.
https://www.mql5.com/en/blogs/post/755082
무료 버전도 다운로드할 수 있습니다.
화살표는 다양한 구성으로 표시될 수 있으며 조합은 상상만큼 무한합니다.
신호 도구 및 표시기에 대한 연결을 설정하는 데 문제가 있는 경우 당사에 문의하여 도움을 받으십시오.
또한 요청 시 스마트폰, 이메일, Slack, Line, Discord 등에 알림을 푸시하고, 최대 8개의 매개변수를 추가하거나 개별 지표에 연결할 수 있습니다. 신호 도구를 보완하거나 이벤트 알림 기능으로 사용할 수
FREE

The arrow indicator for Forex and Binary options is based on tick volumes. Unlike many volume indicators, the "Super volumes" indicator calculates bullish and bearish volumes and gives signals based on the predominance of any of them. If, say, there was an advantage of bullish volumes in this range at the moment, then the signal will be on Buy. Or if the predominance was bearish volumes, then, accordingly, the signal will be on Sell.
In the indicator settings in the "volumes" variable, you can
The arrow indicator "Create a cool signal" for the Binary options and Forex market is a kind of constructor of its signals! In which you can choose your own signal conditions based on 10 standard MT4 indicators prescribed in it, plus another third-party buffer indicator that you can add to the "buffer indicators" variable.
This is done simply! Prescribe the name of your indicator and prescribe its numbers (you will find them in the colors section where the numbers up to the buffer color are in
The indicator for Forex and Binary options is based on 2 standard indicators in MT4: ADX and RVI.
The signals are received when the lines of both indicators intersect simultaneously. But the reverse of the signals is also written into the codes. This is when the signals are converted in the opposite direction. You can also enable and disable each of the indicators. And also 2 types of signals can be used in RVI: 1) Just when one line is above/below the other (this is good to use as a recoilles

Scalping and Binary Signal Detector - Scalping indicator that gives directional signals for opening positions along the trend.
The indicator is a complete trading system that can be used for Forex and binary options.
The system of algorithms allows you to recognize intense price movements in several consecutive bars.
The indicator provides several types of alerts for arrows.
Works on any trading instruments and time frames (M5 or Higher recommended).
How to use for trading
The appearance of a
The arrow indicator for Binary Options and Forex is a reversal indicator. Created and written on the basis of reversal patterns. It is recommended for Binary Options to put it on the M5 chart. Enter into transactions for 1-3 bars. Depending on the trading sessions, you need to select your expiration time for a different asset.
You can change settings in external variables. Thus, you can both increase and decrease the frequency of signals. The arrows of the indicator do not draw at all. So you

This is a unique Gold Indicator On channel trading pullbacks and gives accurate entries on gold and major Fx Pairs on M15tf. It has the ability to pass any prop firm Challenge and get accurate entries on gold and major fx pairs.
EA FOR PROP FIRM AND CHANNEL INDICATOR IS FREE ALONG WITH THIS POWERFUL INDICATOR ALONG WITH THE BEST SET FILE FOR FIRST 25 USERS. Strategy tester report is in comment section. INDICATOR FEATURES: INDICATOR IS BEST ON M15 GIVES ACCURATE ENTRIES EA AND CHANNEL INDICATO

The arrow indicator "Anaconda LD" is a reversal indicator for the Forex market and mainly for Binary options. The algorithm is written on the basis of reversal patterns. It is better to use it together with other indicators to filter signals. Even with the standard ones in MT4, even with other custom ones. Any channel indicators or level indicators are especially suitable...
You need to select your expiration time for different assets. Which are 1-5 bars on different pairs.

How to trade with a scalping indicator: blue arrow - buy, red arrow - sell. Everything is very simple. The strategy works on all currency pairs. Recommended timeframes: M5, M15, H1, H4. No other indicators are needed for trading. The entire trading strategy is built exclusively on one trading indicator "Click Scalper". This is the latest development of scalping indicators for Metatrader4. Simply place the indicator on the chart of the currency pair and then follow the arrow directions. If a red

About testing Mode: 1.To get the best usage experience please use the tick data to test and adjust the test speed to proper speed (tick price jump quickly but K bars scroll slowly)!!! 2.Click "Indicator Properties"-> Click "Reset" before testing the indicator to restore the default parameters of the indicator.
1. Compound Drawings (1) Line segment with arrow (2) Continuous line segment (broken line) (3) Parallelogram (4) Polygon (5) Profit and loss ratio measurement tools
2. Backtracking

ZeusArrow Smart Liquidity Finder
Smart Liquidity Finder is Ai controlled indicator based on the Idea of Your SL is My Entry. It scan and draws the major Liquidity areas on chart partitioning them with Premium and Discount Zone and allows you find the best possible trading setups and help you decide the perfect entry price to avoid getting your Stop Loss hunted . Now no more confusion about when to enter and where to enter. Benefit from this one of it's kind trading tool powered by Ai an trade

Exclusive Arrival: Presenting for the First Time . This is your secret weapon for predicting which way the wind will blow with the next market shift. It assists you in developing your trading strategy by predicting the direction of the next candle. Compatible with forex, stocks, and cryptocurrencies on all timeframes, but higher timeframes are recommended. MT5 Version - https://www.mql5.com/en/market/product/108937/ How does it work ? It's pretty neat. The algorithm separates green and red can

With the Trend and News indicator you will always be up to date : News + Trends + Forecast
News Displayed on the chart as vertical lines with a description in the form of a tooltip The text displays two news: the previous published and the next expected
They have filters: by importance (High, Medium, Low) and time period (Day, 4 days, Week) Full table of news for a given period (T button)
Controlling the display of vertical lines on the chart and the sound signal before and after the publicati
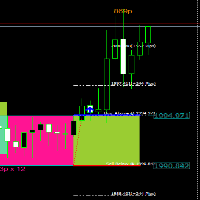
Hi All, " FCK Support Resistance BreakOut " indicator is very simple indicator for new users. You can choose which indicators and timeframes you want to calculate. " FCK Support Resistance BreakOut" that gives NON-REPAINT Buy/Sell signals "FCK Support Resistance BreakOut" provides the trend for buy/sell trades. Opposite side you the stop loss or hedging trade. * - Draws Dynamic S/R Boxes based on consolidation areas; * - consolidation areas are defined by a minimum period of time during whi
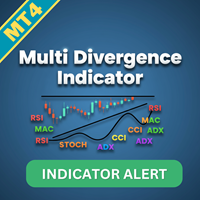
Multi Divergence Indicator for MT4 - User Guide Introduction Overview of the Multi Divergence Indicator and its capabilities in identifying divergences across multiple indicators.
Importance of divergence detection in enhancing trading strategies and decision-making.
List of Indicators RSI
CCI
MACD
STOCHASTIC
AWSOME
MFI
ACCELERATOR
OSMA
MOMENTUM
WPR( Williams %R)
RVI Indicator Features
Indicator Selection: How to enable/disable specific indicators (RSI, CCI, MACD, etc.) for divergence detectio
FREE

A powerful trend analysis tool for traders of all levels Super Trend Analyzer is a technical analysis tool that uses the Relative Strength Index (RSI) and Moving Average (MA) indicators to identify trends in the market. It is a versatile tool that can be used by traders of all levels of experience.
How does it work An uptrend begins when the main trend line and the auxiliary trend line cross from below and the lower minor oscillator is on the rise. A downtrend begins when the main trend line an
FREE
The Finding Average Volume indicator for MetaTrader 4 is a technical analysis tool that calculates the average volume of swing bars. Swing bars are a type of price chart pattern that identifies potential turning points in the market. The indicator is displayed as a zigzag trend line that is bounded by two vertical lines. The average volume is calculated for the entire swing bar pattern. Benefits of Using the Finding Average Volume Indicator Identify potential trend changes: The Finding Average

This indicator cuts right through the price, in a straight line
100% non repaint, you get a new value at the opening of each new bar
It is perfect for mean reversal strategies : open far from the line and close when the price touches the line It works really well for mean reverting pairs specially (CHF, NZD).
It has absolutely no lag when there is a sudden move up or down and follows trend exactly !
This indicator should be a must have tool in the toolbox of every trader

An Implied Fair Value Gap (IFVG) is a three candles imbalance formation conceptualized by ICT that is based on detecting a larger candle body & then measuring the average between the two adjacent candle shadows.
This indicator automatically detects this imbalance formation on your charts and can be extended by a user set number of bars.
The IFVG average can also be extended until a new respective IFVG is detected, serving as a support/resistance line.
Alerts for the detection of bullish/be

Consolidation is when price is moving inside a clear trading range. When prices are consolidated it shows the market maker placing orders on both sides of the market. This is mainly due to manipulate the un informed money. This indicator automatically identifies consolidation zones and plots them on the chart. The method of determining consolidation zones is based on pivot points and ATR, ensuring precise identification. The indicator also sends alert notifications to users when a new consolida

FireArrow is an arrow signal based indicator that give buy and sell signals with tp and sl levels , the indicator gives buy/sell signals with alert on candle close along side tp and sl levels on chart for each signal
this indicator does not repaint/back-paint and signal is not delayed.
Strategy : Open buy same moment buy arrow appear and open sell same moment a sell arrow appear , set tp as drawn on chart along side sl.
Recommended Time frame : 15 and above
this arrow is good as ? : addon t

Indicator ini berdasarkan Gain ADX - Follow Trend - Disertai Pivot, Support & Resistant Daily
Dengan indicator ini semoga menjadikan indicator yang porofit able, selama mengikuti signal yang tampil, apabila berwarna Hijau siap2 untuk Buy, dan berwarna Merah siap2 untuk Sell.
Akan tampil signal Sell/Buy di saat gain mencukupi, baik TF Kecil maupun TF Besar TF Besar / High TF adalah Trend Kuat TF Kecil / Low TF adalah Trend Lemah
Open Posisi pada High TF, signal akan menunjukkan Sell/Buy.
FREE

The TLR indicator is a market trend identification indicator. The idea behind this indicator is to use 3 linear regression lines, one short-term, one medium-term, and one long-term. The UPTREND will be determined when: The long-term linear regression line and the medium-term linear regression line have an uptrend. The long-term linear regression line has an uptrend, the medium-term linear regression line has a sideway, and the short-term linear regression line has an uptrend. The DOWNTREND will
FREE

An integrated analysis system that moves the trader from the random trading stage to professional trading And seeing and understanding the market with one glance instead of moving between different charts and currencies, even in times of high liquidity
It will be easy for you to read the market with our excellent Price Action Expert signals and confirm entry opportunities With accurate analysis tools integrated into our analysis system, which we can work with on a daily basis One of the most i

"추세 반전 ml4"는 가격 반전 순간을 실시간으로 결정하도록 설계된 고유한 지표입니다. 이것은 Metatrader4를 위한 기성 거래 시스템입니다. 표시기는 해당 값을 다시 그리지 않습니다! 고급 알고리즘과 기술적 분석을 기반으로 하는 이 지표는 가능한 시장 진입 및 퇴출 지점에 대한 명확한 신호를 제공하여 정보에 입각한 결정을 내리는 데 도움이 됩니다.
지표의 장점: 높은 신호 정확도. 표시기 자체는 올바르게 구성되었는지 여부를 거래자에게 보여줍니다. 제로 캔들 근처에 표시기가 TOTAL 값을 표시합니다. 값이 음수이면 지표 설정을 조정해야 하며, 값이 양수이면 설정이 올바르게 선택되어 거래를 시작할 수 있습니다. 표시기는 해당 값을 다시 그리지 않습니다. 이 지표는 모든 시간대와 모든 통화쌍에 사용될 수 있습니다. 이것은 기성 거래 시스템입니다.
특징:
반전 화살표: 빨간색 화살표는 판매 거래를 개시할 수 있는 지점을 명확하게 표시하며 향후 가격 하락을 경고합니다. 파란

BUY INDICATOR AND GET EA FOR FREE AS A BONUS + SOME OTHER GIFTS! ITALO TRIANGLE INDICATOR is the best triangle indicator ever created, and why is that? Using Geometry and Fibonacci the Indicator works on all time-frames and assets, indicator built after 7 years of experience on forex and many other markets. You know many triangle indicators around the internet are not complete, does not help, and it's difficult to trade, but the Italo Triangle Indicator is different , the Italo Triangle Indi

on demo mode use date to work. on version 13 wave added.13.1 histogram and trigger line can be changeble. wave can be set 200-500. can have different signal on wave 200 on version 14 ema used.so can see mountly chart signals also. up-down indicator is no repaint and works all pairs and all time frames charts. it is suitable also 1 m charts for all pairs. and hold long way to signal. dont gives too many signals. when red histogram cross trigger line that is up signal.and price probably will down
This automated VOLUME SCALPING INDICATOR can be utilized to manage trades and identify potential areas of support and resistance for both buying and selling. It is designed to identify zones for Sell/Buy trades based on the volume analysis and can be effectively used in conjunction with other indicators, such as order block indicators, and more. Currently designed for MT4, it will later be adapted to function on MT5. We also offer the opportunity to customize the robot according to your trading
FREE

This automated DOJI BAR FINDER INDICATOR can be utilized to manage trades and identify potential areas of support and resistance for both buying and selling. It is designed to identify zones for Sell/Buy trades and can be effectively used in conjunction with other indicators, such as order block indicators, and more. Currently designed for MT4, it will later be adapted to function on MT5. We also offer the opportunity to customize the robot according to your trading strategy.
FREE

With this easy to set up indicator you can display and set alerts for the following candlestick formations: Bull Breakout, Bear Breakout, Hammer, Pin, Bullish Engulfing, Bearish Engulfing. I'd appreciate if you would review the indicator
Input parameters: ShortArrowColor: The color of the Arrows, displaying a Bearish candle formation LongArrowColor: The color of the Arrows displaying a Bullish candle formation BullishEngulfing: Disabled/Enabled/EnabledwithAlert BearishEngulfing: Disabled/Enab
FREE

Check my paid tools they work great and I share Ea's based on them for free please r ate
The Dual Timeframe RSI (Relative Strength Index) indicator is a novel trading tool that allows traders to monitor RSI readings from two different timeframes on a single chart. This dual perspective enables traders to identify potential trend confirmations and divergences more effectively. For instance, a trader might use a 1-hour RSI alongside a daily RSI to ensure that short-term trades align with the broa
FREE

ASR (Accurate Support Resistance) Indicator Uniqe formula behind this indicator makes it one the world's best support resistance indicator. watch the tutorial video
It is user-friendly and here are some key features : -- different calculations for swing traders and scalpers. -- the lower the accuracy number the further the lines distance is. --easily applicable on all charts. ( try to find the best accuracy number ) recommended accuracy number for Gold is 5or 6, for eurusd 6 or 7. other instrum

For some trader's charts analysis use, specially for multi timeframe trading strategies . When you need to check something of the time within different timeframe at the same symbol chart, even different symbol charts, this indicator will show the crosshair at sync moving. You just need to load this indicator into some charts, then the crosshair will shown automatic.
FREE

on demo mode use date to work. indicator is no repaint trend indicator. when red stars up to line that is probably end of long trades. when blue stars up to line that is probably end of down trades. indicator can use all pairs and lower than weekly charts, to use weekly chart need to at least 500 bars data on back.and lowering processing value 500. it is also suitable for 1m charts. indicator hold long way to go. there is not too many signals.

SX Currency Strength indicator allows users to analyze currency strength through a selected period, with results resetting periodically and accumulating thereafter. It displays the historical relative strength of eight major currencies (USD, EUR, GBP, JPY, AUD, CHF, CAD and NZD) across a selected timeframe. Assessing a currency's relative strength aids in evaluating its performance against a basket of other currencies. Users can select to visualize relative strength of the currencies in the shap

This trend reversal arrow indicator has an alert signal that is a valuable tool for forex traders, providing several advantages that contribute to making more informed trading decisions and potentially increasing profits. Here are some advantages: Early Identification of Reversals: The primary advantage is the early identification of potential trend reversals. This arrow indicator can visually signal when a trend may be losing momentum or about to reverse, allowing traders to be proactive rather
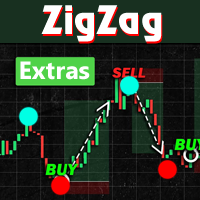
Introducing ZigZag Extras MT4, a Forex indicator that simplifies market analysis:
- Visualizes highest highs and lowest lows over a specified "Depth" period. - Highlights potential reversal points with filled blue and red dots. - Optional display of BreakOut points, indicating probable peaks and bottoms. - Helps avoid common pitfalls of mistaking repainted points for market tops or bottoms. - Designed to enhance understanding and serve as signals for various trading strategies.
Instructions:
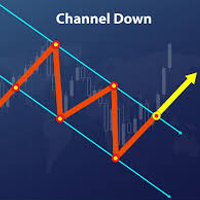
Trend channels are vital tools in technical analysis for identifying optimal buy or sell points. - Upper Line: Marks resistance. - Lower Line: Marks support. - Tops and bottoms of channels indicate potential support or resistance zones. - Bearish Channels: Negative slope (down). - Bullish Channels: Positive slope (up). Creating Channels: - Up Channel: Draw a parallel line matching the uptrend angle, touching the latest peak. - Down Channel: Draw a parallel line ma

What are Heiken Ashi Candles?
Heiken Ashi, derived from the Japanese term 'Heikin Ashi,' translates to average price bars. It's an indicator depicting price bars on a chart.
Formula for Heiken Ashi candles:
- Heiken Ashi opening price: (previous candle's opening + closing price) / 2 - Closing price Heiken Ashi: (opening + high + low + closing) / 4 - Heiken Ashi peak: Max of high, opening, or closing price - Heiken Ashi bottom price: Min of low, opening, or closing price
How to Read Heiken A

The MT4 Channel Standard Deviation Indicator automatically plots support and resistance channels on the price chart using price standard deviation. It indicates BULLISH and BEARISH market conditions and is suitable for both new and advanced forex traders.
This indicator offers support, resistance, entry, and exit levels, along with stop-loss and take-profit points. It accurately identifies BULLISH and BEARISH market trends, making it effective for both intraday and long-term trading across var
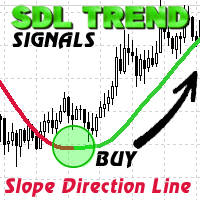
SDL Trend Signals is a custom MQL4 indicator named "Slope Direction Line" for MetaTrader 4. It employs weighted and simple moving averages to create customizable trend lines on charts.
Using two trend line buffers (Uptrend and Downtrend) and one for indicator values (ExtMapBuffer), the indicator calculates trend lines. Bullish slopes appear in BLUE, signaling an upward trend, while Bearish slopes are in RED, indicating a downward trend.
In a Bullish trend, traders can enter a BUY position wit

SURE REVERSAL은 히스토그램 과매수/과매도 유형의 지표로, 강세장 또는 약세장 움직임을 나타내는 주요 반전 지점을 제공합니다 , 이 지표는 이동평균선과 RSI 지표의 융합이며, 비재도장 지표이며, 지연되지 않습니다. 매개변수 : Ma 주기 Ma 방법 Ma 가격 확실한 기간(Rsi) 확정값(Rsi) ============== -----------------------------------------------------------------------------------------------------------------------------------------------------------------------

QualifiedEngulfing - ProEngulfing 지표의 무료 버전입니다. ProEngulfing - Advance Engulf 지표의 유료 버전으로, 여기에서 다운로드할 수 있습니다. ProEngulfing 의 무료 버전과 유료 버전의 차이점은 무엇인가요? 무료 버전은 하루에 하나의 신호로 제한되어 있습니다. QualifiedEngulfing을 소개합니다 - MT4용 전문 Engulf 패턴 지표 QualifiedEngulfing을 사용하여 외환 시장에서 자격을 갖춘 Engulf 패턴을 식별하고 강조하는 혁신적인 지표로 정밀력의 힘을 발휘하세요. MetaTrader 4용으로 개발된 QualifiedEngulfing은 Engulf 패턴을 정확하게 인식하고 강조하기 위한 첨단 접근법을 제공하여 거래 결정에 대해 가장 신뢰할 수 있는 신호만을 제공합니다. QualifiedEngulfing 작동 방식: QualifiedEngulfing은 Engulf 패턴을 분석하기 위한 정교한
FREE

ENIGMERA: 시장의 핵심 중요: MQL5.com의 데모는 Strategy Tester에서 실행되며 Enigmera의 기능을 완전히 반영하지 못할 수 있습니다. 설명, 스크린샷 및 비디오를 확인하여 자세한 내용을 확인하십시오. 질문이 있으면 언제든지 메시지를 보내주세요! 인디케이터의 코드는 완전히 다시 작성되었습니다. 버전 3.0은 새로운 기능을 추가하고 인디케이터가 처음 출시된 이후 누적된 버그를 수정했습니다.
소개
이 인디케이터 및 거래 시스템은 금융 시장에 대한 주목할 만한 접근 방식입니다. ENIGMERA는 프랙탈 주기를 사용하여 정확하게 지원 및 저항 수준을 계산합니다. 실제 축적 단계를 보여주고 방향과 목표를 제공합니다. 트렌드와 수정 모두에서 작동하는 시스템입니다. 작동 방식
인디케이터의 대부분의 기능은 차트 왼쪽에 있는 버튼을 통해 제어되며, 이를 통해 다양한 시장 상황에 빠르게 대응할 수 있습니다. 버튼 ON/OFF – 인디케이터 전체를 표시하거나 숨깁니다.

현재 가격이 유지될 때 미리 받아두세요. 가격은 언제든지 변경될 수 있습니다. "Black Horse" 지표의 목표는 가격 행동과 VWAP 지표 간의 차이를 식별하는 것입니다. 이 지표는 잠재적으로 거짓된 차이를 걸러내고 고품질 및 정확한 경고를 생성하기 위해 필터를 사용합니다.
하락 차이는 양봉 위에 표시되는 빨간 점으로, 상승 차이는 양봉 아래에 있는 초록 점으로 나타납니다.
주된 차이 필터는 ATR(평균 실제 범위)와 되돌아보는 기간 내 이전 양봉의 가격 움직임을 중심으로 합니다. 가격 움직임이 ATR 곱하기 ATR 배수를 초과하는 충분한 강도로 나타날 때 차이가 확인됩니다.
계산 특성 상, 더 높은 시간 프레임에서 작업할 때 ATR 배수 및 되돌아보는 기간에 더 낮은 값을 설정하는 것이 좋습니다. 더 높은 시간 프레임에서는 가격 움직임이 보다 부드러워지므로 예를 들어 15분 차트에서처럼 급격한 가격 변동이 덜 발생하고 일반적으로 낮은 시간 프레임보다 더 적은 양봉 내에
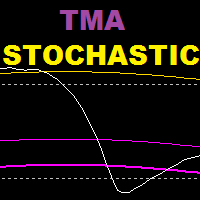
TMA 스토캐스틱은 스토캐스틱 오실레이터와 tma 밴드 지표를 기반으로 하는 지표이며, 이 지표는 반전 전략을 기반으로 합니다.
권장 시간대 : 15세 이상
권장 설정 : 스캘핑은 낮은 값, 스윙 트레이딩은 높은 값
================================================= ======================
매개변수:
tma 히스토리: 확률론적으로 tma 밴드를 표시하기 위해 얼마나 많은 막대가 다시 표시됩니까?
K 기간(확률론적)
D 기간(확률론적) S 기간(확률론적) TMA 기간
TMA 교대
Extreme tma 편차 : 원거리 대역의 편차
tma 편차 : 내부 밴드의 편차 ----------------------------------------------------------------
FREE
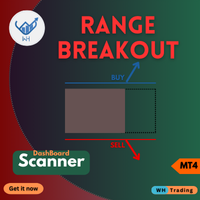
최첨단 MQL4 지표인 Range BreakOut MT4로 거래의 새로운 차원을 열어보세요.
이 강력한 도구는 가격이 정해진 범위를 벗어날 때 가격 변동을 식별하고 이를 활용하도록 설계되었습니다.
역동적인 금융 시장에서 성공하는 데 필요한 정확성과 자신감을 제공합니다.
MT5 버전 : WH Range BreakOut MT5
특징:
정확한 범위 감지. 여러 개의 심볼과 여러 개의 시간 프레임(스캐너). 실시간 돌파 신호. 사용자 정의 가능한 매개변수. 위험 관리 도구.
왜 우리 제품을 선택해야 합니까?
정밀거래. 시간 절약. 다재. 지속적인 업데이트. Range BreakOut 스캐너로 오늘 귀하의 거래 경험을 변화시켜 보세요.
금융 시장의 복잡성을 헤쳐나가는 데 있어 당사의 지표를 신뢰하는 성공적인 트레이더의 대열에 합류하세요.
Range BreakOut을 지금 다운로드하여 트레이딩 실력을 향상시켜 보세요!
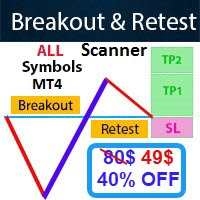
- Real price is 80$ - 40% Discount (It is 49$ now) Contact me for instruction, add group and any questions! - Non-repaint - I just sell my products in Elif Kaya profile, any other websites are stolen old versions, So no any new updates or support. - Lifetime update free Related product: Bitcoin Expert
Introduction The breakout and retest strategy is traded support and resistance levels. it involves price breaking through a previous level. The break and retest strategy is designed to help tr
Forex and Gold OBI is an innovative indicator based on a study of price and market dynamics, utilizing the RSI indicator. This indicator helps you find the best moment to enter the forex market by signaling when the market is in overbought or oversold conditions. Moreover, The indicator calculates two possible targets and the stop loss for each trade, allowing you to optimize your risk/reward ratio. Price This indicator is easy to use and set up, working with any currency pair and timeframe. If
FREE

The "Yesterday High Low" indicator for the MetaTrader 4 (MT4) trading platform is a powerful tool designed to help traders identify key price levels from the previous trading day. This indicator provides a visual representation of the high prices, low prices, high/low price averages, and intermediate average levels on the chart.
Primarily used by institutional and professional traders, this indicator offers an instant view of price levels that are often considered crucial in financial markets.
FREE
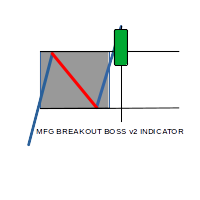
MFG breakout boss indicator is a Semi Autom ated Asian session range breakout System which seeks to identify the High and low of the asian session when the Market is ranging with no major movement, With the help of sofisticated Algorithm within the system, a breakout in either direction coupled with momentum the system gives High Accurate entries, with predefined Stop loss and 3 Take profit levels.

RSI divergence indicator is a multi-timeframe and multi-symbol indicator that help us find divergences between price chart and RSI indicator. Always use the divergence indicators with other technical assets like support resistance zones, candlestick patterns and price action to have a higher possibility to find trend reversals. This indicator will identify the peaks and troughs of both price and the RSI indicator. You can adjust the parameters to adjust the strength and weakness of these peaks a
FREE

In Forex trading, understanding support and resistance is crucial. Virtually every trading strategy incorporates these levels.
MetaTrader lacks built-in support and resistance calculation features, but there's a solution— the Support and Resistance Lines indicator.
This powerful MetaTrader indicator automatically calculates and displays support and resistance levels for any chosen currency pair or trading instrument.
Benefits of the Support and Resistance Lines indicator:
1. Identify better

This pass-band oscillator reduces lag in market data by filtering out high and low frequencies. It uses two EMAs (Exponential Moving Averages) with periods of 40 and 60.
Trigger points are added using an RMS cyclic envelope over the Signal line. The pass-band waveform output is calculated by summing its square over the last 50 bars and taking the square root to create trigger levels.
Buy when the pass-band crosses above its -RMS line and short when it crosses below the RMS line. The indicator
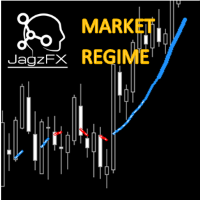
Elevate your trading with the JagzFX Market Regime Filter—adapt, optimize, succeed in navigating through smooth or volatile price movements. Gain a deeper understanding of market dynamics to refine your strategy and make informed decisions. KEY FEATURES Price Action Analysis: Distinguishes between smooth and volatile price movements. Trend Identification: Pinpoints bullish or bearish trends with precision. Strength Assessment : Evaluates the strength of identified trends—whether strong or weak M
Доброго времени суток уважаемые трейдеры и инвесторы.
Вашему вниманию предлагается индикатор, определяющий за любой промежуток времени : Максимальную цену. Минимальную цену. 50 % от от максимума до минимума. Цену закрытия периода. Кроме того, в зависимости от настроек - индикатор может добавлять 10 процентных уровней как вниз, так и вверх, эти уровни указываются, но по стандарту начинаются от 50% с шагом 50% до 500%. В обе стороны. Индикатор реализован максимально удобно, при смене тайм-фрейма

The Waddah Attar Explosion (WAE) indicator is a potent tool in Forex trading, offering buy, sell, exit buy, and exit sell signals. It assesses trends as trend power and momentum as explosion power.
Trend Direction: - Green bars indicate a bullish trend. - Red bars indicate a bearish trend.
Signal Line: - A line serves as a threshold for momentum.
Buy Trade Setup: **Entry:** Go long when a green bar crosses above the threshold. Place a stop loss below the entry candle. **Exit:** Close the tra

In MetaTrader, TP & SL values aren't visible when hovering over corresponding lines. Our indicator fixes this by showing values on-screen. It displays defined SL and TP values in your account currency, facilitating easy tracking of positions. Note : The indicator estimates values, excluding commissions, and allows customization of colors and distance from SL/TP lines.
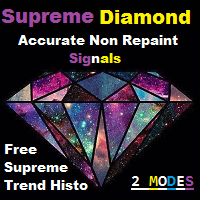
Supreme Diamond는 반전 및 추세 거래 전략을 기반으로 하는 다중 시간대 지표이며 지표는 다시 칠하거나 백 페인트하지 않으며 신호가 지연되지 않으며 지표는 경고와 함께 매수 및 매도 신호를 제공합니다.
표시기에는 (최고의 항목을 다이아몬드로 사용) 입력에서 선택할 수 있는 2가지 신호 모드가 있습니다. true로 설정되면 표시기는 일반 모드 신호를 필터링하고 가능한 최상의 신호를 다이아몬드 신호로 제공합니다. 다이아몬드 모드에서는 다이아몬드 신호를 조정할 수 없습니다. . 일반 모드는 (다이아몬드로 최상의 항목 사용) 입력이 false로 설정된 경우 스크린샷에 표시된 것처럼 밴드 설정과 볼린저 밴드 전략으로 일반 모드가 활성화됩니다. 최상의 성능을 보여주기 때문에 다이아몬드 모드 사용을 적극 권장합니다. 슈프림 다이아몬드 거래 방법: 지표에서 신호를 받으면 거래를 시작하고, sl을 이전 저점/고점으로 설정하고, tp를 최소 RRR 1:1로 설정하세요.
권장 기간 :
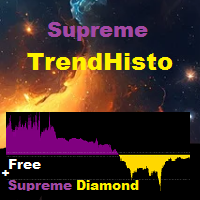
Supreme TrendHisto는 하향 및 상향 추세 신호를 제공하는 추세 표시기이며 표시기는 히스토그램 역할을 하며 표시기는 다시 그리기/뒤로 그리기/지연을 수행하지 않습니다.
전략
매수 거래: 히스토그램이 0.65 이상 교차하면 매수 거래가 시작됩니다. 청산의 경우 히스토그램이 0.70 레벨에 도달하면 퇴장하거나 웰에서 퇴장할 수 있습니다.
매도 거래: 히스토그램이 -0.65 아래로 교차하면 매수 거래가 시작됩니다. 청산의 경우 히스토그램이 -0.70 수준에 도달하면 청산하거나 웰에서 청산할 수 있습니다. ===============================
권장 기간 : 언제든지
권장기간 : 기본값
===========================================
매개변수:
1.지표 기간(스캘핑의 경우 더 낮고 스윙 트레이딩의 경우 높음)
2. 계산 유형(닫기/열기/낮음...등)
3.max bar(표시할 기록 수)
4.빠른 모드(진실 유지
이동 평균 멀티커런시 스캐너 대시보드 MT4 는 사용자 정의 가능한 이동 평균선을 사용하여 여러 통화 쌍과 시간 프레임을 모니터링하도록 설계된 강력한 거래 도구입니다. 심볼과 시간 프레임(M1에서 MN1까지)을 기준으로 신호를 정리하는 그리드 형식으로 제공됩니다. 트레이더는 전략에 맞게 특정 시간 프레임을 활성화하거나 비활성화할 수 있습니다. MT5 버전은 여기에서 확인할 수 있습니다: Moving Average Multicurrency Scanner MT5 자세한 문서는 여기에서 클릭하세요: 문서 주요 기능: 이동 평균선 통합: 주기, 이동, 방법(SMA, EMA 등), 적용 가격 등의 조정 가능한 매개변수를 가진 두 개의 이동 평균선을 지원하여 효과적인 추세 분석과 교차 식별을 가능하게 합니다. 컨플루언스 경고: 여러 시간 프레임이 동일한 방향으로 정렬될 때 컨플루언스 신호를 강조하여 거래 설정의 신뢰도를 높입니다. 사용자 정의 경고: 팝업,MENU 이메일 또는 푸시 알림
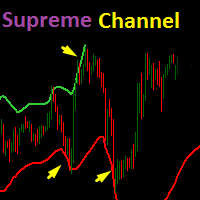
TV atr 채널 표시기를 기반으로 하는 Supreme 채널 표시기는 거래자에게 현재 추세의 잠재적 반전에 대한 힌트를 제공하는 동적 지지 및 저항 밴드입니다.
권장 시간 : 15M 이상
권장 설정: 기본값이지만 거래자는 필요에 따라 변경할 수 있습니다. ===========================================================
매개변수:
1. 채널 길이
2. 대역폭(두 채널 라인 사이의 거리)
3.Multiplier(ATR 값 승수)
4. 채널 표시(참/거짓) =========================================================================================
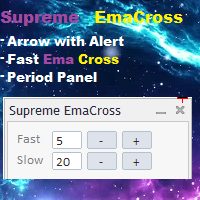
Supreme EmaCross는 두 개의 지수 이동 평균 교차를 기반으로 하는 지표이며, 에마 교차를 기반으로 매수 및 매도 화살표를 생성하고 신호 모양에 대한 경고를 제공하며 표시기가 다시 칠되지 않거나 후면 페인트 및 화살표가 지연되지 않으며 표시기가 빠릅니다. 에마 기간 변경 패널에서는 트레이더가 지표 설정으로 이동하지 않고도 에마의 값을 변경할 수 있으며 패널은 이동 가능합니다.
================================================= ====
매개변수:
빠른 기간 : 빠른 에마 기간
느린 기간 : 느린 에마 기간
알림 및 경고 설정
에마 라인 켜기/끄기
에마 라인 색상
에마 십자형 화살표 켜기/끄기
에마 십자가 화살표 색상
================================================= =========

Awesome Oscillator Scanner MT4 는 Awesome Oscillator를 사용한 원활한 분석과 실시간 통찰력을 제공하기 위해 설계된 강력한 거래 도구입니다. 여러 통화 쌍과 시간 프레임을 모니터링하여 즉각적인 경고와 포괄적인 시장 업데이트를 제공함으로써 시장 움직임을 앞서갈 수 있습니다. 이 도구는 동적 대시보드에서 신호를 정리하여 효율적이고 정보에 입각한 거래 결정을 보장합니다. 주요 기능: 손쉬운 Awesome Oscillator 스캐닝: 여러 통화 쌍을 쉽게 스캔하고 특정 Awesome Oscillator 조건이 충족될 때 즉각적인 경고를 받아 시장 움직임을 앞서갑니다. 포괄적인 대시보드 통찰력: 다양한 통화 쌍에 걸친 Awesome Oscillator 반전 및 트렌드에 대한 실시간 업데이트를 받아 자신감 있고 정보에 입각한 거래 결정을 내립니다. 확장된 통화 쌍 지원: 광범위한 통화 쌍에 접근하여 거래 기회와 시장 범위를 확장합니다. 과거 신호 변화 추적

거래 우위를 강화하세요. WaveTrend Oscillator Indicator MT4는 LazyBear의 2014 TradingView 스크립트에서 적응된 모멘텀 기반 도구로, 시장 반전과 모멘텀 시프트 검출 정확도로 유명합니다. 10년 이상 거래 커뮤니티에서 널리 축하받는 이 오실레이터는 RSI와 MACD와 유사한 요소를 결합하여 과매수/과매도 상태를 검출하며, Forex, 암호화폐, 주식, 상품 트레이더에게 필수적입니다. 그 인기는 변동 시장에서 노이즈를 필터링하는 신뢰할 수 있는 크로스오버 신호에서 비롯되며, 사용자가 트렌드 반전과 강도를 활용하고 거짓 움직임을 최소화하는 데 도움이 됩니다—고확률 엔트리를 추구하는 스캘퍼, 데이 트레이더, 스윙 전략에 이상적입니다. WaveTrend Oscillator Indicator MT4는 동적 라인(주 오실레이터의 녹색)을 통해 모멘텀을 시각화하며, 신호 라인(빨간 점선)과 상호 작용하고, 과매수 밴드(빨강 60/53)와 과매도 밴드(
Attention: beware of SCAMS, TRENDMAESTRO is only ditributed throught MQL5.com market place. note: this indicator is for METATRADER4, if you want the version for METATRADER5 this is the link: https://www.mql5.com/it/market/product/108106 TRENDMAESTRO ver 2.5 TRENDMAESTRO recognizes a new TREND from the start, he never makes mistakes. The certainty of identifying a new TREND is priceless. DESCRIPTION TRENDMAESTRO identifies a new TREND in the bud, this indicator examines the volatility, volumes a
MetaTrader 플랫폼 어플리케이션 스토어에서 MetaTrader 마켓에서 트레이딩 로봇을 구매하는 방법에 대해 알아 보십시오.
MQL5.community 결제 시스템은 페이팔, 은행 카드 및 인기 결제 시스템을 통한 거래를 지원합니다. 더 나은 고객 경험을 위해 구입하시기 전에 거래 로봇을 테스트하시는 것을 권장합니다.
트레이딩 기회를 놓치고 있어요:
- 무료 트레이딩 앱
- 복사용 8,000 이상의 시그널
- 금융 시장 개척을 위한 경제 뉴스
등록
로그인
계정이 없으시면, 가입하십시오
MQL5.com 웹사이트에 로그인을 하기 위해 쿠키를 허용하십시오.
브라우저에서 필요한 설정을 활성화하시지 않으면, 로그인할 수 없습니다.