MetaTrader 4용 새 기술 지표 - 86

Nexxt2 Indicator This indicator shows you trend and also how strenght it is together. You can use this indicator for your own experts with iCustom() BlueBuffer is in the buffer ( 0 ) and GoldBuffer is in the buffer ( 1 ) Strategy can be like this; Blue and Gold cross till Blue touch to level 1 or -1. These levels show us must be ready close position. It depends on you. there are afew parameters for using this indicator on different currencies and different time frames. Best Results are in H4 (

This EA is an extension for the free trade indicator Trend Mate . https://www.mql5.com/en/market/product/50082
The main idea is to support your decision to trade according to the current trend. It is possible to configure alert and push notification to receive when entering to first candle for bull / bear trend.
For this extension of the free indicator now it is possible to filter the current trend info with other timeframes. For example show trend for timeframe M5 considering also timefra

1、能显示货币之间的强弱 0是最弱 7是最强 2、能显示28个货币以及黄金 原油的 涨跌幅度 3、能切换货币对 4、能显示持仓订单的货币对 1、能显示货币之间的强弱 0是最弱 7是最强 2、能显示28个货币以及黄金 原油的 涨跌幅度 3、能切换货币对 4、能显示持仓订单的货币对 5、能利用键盘的的上下键切换货币对,左右键切换周期 1、能显示货币之间的强弱 0是最弱 7是最强 2、能显示28个货币以及黄金 原油的 涨跌幅度 3、能切换货币对 4、能显示持仓订单的货币对 5、能利用键盘的的上下键切换货币对,左右键切换周期 5、能利用键盘的的上下键切换货币对,左右键切换周期 1、能显示货币之间的强弱 0是最弱 7是最强 2、能显示28个货币以及黄金 原油的 涨跌幅度 3、能切换货币对 4、能显示持仓订单的货币对 5、能利用键盘的的上下键切换货币对,左右键切换周期
FREE

Morning Stars points price reversals with high degree of accuracy and it is great for scalping on the 15 min time frame. Buy and sell arrows are shown on the chart as for entry signals. They do not repaint but confirmation entries .
*Non-Repainting *For Desktop MT4 Only *Great For Scalping *Great For Swing Trading *Arrow Entry Alerts *Arrow Signals alert Strictly On The "Close Of The Candle" *Works On 15Min Timeframe *Works On Any Mt4 Pair *Perfect For New Traders And Expert Traders

This is a Multi-Time-Frame Zigzag indicator You can change parameters of Zigzag, include Zigzag Depth, Zigzag Deviation, Zigzag Backstep. You can choose which Time Frame to display Zigzag by turn ShowXXX to true or false (ShowXXX = ShowM1, ShowM5, ShowM15...). Noted: Lower Time Frame Zigzag will not display on Higher Time Frame. Example: Your current Time Frame is H1, you can not see Zigzag of M1 to M30 even you turn them on.
Whatever you are expert class Forex trader or not, you must know how to make correlation analysis between different timeframes of the same symbol, and furthermore between different symbol. Now, open one or several symbols with different timeframes, apply this smart multi-timeframe mapping tool, drag and move the vertical anchor line to the destination bar position. Then you will see the correlation of Forex market clearly. Supports multiple timeframes synchronization and multiple symbols synchro
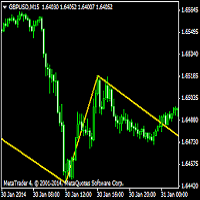
The Zig Zag indicator plots points on the chart whenever prices reverse by a percentage greater than a pre-chosen variable. Straight lines are then drawn, connecting these points. The indicator is used to help identify price trends. It eliminates random price fluctuations and attempts to show trend changes. L'indicateur Zig Zag peut être utilisé pour filtrer les mouvements de prix ... 1 Minute Indicators Used: RSI (30 / 70) Fibonacci (1 - 0.784)

THIS IS DEFINITELY THE BEST INDICATOR ON THE MARKET Please book an appointment on our facebook page (www.facebook.com/wetrainfx)
Fantastic for scalping, swing trading and Intra-day tradering Arrows show direction ! You also get an early warning that a move is about to happen.
Mobile and desktop alerts.
Effective on any traded pair
Effective on any timeframe.
Perfect for new and old traders
THIS IS THE MT4 VERSION.
HOW TO USE 1. Open a few charts in 15min TF. 2.

표시기는 고전적인 Gann 각도와 유사한 추세선 팬(특정 촛불을 클릭한 후)을 만듭니다. 지표의 특징은 고정된 규모로 각도를 구축할 뿐만 아니라 특정 수의 막대(선택 사항)의 평균 가격을 사용한다는 것입니다.
표시기의 각도에 대한 평균 가격을 계산하는 방법에는 두 가지가 있습니다(선택 사항).
1) 고가에서 저가로의 평균 가격 이동(특정 수의 막대에 대한) 계산
2) 시가에서 종가로의 평균 가격 이동 계산;
옵션:
1. Method - 모서리를 구성하는 방법;
2. FixedScale - 고정 스케일(방법에서 Fixed_Scale이 선택된 경우);
3. SecondaryAngles - 보조 각도를 그릴 수 있는 권한을 제어합니다.
4. RayRight - 추세선에 대한 광선을 설정합니다.
5. DrawBackground - 배경으로 선을 그립니다.
6. AnglesQuantity - 각도의 수;
7. Bars_To_Pro

Personal Note (How best to use this fishing indicator) (Metatrader 4)
This is a highly intuitive indicator. I will express here, how I trade with it personally.
(Trend) 1. One way, you insert the fishing indicator onto your charts, and wait around 10mins at least, you can wait more.
The dot will become a more reliable direction color. Then you could choose to trade it.
Once done. take the indicator off your chart. And then you can repeat and rinse.
(scalping) 2. This is my perso
Binary Trend System is a professional scalping indicator designed for trading binary options and Forex instruments. The indicator is based on Price Action patterns that are able to predict future price movement with a high probability. The alert system (alerts, email and push notifications) will help you to simultaneously monitor multiple trading instruments. Attach the indicator to a chart, and the alert will trigger once a signal emerges. With our alerting system, you will never miss a singl
Elite SR - Advanced Level Indicator for automatic detection of support and resistance levels with different degree of credibility should become a part of your trading arsenal. This indicator is accessible via iCustom function and provides level values as well as their degree of credibility. Elite SR is fully adjustable and can work on any time-frame with any trading instrument!
Important information For all detailed information about this indicator you can visit 747Developments website.
Feat

This indicator is only working in M1 period.it is predicting end of horizantal trend by using envolepes indicator. After takeprofit predicted, this indicator will open 4 orders as buy and sell. One of the order is market type, others are limit type. There are 25.5 and 70 pips range between these limit type orders. After market type order reach its target other limit orders will be deleted automatically. Note that this system is not martingale, this system is creating limit order. T

TWO SYMBOLS CORRELATION line indicator It compares the power/strength lines of two user input symbols and create a SMOOTHED line that indicates the degree of deviation of the 2 symbols Strategy#1- FOLLOW THE INDICATOR THICK LINE when CROSSING O LEVEL DOWN --- TRADE ON INDICATOR THICK LINE (TREND FRIENDLY) !! Strategy#2- TRADE INDICATOR PEAKS (Follow indicator Reversal PEAKS Levels)!! you input - the index of calculation ( 10/20/30....) - the indicator Drawing start point (ind
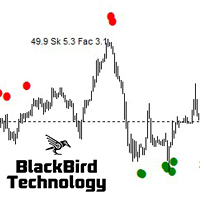
Dear Trader, this is one of the most powerful signals you will find in the market place. I worked many months to improve the accuracy. Check for yourself with the demo version. Parameters are set for EURUSD. I can assist you to configure it for any other symbol or TF. It can be configured to generate more of less in-trend or contra-trend signals. Extreme Swing Indicator is a no-nonsense, no delay, no repaint indicator ! It selects buy/sell entry signals based on a number of swing calculations a

Symbols Strength meter Graph :::: It is programmed to work on any M5 Chat windows !! Used to determine the Strongest currency pairs and the Weakest pairs also detect the peak of deviation of currencies strength IT CAN BE USED FOR INDICES AND STOCKS TOO !! Strategy one : It can be used in to BUY Strongest pair and SELL Weakest one Strategy two: It can be used on Daily basis to Hedge BUY Strongest pair with high % (ex: +1%) and BUY Weakest one with % lower(ex: -0.7%) the same with SELL Strateg

Term "shark" in the business world denotes a high volume investor who just made a good investment in a highly Potential business deal.So, sharks are the ones who make the market move. In our case, if an American shark bought a Japanese company, he/she has to convert American dollars into Japanese yen to make the deal. So, the demand for the Japanese yen will increase sharply. Thus USD/JPY will go short rapidly if the deal was from the shark. Another example, In the case of forex, if fed increa
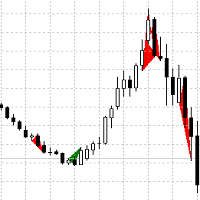
A trend indicator based on the definition of several types of candle combinations, the triangle formed is colored with the corresponding color, the red trend is down, the green one is up. Candlestick combinations of standard and non-standard types with additional conditions for their definition. The recommended timeframe is M30,H1,H4, D1. When combined with other trend indicators, it will provide more accurate points of entry and exit from the market (buying and selling).

A trading range takes place when a financial instrument (stocks, indices, bonds, commodities, Forex currencies or cryptocurrencies) oscillates between two upwards and downwards boundaries for a period of time. This Indicator tool help us to view range on the chart bar per bars, also set range in percent and get clean posicion. Range trading works best in the absence of a trend. When the markets lack a clear direction, that’s when these consolidation periods settle in. Alternatively, more exper

Liquidity Buy Sell Signal Indicator is a no-nonsense, no delay, no repaint indicator ! Liquidity pools together with a trend filter is the most powerful and reliable signal according to me (with the correct parameters depending on the timeframe used) It selects buy/sell entry signals based on liquidity in the market. The time range to scan for liquidity can be set in the parameters. Liquidity is an important aspect in the market, especially for institutional investors, as they need lots of liqu

The Trend Change indicator allows you to use the moving average to indicate to the trader a change in the direction of the trend movement. This is a modified indicator, the advantage of which is the ability to keep up with rapid changes in price dynamics in the presence of excellent SMA smoothing over the period. I recommend the standard indicator settings. Apply on a timeframe not lower than M30
Average Directional Movement Index Technical Indicator (ADX) helps to determine if there is a price trend. It was developed and described in detail by Welles Wilder in his book "New concepts in technical trading systems". This ADX Signal Scanner will search in Market Watch for a good Entry Point on the chart on every Time frame interval. You can set it to view back shifted signals with custom ADX period, levels and more.

Smart Psar its an strategy indicator, based on the strategy of parabolic sar and exponencial moving average of 30 periods, when them aim to a long trend, then a white arrow will spawn in the high of the candle and it will a draw a line to follow the trade near the candles , before a time when the conditions are gived ,then a close position signal will be appear like a white check,but also if them aim to a shoty trend, then the arrow will be turn yellow spawning in the low of the candle and it wi

PROMOÇÃO LIMITADA, NA COMPRA DE 1 INDICADOR VOCÊ LEVA CLUBINARIAS 6.0 , 5.1 e DonForex DE BRINDE!! ATÉ FINAL DO MÊS!
-NA HORA DA COMPRA SELECIONAR COMBINAR COM O VENDEDOR OU BUSCAR PESSOALMENTE, A ENTREGA É DIGITAL EM POUCOS SEGUNDOS
==> VEJA O VIDEO PARA TIRAR AS SUAS DUVIDAS <==
==> VÍDEO OPERANDO NO YOUTUBE
ROBÔ FEITO COM MUITO ESFORÇO E CARINHO E QUE ESTA TRAZENDO
ÓTIMOS LUCROS
APESAR DE EXISTIREM PESSOAS QUE APENAS VENDEM ROBÔS FAKES DE OPERAÇÕES , ACREDITO QUE SERIA M

The ' Average Bar Chart ' indicator was created to showcase the traditional Heiken Ashi calculation as an exotic charting style. This indicator is known for reducing chart noise for a smoother price action. A dditional indicators are recommended
Key Features Candlesticks for OHLC are removed from the chart. Average bars may be shown as complete bars without tails. All functionality and features of this exotic chart are inputs.
Input Parameters Chart Timeframe = PERIOD_CURRENT; - period to s
FREE

This system never paints. This system created by using Envolpes bands and reverse bar count. This indicator is only working in M5 period. This system is for long term and profitable. Signals are shown as arrows. as an optional limit orders. You can set a voice alarm or email notification. You can fins our other products from link : https://www.mql5.com/en/users/drbastem/seller Also, you can ask all your questins from email : haskayafx@gmail.com or mobile : +90 530 867 5076 or @Meh

SYMBOL POWER based on inputted 5 time frames and Compared to 20 Other Symbols !! Great Indicator YOU DON'T HAVE TO SHIFT ON ALL TIME FRAMES FOR EACH CURRENCY PAIR TO CONCLUDE ITS TREND AND ITS POWER YOU HAVE IT ALL IN ONE TABLE , 20 CURRENCY PAIR WITH 5 TIME FRAMES ALSO , COMPARE BETWEEN CURRENCIES STRENGTH AND ALERTS THE STRONGER /WEAKER PAIR BASED ON 5 TIMEFRAMES CALCULATIONS ALEERTS enable /disable using 5 time frames M5 M30 H1 H4 and D1 ( latest version You SELECT you own 5 timeframes fr
Parabolic Sar easy mode, remake the original p.sar indicator making it more easy to read for novicians traders and experimented traders looking to reduce the time analizing the charts, you can make your own strategy modificating the periods and fusioning it with others indicators like RSI ,stochastic or what you want,its one indicator runs better on high time charts like H4 or D1.
FREE

Hi Friends! this is countdown candles with 4 functions. 1. Countdown current Candles 2. Countdown H1 timeframe. 3. Countdown H4 timeframe. 4. show the spread index and the lowest spread value within 5 minutes. Instructions for installing and downloading this indicator in the link below. https://www.youtube.com/watch?v=fi8N84epuDw Wish you have a happy and successful day.

ADX revolution its an revolutionary indicator, this one simplificate all the signals of convencional ADX indicator, analyzing the market more quickly and giving more colour to the entry signals, to gift you more time for trade and dont waste time analizing. Nice to meet you trader!, im from Argentina if you have any question please contact me by my email: despiertatutrader@gmail.com

Stochastic easy cross, its a simplificated version of original Stochastic indicator, its one its based on the cross of the main line and the signal line of the indicator,and when a cross ocurrs , a cross or a flower will be drawn , if a blue cross appear its one give us a buy signal, and if then is drawn a red cross its talk us about a sell signal, well this is all its really easy to use, any question please ask me to mi email see you! email: despiertatutrader@gmail.com

RSI orbes its an remake of the classic RSI indicator, it have the same but show it by a different way, if lvl 30 or lvl70 are crossed the RSI orbs will draw red orbs or blue green orbes,you can create your own strategy configuring the periods, also for sell when the red orbs appear or to buy when the green orbs its drawn, you can use it by your way, any question please ask to me to my email , good luck see you! email: despiertatutrader@gmail.com

丁丁导航来源: 市场如同河流,有惊人相似,必有可参考借鉴之处。用河中漂流的一叶小舟来比喻外汇操盘是非常贴切的。 河流主航道方向具有不确定性,忽南忽北,这是大方向,河道有宽有窄,小舟相对于河道会被不同的水流力量忽左忽右,这是当前偏移方向,南北和左右构成了小舟在河道中的定位坐标系。 驾船者可以通过在船的两边加减重量来调整左右,校正航向。如果你想靠左岸一些,那就在左边加重量,或者减少右边的重量。有了河道坐标系,驾船者才可以做出正确的加减重量的动作,以确保小舟平稳航行。 市场是河道,有持仓单就有小舟,而你就是驾船者。市场中的漂流者必须拥有一套精准的导航系统,随时知道市场方向以及与主航道的偏移量,才能让资金小舟安全。 丁丁导航构成: 市场河道由三根线构成,我们称其为“宽带”。两根边线表示市场波动宽度。中线表示市场方向,市场方向只有2个,非涨即跌。 持仓宽度由三根线构成,我们称其为“窄带”。两根边线表示持仓波动宽度。中线表示持仓方向,持仓方向只有2个,非多即空。从图中可以清晰看到窄带总是围绕着宽带缠绕行进,其相对位置直观地反映了报价在市场趋势中涨跌力度。 窄带和宽带有6个

MACD Cross with additional features which conditions must met if there was set on 1. Stochastic Limit : Buy Above, Buy Below, Sell Above & Sell Below 2. RSI Limit: Buy Above, Buy Below, Sell Above & Sell Below 3. EMA Limit : Buy if EMA1 & EMA2 above EMA3, Sell if EMA1 & EMA2 below EMA3 It also can set whether show arrow and sound alert. MACD, RSI, Stohastic and EMA values can be changed according each user
SWing3 메타트레이더4 유동성 및 이동 평균에 따라 달라지는 지표 > 98%의 올바른 구매 및 판매 결정을 제공합니다. 그리고 거래를 마감할 시간. PRICE는 수시로 증가할 것이며 첫 번째 EA가 출시되는 시기는 이 지표에 따라 2k 이상이 될 것입니다. 1 - 매수 또는 매도 포지션을 열 때(두 라인 X의 교차에 따라 다르며 포인트 계산은 선택한 프레임에 따라 다름) (십자가는 색칠된 영역 밖에 있어야 함) 촛불은 십자가 후에 또는 (첫 번째 또는 두 번째에서 다섯 번째까지) 십자가에 닿아야 합니다. 마지막 조건이 십자가에서 직접 확인되었을 때 계산되는 포인트 2-다음 영역 외부의 노란색 라인 시작 곡선이 위치를 닫으라는 신호일 때 3-works on Frames (1m 5m 10m 15m 30m 1h 4h 매일 주간 및 월간)(모든 쌍>및 모든 상품) 전공 권장 4- ..(55%)의 이득을 얻은 후 트레일 스톱 1000$ 스택에 대해 각 거래에 대해 5개의 권장 로트 0.

스캘핑 인스턴트 인디케이터.
지표의 기저값과 함께 매수 또는 매도 신호가 화살표로 표시됩니다.
화살표와 4개의 시간대를 표시하는 지하 표시기가 예보에서 일치할 때 강한 신호로 간주됩니다.
이 지표에는 Skalping 인스턴트 지표가 제공하는 하나의 결과로 축소된 많은 알고리즘과 작업이 포함되어 있습니다. 즉, 거래자에게 시장의 방향을 알려줍니다. 따라서 그는 제공
1. 스캘핑 신호(그림 1) 그림 1-D1과 같이 D1 차트의 선택된 기간과 지표의 지하 섹션에 매수 신호가 있습니다. 신호는 지체 없이 도착합니다. 이 경우 스캘핑 전략을 사용하여 거래하는 것이 좋습니다.
2. 신호 수정 또는 추세. 그림 2와 같이 지하실에서 그래프의 모든 기간에 대해. 모든 기간은 빨간색 영역 -> 매도 위치에 있습니다. 차트 자체의 기간과 지하 지표가 일치할 때 색상이 변경될 때까지 거래를 보류하십시오. 따라서 지표는 다른 전략에 상당히 적응할 수 있습니다.
주요 통화 쌍에 사
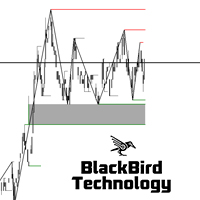
Dear Traders, check out my new multi level market liquidity indicator : https://www.mql5.com/en/market/product/73098
Many of you have been trading very good with this indicator, thanks for the support and positive feedbacks ! For more information about market liquidity, a manual on how to use this indicator please send me a message. A lot of information can be found on the net. (search liquidity trading/ inner circle trader)
https://www.youtube.com/watch?v=yUpDZCbNBRI
https://www.youtube.c
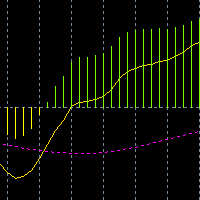
This is a user-defined algorithm based on MACD, which adds a signal line to make this indicator look like the MACD style popular in mainland China. At the same time, a pop-up box is added to indicate the buying or selling signal when two signal lines cross.
The yellow signal line shall wear the pink signal line, the pink signal line below, and the yellow signal line above, indicating long.
Under the yellow signal line, wear the pink signal line, under the yellow signal line, and above t
FREE

This indicator uses several complex algorithms to accurately determine the trend. All algorithms are based on Price Action, so on the one hand there is no loss of time, for example, that the entry is only made at the end of the trend and you already have a few pips less, this does not happen with this indicator. On the other hand, this is also much safer, because international trading is almost completely based on Price Action. The input parameter "Number" is the number of applicable conditions

The indicator draws support and resistance lines on an important part of the chart for making decisions. After the trend line appears, you can trade for a breakout or rebound from it, as well as place orders near it. Outdated trend lines are deleted automatically. Thus, we always deal with the most up-to-date lines. The indicator is not redrawn .
Settings:
Size_History - the size of the calculated history. Num_Candles_extremum - the number of candles on each side of the extremum. Type_Ar

Multi Strategies Combined Signal All in One Multi Strategies Single Combined Select from up to 6 Strategies solo or Combine different strategies for signal generation (Combining more than 2 strategies may LIMIT a lot the number of signals)! ALL inputs and Strategies selection From Chart !!! Also Inputs editing from Chart !!! Push your strategy bottom (one strategy) OR Combine signal from as may strategies (up to 6) : Selected and enabled strategies will be in GREEN !!! 1- BUY SELL areas 2-

A signal indicator consisting of several well-known indicators that process data sequentially. 2 options - for schedule and basement. In the settings it is possible to enable alerts about the change of trend (alerts) sound, by e-mail and push. It is possible to change the colors and thickness of the lines, the colors and codes of the arrows, the number of calculation bars and separately configure the parameters included in the indicators.
FREE

P R I C E F O R C E A N A L Y Z E R This is a complex indicator that calculates the force of the price direction.
V E R Y I M P O R T A N T This is not a stand alone indicator. Use it together with your own strategy. This indicator only confirms your possible position. You can run it in any charts and timeframes but H1 is recommended. Make sure that the pair is volatile at the time of trading. If you don't have a solid volatility-based strategy ye
FREE
The Trends Signal indicator displays the direction of the trend with arrows, works in a simple and clear way. It uses a combination of reliable and simple indicators to analyze prices. The signals of the Trends Signal indicator can be interpreted as follows: buy when the bars are colored blue, and sell when they are red. An effective indicator with a wide range of three parameters for trading.
Parameters: Length - The number of bars to calculate. LevelUP, LevelDN - Levels for determining over

Trend Transition is a hybrid indicator, as it is based on signals from several well-known products: RSI and MA. MA is a trend indicator of the average true range, which determines the range of minimum and maximum price fluctuations, as well as closing prices. RSI is an indicator of the family of oscillators. The indicator helps to calculate the oversold and overbought levels of a trading instrument.
When a trend changes, the Trend Transition indicator uses a color alarm: blue - when changing
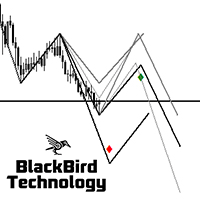
This indicator displays three forecast projections of the last market swings based on the Zig Zag indicator. Price action moves very often according to what happened in the near past, the indicator displays the price pattern that the market will possibly follow. Both short and long patterns are displayed in the chart with an indication of the target price level. If multiple projections overlap or almost overlap, then the next price movement becomes very likely. In this case it's a ranging market

The indicator detects important peaks and troughs (extremes) on the chart. These points can be used to plot support/resistance levels and trend lines, as well as any other graphical analysis. These points can serve as reference points for setting trading orders. The indicator does not redraw .
Settings:
Size_History - the size of the calculated history. Num_Candles_Right - number of candles to the right of the peak or trough.
Num_Candles_Left - number of candles to the left of the pea

Indicator designed for binary options trading buy signals come along with hiding a new candle blue arrow on histogram buy signal red arrow on histogram sell signal buy worth 1 or 2 candles the signal appears with the opening of a new candle but may appear during its formation it’s worth entering the deal only when the signal has arrived at the opening, the signals do not disappear Recommended currency pairs: Any Timeframe: up to H1 You can customize the PERIOD parameter to your trading style Rec

FEATURES OF THE HELPTRADER TO ENTER THE MARKET INDICATOR ! four types of moving averages for building a channel; ! ability to select the width of the flat (Central MA) and the margin for the channel borders; ! four options for the display channel; ! three settings for the appearance of the arrow signal; !customizable notification system. The arrow channel indicator HelpTrader to Enter the Market, due to its variability, can become a fairly effective tool for trading in combination with other in

Reflector is an auxiliary tool for technical analysis, which helps to determine the direction of the trend: either upward or downward price movement on the selected trading instrument. The indicator is an indicator of a trend type; it smooths out price fluctuations during signal formation by averaging data. The indicator uses calculations designed to smooth out sharp fluctuations that do not affect the overall picture of price movement.
A trend can be increasing (bullish trend) and decreasing

Icebreaker trend indicator provides an opportunity to classify the direction of price movement, determining its strength. The solution to this problem helps to enter the market on time. You can not only see the direction of the trend but also the levels by which you can work.
The indicator determines the prevailing trend in the price chart. But not only, but also analyzes the price movement, and indicate the points of possible reversals. This contributes to the quick and optimal opening of bu

Economic Calendar Viewer
This economic events reader is adapted to load data from a csv file. You can prepare the csv file yourself according to this template, you can do it in notepad or csved. The file should normally be named Calendar-MM-DD-YYYY.csv. And contain lines with data column headers according to this example. In the Impact column, i.e. impact on the market depending on the importance of the event, the names accepted from the least important are: None, Low, Medium, High. In column
FREE
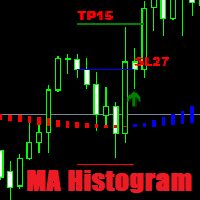
Commercial version of open code . A forex trader can create a simple trading strategy to take advantage trading opportunities using MA Histogram or associated indicators. MA Histogram are used primarily as trend indicators and also identify support and resistance levels.
Improved version 1.30
Added: Take Profit Stop Loss Automatic optimization Result R/R Consecutive losses
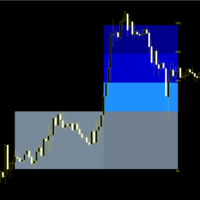
NO REPAINT The system combines several analytical techniques and presents BUY/SELL signals in an easy-to-read form. You don’t have to be a professional to use it. Conservative TP SL can make amazingly accurate market predictions by constantly auto-analyzing every price movement, trading patterns and with the help of complex trading algorithms. This indicator main task is to look for gravity zones and generate buy/sell signal with exact SL and TPs location. When specified conditions are fulf
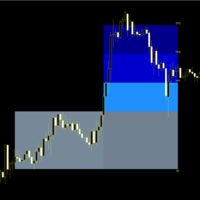
NO REPAINT The system combines several analytical techniques and presents BUY/SELL signals in an easy-to-read form. You don’t have to be a professional to use it. Aggressive TP SL can make amazingly accurate market predictions by constantly auto-analyzing every price movement, trading patterns and with the help of complex trading algorithms.
This indicator main task is to look for gravity zones and generate buy/sell signal with exact SL and TPs location. When specified conditions are ful

Current Pips and Money Profit This indicator displays the results of the currently open position on the graph. Result in pips and in the invoice currency. Thanks to this, you can enlarge the chart to the entire screen and have control over the result of trading without opening a terminal window which takes a space of a screen. The display positions of this data can be adjusted at the user's discretion and colors also.
FREE

---> Check all the other products <---
The Multi Time Frame Chandelier Channel is a good synthesis of the chandelier trailing stop and let you analyze the trend.
Enter when the price breaks one of the two lines, then trail using the opposite line. Ideal for scalping, entering after the dot appears.
Plenty of customization: Choose the lookback period, the longer, the slower Choose the Time Frame to use (must be greater or equal your chart TF Play around with the options to get the
FREE

My Account Brokers Details This indicator displays the account data and broker terms regarding its operation. For example, broker name, account number, financial leverage, account currency, automatic trading approval, minimum lot, lot step, maximum number of lot, margin call, stop out and many other important data. It is easier to display such data on the chart in one moment with a click of the mouse, than to look for it in the contract or call the broker.
FREE

The Stock Exchange One Sessions Hours version 2.00
This indicator facilitates observing the currency pair's quotations during subsequent parts of the stock exchange session live. Before the session starts, a rectangle is drawn on the chart but not filled in with color. It means the extent of the session duration. Before the first bar enters the rectangle of the session, a sound signal or pop-up window will notify us that the session will just start. When the price graph crosses the edge of th
FREE

Standart MACD indicator but All parameters can be changed for users. Extern Inputs: FastMA method : Simple, Exponential, Smoothed and Linear Weighted FastMA Price : Close, Open, Low, High, Median, Typical and Weighted FastMA count : Default is 12 SlowMA Method : Simple, Exponential, Smoothed and Linear Weighted SlowMA Price : Close, Open, Low, High, Median, Typical and Weighted SlowMA Count : Default is 26 Draw Mode : Line or Histogram SignalMA Method : Simple, Exponential,

Email and push notification Alert This is very powerful tool to get Detailed view of all of your trading on same spot. it can send 2 types of alerts, Email Alerts Push Notification
1: Email Alert email alerts are consist of 4 sections Section 1 includes Account number and name details Section 2 includes Account Balance Equity and Floating Profit/Loss details. Section 3 includes Pair wise Profit and loss Section 4 includes Pair wise+Order wise Detailed view of all trades. its includes numbers
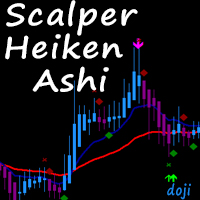
There are several types of Patterns, We choose Doji that is used for continuation and trend reversals.
Signal types : #1 Premium Signal- ---------------- Doji should have the colour of the expected direction change along with normal candle colour matching direction.
#2 Secondary Signal ---------------- Doji has the perfect formation however the bar maybe in the same colour as the previous bar but the candle colour has new direction colour.
Stochastics-Filter: ---------------- The Stoc

---> Check all the other products <---
The Multi Time Frame Chandelier Channel is a good synthesis of the chandelier trailing stop and let you analyze the trend.
Enter when the price breaks one of the two lines, then trail using the opposite line. Ideal for scalping, entering after the dot appears.
Plenty of customization: Choose the lookback period, the longer, the slower Choose the Time Frame to use (must be greater or equal your chart TF Play around with the options to get the

Moving Average of Momentum This indicator shows you trend and also how strenght it is together. You can use this indicator for your own experts with iCustom() Momentum is in the buffer ( 0 ) and moving average is in the buffer ( 1 ) there are afew parameters for using this indicator on different currencies and different time frames. you can test it and optimize it . Input Parameters: MomentumPeriod: default is 40 SignalMaPeriod : default is 28 SignalMAMode : default is SSMA
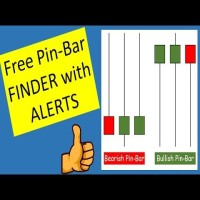
Pinbar Detector is a MetaTrader indicator that tries to detect Pinbars (also known as "Pin-bar" or "Pin bar") and marks them by placing a "smiling face" symbol below the bullish Pinbars and above the bearish Pinbars. It is a pure price action indicator, which is not using any standard technical indicators in its code. The configuration of Pinbar detection can be done via the indicator's input parameters. Pinbar Detector can issue platform alerts and email alerts on detection.
As you can see
FREE

The indicator is usefull for: binary options and forex trading..
.Support all trading Pairs.
--->Recommended expiration time for 3 to 5 candles. Exemple:
Time frame 1 minute then expiration time will be 3 to 5 minutes.
The indicator support MT2trading autotrading platform ;
SELL BUFFER : 0 (red arrow)
BUY BUFFER : 1 ( green arraw)
See #screenshot1.
This is a premium powerfull indicator show hight daily winrate..

On top of a market has three consecutive rise brick, when price lower than the continuous rise of brick of the lowest price, can do sale, if there is a pay before, should be liquidated, until after a period of time, a reversal (three consecutive falling brick brick of the highest high with new price break), at this time, can hold some sell single warehouse, at the same time set up the check.

The GBP index is an index (or measure) of the value of the Great British Pound relative to a basket of foreign currencies, often referred to as a basket Britian. trade partners' currencies. The Index goes up when the great british pound gains "strength" (value) when compared to other currencies. Displays a GBP chart in a separate window of the current chart. Based on EURGBP, GBPSEK, GBPUSD, GBPJPY, GBPCHF . All these pairs should be added to Market Watch for indicator to work. customizable mov

Introduction to Fractal Pattern Scanner Fractal Indicator refers to the technical indicator that makes use of the fractal geometry found in the financial market. Fractal Pattern Scanner is the advanced Fractal Indicator that brings the latest trading technology after the extensive research and development work in the fractal geometry in the financial market. The most important feature in Fractal Pattern Scanner is the ability to measure the turning point probability as well as the trend probabi

Dies ist ein durchschnittlicher Index basierend auf einem benutzerdefinierten Algorithmus. Je nach Band können Uplink und Downlink farblich identifiziert werden. Das Pop-up-Feld kann ein- oder ausgeschaltet werden, um anzuzeigen, dass der aktuelle Kauf- oder Verkaufsauftrag platziert werden soll.
Beschreibung der Parameterliste:
Extern int price = 0; / /anfänglicher Durchschnittspreis des Indikators
Externe int length = 20; / / der Indikator berechnet den Durchschnittszeitraum,
FREE
MetaTrader 마켓 - 거래자를 위한 로봇 및 기술 지표는 거래 터미널에서 바로 사용할 수 있습니다.
The MQL5.community 결제 시스템은 MQL5.com 사이트의 모든 등록된 사용자가 MetaTrader 서비스에서 트랜잭션을 수행할 수 있습니다. 여러분께서는 WebMoney, 페이팔, 또는 은행 카드를 통해 자금을 예치하거나 인출하실 수 있습니다.
트레이딩 기회를 놓치고 있어요:
- 무료 트레이딩 앱
- 복사용 8,000 이상의 시그널
- 금융 시장 개척을 위한 경제 뉴스
등록
로그인
계정이 없으시면, 가입하십시오
MQL5.com 웹사이트에 로그인을 하기 위해 쿠키를 허용하십시오.
브라우저에서 필요한 설정을 활성화하시지 않으면, 로그인할 수 없습니다.