MetaTrader 4용 새 기술 지표 - 30

The Supreme HmaSignal indicator is an indicator for trend trading , its main character is the hull moving average colored line , and secondary is buy and sell arrows , arrows are fair but the main focus is on the colored hma , this indicator does not repaint or back paint or delay its signals. if you like this indicator please check my Supreme Trendhisto: here , and my Supreme Diamond indicator : here
Parameters: HMA Period HMA Smoothing HMA Price (close/open) Signal Period (Arrows)
FREE

Head and Shoulders Pattern Indicator - Your Key to Recognizing Trend Reversals Unlock the power of pattern recognition with the "Head and Shoulders Pattern Indicator." This cutting-edge tool, designed for MetaTrader, is your trusted ally in identifying one of the most powerful chart patterns in technical analysis. Whether you're a novice or an experienced trader, this indicator simplifies the process of spotting the Head and Shoulders pattern, allowing you to make informed trading decisions. Key
FREE
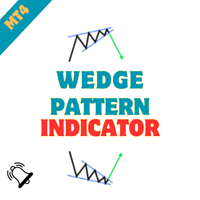
Wedge Chart Pattern Indicator - Unleash the Power of Wedge Patterns in Your Trading Embark on a journey of precision trading with the "Wedge Chart Pattern Indicator." Crafted for MetaTrader, this advanced tool is your ultimate companion for identifying wedge chart patterns, empowering you to make informed and strategic trading decisions. Whether you're a seasoned trader or just starting, this indicator simplifies the process of spotting wedge patterns, providing you with a valuable edge in the m
FREE

Rsi indicator and Stochastic Combined into one indicator , the Supreme StochRsi doesnt repaint / Back-paint / delay. can be used as overbought oversold strategy , or trend following on 50 level cross. if you like this indicator please check my Supreme Trendhisto: here , and my Supreme Diamond indicator : here ========================================================================= Parameters : Stochastic K and D value , Stochastic period Rsi Period Rsi price ====================================
FREE

Symmetrical Triangle Pattern Indicator - Mastering Trend Recognition in MetaTrader Unlock the power of trend recognition with the "Symmetrical Triangle Pattern" indicator for MetaTrader. This innovative tool simplifies the identification of symmetrical triangle patterns, providing traders with clear signals for potential trend continuation or reversal. Elevate your trading strategies with this MQL offering. Key Features : Accurate Pattern Recognition : The Symmetrical Triangle Pattern Indicator
FREE
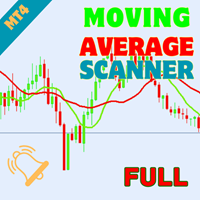
The Moving Average Multicurrency Scanner Dashboard MT4 is a powerful trading tool designed to monitor multiple currency pairs and timeframes using customizable moving averages. It organizes signals in a grid format, displaying each symbol’s status across timeframes from M1 to MN1. Traders can enable or disable specific timeframes to align with their strategies. You can find the MT5 version here Moving Average Multicurrency Scanner MT5 For detailed documentation click here Moving Average Integ

Supreme Direction is an indicator based on market volatility , the indicator draws a a two lined channel with 2 colors above and below price , this indicator does not repaint or back-paint and signal is not delayed. how to use : long above purple line , short below golden line. Parameters : channel period ========================================================
FREE
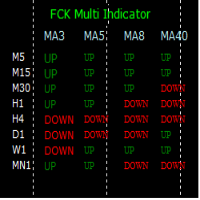
The FCK Multi Indicator for MT4 displays trend direction of multiple indicators on multiple time frames for a pair. So, forex traders can see the trend direction at a snap and trade with confluence of multiple indicators. Furthermore, it helps traders to see the trend in multiple time frames and trade in the direction of the overall market trend. Additionally, it shows the stop loss, pips to stop, pips in profit of any open position. The indicator display is very neat and is very helpful for bot
FREE

Supreme Stoploss is an indicator for metatrader 4 that is based on the ATR indicator , it gives stoploss/takeprofit as lines drawn above and below the price , this indicator does not repaint/back paint and is not delayed. can be used to determine the stop loss or take profit of a trade using ATR value multiplied by the number set by user. ====================================================================================================== Parameters : ATR SL period : ATR period identity : leave
FREE
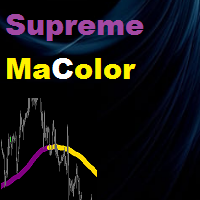
Supreme MaColor is an indicator based on moving average indicator , it gives up and down trend colors and it has different moving averages types and has multi time frame function , this indicator does not repaint/back-paint/delay signal. =================================================================================== Parameters : Timeframe (what time frame to use to draw Supreme Ma) Ma Period Ma Type Ma Price (close/open...etc) Average Shift (Ma shift) Multi Time frame on/off ===============
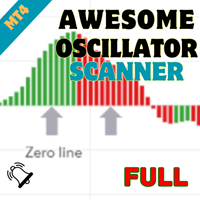
Welcome to the world of advanced trading with the Awesome Oscillator Scanner! Maximize your trading experience with our powerful MT4 indicator designed for seamless analysis and real-time insights. Key Features: Effortless Awesome Oscillator Scanning: Unlock the full potential of the Awesome Oscillator Scanner by effortlessly scanning multiple currency pairs. Receive instant alerts when specific Awesome Oscillator conditions are met, ensuring you stay ahead of market movements. Comprehensive Da
Supreme MaChannel is an indicator based on moving averages , the indicator gives dynamic support and resistance in bands format. Recommended for reversal traders , add it to your reversal strategy. Parameters : Supreme MA Period : ma periods Supreme MA Price : close/open/high/low..etc Supreme MA Type : Simple/Exponential/Smoothed/Linear Weighted Deviation : bands deviation the distance between the two band lines
Supreme Entry is an arrow signal based indicator that give buy and sell signals , the indicator gives buy/sell signals with alert on candle open/close (depends what you set it to be from inputs) . this indicator does not repaint/back-paint and signal is not delayed. Strategy : Open buy same moment buy arrow appear and open sell same moment a sell arrow appear , close on well or on opposite signal . Recommended Time frame : 15 and above this arrow is good as ? : addon to your existing strategy ,
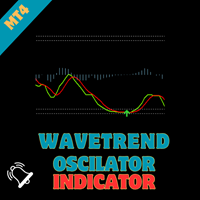
WaveTrend Oscillator - Bringing Tradingview's Renowned Indicator to MQL Elevate your trading strategies with the "WaveTrend Oscillator," an MQL port of the renowned TS/MT indicator created by Lazybear on tradingview. This powerful indicator provides valuable insights into market dynamics, offering clear signals for optimal entry and exit points in your trades.
Key Features : Proven Effectiveness : Based on the popular TS/MT indicator, the WaveTrend Oscillator brings a time-tested and proven app

Daily supply and demand levels for breakouts or reversals. Use on 1 Hour charts No nonsense, for the confident trader who trades price action supply and demand levels with daily projections without the fluff using 1 Hour charts. MT5 Version: https://www.mql5.com/en/market/product/108522 The Bank Trader Indicator is a sophisticated tool employed by institutional traders, particularly those in banking institutions, to navigate the complex world of forex markets. Rooted in the principles of daily
STOCH ARROW is a long short arrow signal type indicator that is based on standard stochastic oscillator this indicator has 3 methods of giving long and short signal that are as follow : 1.whenever stochastic lines cross 2.when a cross happens in overbought and oversold zones (short arrow on overbought zone cross , long arrow on oversold zone cross) 3.when stochastic lines leave overbought and oversold zones (short arrow on leave from overbought zone , long arrow leave on oversold zone) this ind
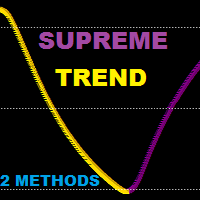
Supreme Trend is a reversal/continuation type Oscillator type indicator that is based on Moving average and stochastic indicators this indicator can be used in two methods : Reversal Method : short when golden arrow appear after arrows were above upper level (e.g 70) Reversal Method : long when Purple arrow appear after arrows were below lower level (e.g 30) Trend Method : long when arrows cross above 50 level line , short when arrows cross below 50 level line. use higher ma and stochastic peri

Introducing the South African Sniper indicator created by a small group of traders with a few years trading trading the financial market profitably . This is a plug and play indicator that provides you with BUY and SELL (SNIPER ENTRY) signals with TARGET and trail stops. The indicator Works with all MT4 trading instruments. The indicator uses previous chart data as receipt to speculate on future market moves.
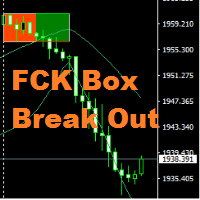
Hi All, " FCK Box Break Out " indicator is very simple indicator for new users. You can choose which indicators and timeframes you want to calculate. "FCK Box Break Out" provides the day's trend for buy/sell trades. Opposite side you the stop loss or hedging trade. NON-REPAINT Buy/Sell signals Recommendations Timeframes: Recommended - H 1 (Still, EA technically works on any Time frames ) Spread : up to 20 Recommended pairs: works on any metal, indices and currency pair

This indicator smoothes the value of CCI (Commodity Channel Index) and reduces its volatility. By using this indicator, the fluctuations created by the CCI indicator are reduced. The smoothed CCI value is placed in a buffer that you can use in your EA and strategy. Leave me a comment if you want By using this indicator, you no longer need to use the Moving Average indicator on the CCI indicator.
FREE
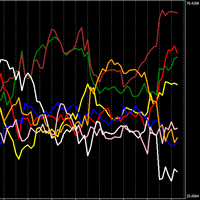
개별 통화의 강세를 보여주는 강력한 지표입니다.
높을수록 통화가 강해지고, 반대로 낮을수록 약해집니다.
거래 전략 N1: 선 교차점에서 오픈 포지션을 취하고, 한 쪽이 상승하고 다른 쪽이 하락할 경우 상승하는 통화에 대한 포지션을 오픈합니다.
거래 전략 N2: 가장 강한 통화를 매수하고 가장 약한 통화를 매도하는 오픈 포지션.
설정에서 기간을 변경할 수 있습니다. 저는 기본 기간(TIMEFRAME 1 HOUR)과 기간 24를 사용합니다. 또한 TIMEFRAME 1 MINUTE와 기간 1440을 사용합니다.
개별 통화의 강세를 보여주는 강력한 지표입니다. 높을수록 통화가 강해지고, 반대로 낮을수록 약해집니다. 거래 전략 N1: 선 교차점에서 오픈 포지션을 취하고, 한 쪽이 상승하고 다른 쪽이 하락할 경우 상승하는 통화에 대한 포지션을 오픈합니다. 거래 전략 N2: 가장 강한 통화를 매수하고 가장 약한 통화를 매도하는 오픈 포지션. 설정에서 기간을 변경할 수 있습니다. 저는
FREE

거래 속도는 시장에서 대량 주문이 언제 어디서 누적되는지, 그리고 이로 인한 이점을 보여주는 최고 품질의 지표입니다. 매우 초기 단계에서 추세 변화를 감지합니다. 이는 지표이자 동시에 트레이딩 시스템입니다. 이 개념은 독특하고 수익성이 매우 높습니다.
외환에서 틱 볼륨은 거래량이라고 오해의 소지가 있습니다. 실제로는 단위 시간당 가격 변동으로, 사실상 거래 속도입니다. 이 지표는 외환에서 볼륨에 대한 개념을 완전히 수정하여 올바른 방식으로 논리적으로 정의하고이 논리를 적용하면 독특하고 정확한 최상위 수익성 도구가됩니다. 속도가 증가하면 더 큰 관심과 그에 상응하는 진입 및 출구의 신호입니다.
사용 방법:
이 지표는 시장에서 거래 속도를 측정하고 비교하기 때문에 가장 먼저해야 할 일은 다음과 같습니다. 이러한 비교를 할 기간을 선택합니다. 일반적으로 15일 전이 비교를 위한 좋은 출발점입니다. 인디케이터에 날짜를 입력하고 실행합니다. 30분 또는 1시간의 기간에서 속도

거래 단말기의 현재 창에 늑대 파도를 검색하여 표시하도록 설계되었습니다. 거래에 늑대 파도를 사용하는 상인을위한 훌륭한 지표. 거래 전략에서의 적용은 효율성과 수익성을 크게 증가시킬 것입니다.
표시기에 대한 정보 다른 늑대 웨이브 지표와는 달리,웨이브 고원지 외환 지표는 크게 그 효과를 증가 기능을 가지고 있습니다:
첫 번째는 열린 창 5 점 매개 변수(진정한 값)정보 지원을 제공합니다,즉 늑대 파도가 나타난 차트의 창을 확장합니다. 예를 들어,유로화 차트가 열려 있고 각각에 웨이브 월드 표시기가 설치되어있는 경우 유로화 모델이 감지되면 해당 차트가 자동으로 다른 차트의 맨 위에 포 그라운드로 가져 오므로 많은 상품을 거래 할 때 매우 편리합니다. 두 번째 기능은 맥 디에 내장 된 발산 분석,사용자가 자신을 선택할 수있는 매개 변수(기본 설정(12,26,9))입니다. 그런데 일반적인 오실레이터의 값은 작업 창에 표시되지 않으며 점을 형성 할 때 가격 라벨의 색상에만 반영됩니다

Supreme Arrow는 RSI 및 구분 표시기 전략을 기반으로 하는 mt4용 화살표 표시기입니다.
이 전략은 인기 있는 시장에 적합할 뿐만 아니라 특히 스캘핑에 사용되는 경우 다양한 시장에서도 작동합니다.
권장 기간 : 언제든지
권장 추가 기능: 200 SMA
Supreme Arrow 표시기는 다시 칠하거나 다시 칠하지 않으며 신호가 지연되지 않습니다. --------------------------------------------------------------------------------------------------------------------------------------------------

MT4용 Crypto_Forex 지표 "트렌드 지그재그가 적용된 MACD"
- MACD 지표 자체는 트렌드 트레이딩에 가장 인기 있는 도구 중 하나입니다. - "MACD with Trend ZigZag"는 가격 액션 항목과 함께 사용하거나 다른 지표와 함께 사용하기에 매우 좋습니다. - 이 지표를 사용하여 가장 정확한 진입 신호를 선택합니다. _ MACD가 0(녹색) 위에 있고 지그재그 선이 위쪽이면 매수 가격 액션 패턴만 검색합니다. _ MACD가 0(분홍색) 아래에 있고 지그재그 선이 아래쪽이면 매도 가격 액션 패턴만 검색합니다. - 지표에는 모바일 및 PC 알림이 내장되어 있습니다.
// 뛰어난 트레이딩 로봇과 지표는 여기에서 확인할 수 있습니다: https://www.mql5.com/en/users/def1380/seller 이 MQL5 웹사이트에서만 제공되는 오리지널 제품입니다.

Trend analysis is perhaps the most important area of technical analysis and is the key to determining the overall direction of an instrument's movement. The Quest Trend indicator determines the prevailing trend. They help analyze the market on a selected time interval. Trends are based on the principle of higher highs, higher lows (for an uptrend) and lower highs, lower lows (for a downtrend). They can have different time periods and they can be related to each other like fractals. For example,

Trend Channel is a Forex trend arrow indicator for identifying potential entry points. I like it, first of all, because it has a simple operating mechanism, adaptation to all time periods and trading tactics. Created based on a regression channel with filters. We display the signals of the Trend Channel indicator on the price function chart using a mathematical approach.
How it works: when the price breaks through the overbought/oversold zone (channel levels), a buy or sell signal is generated

With this tool you can create some useful data in a CSV file.
You can:
- Determine time frame - the number of candles to be loaded - Name the file whatever you want - Select additional data sets to be loaded
The following data is written to a CSV file.
- Time when the candle was created. - Open price - Close price - High price - Low price
The following selection is also available to you:
- Volume - RSI (you can also select the period) - Moving Avarage (you determine the period and method)
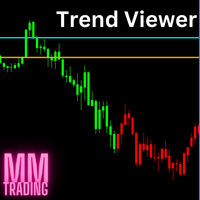
This indicator changes the color of the chart when prices are more bullish or bearish. It is recommended to use this indicator on small timeframes and only during peak trading hours. And don't forget your stop limit. This is not an oracle and not a holy grail.
In the settings, you can change the color of the candles and also their sentiment. To do this, use the Set 1 and Set 2 settings and test.
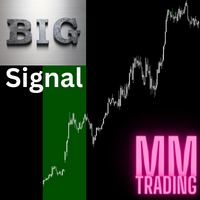
This is a multi-timeframe indicator that collects data from multiple time frames. It tries to identify the trend and predict a pullback. You have to understand that trends emerge suddenly and with that the pullback turns into a new trend. This is not a holy grail, always remember your stoploss. Use this indicator as a complement to your existing strategy.
The lines that are displayed on the chart can be changed so that they are only displayed in the indicator window and are therefore not distr
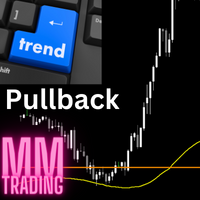
This indicator is not an ordinary moving avarage, even if it behaves similarly. I really like to use this to identify pullbacks. I only use this strategy once a day for one instrument, not more often. It is best if the price is further away from the line in the morning and when the pullback occurs, then you can create an entry setup using this indicator. Use additional indicators or use this as a supplement to your existing strategy.
This is not a holy grail. A pullback can quickly become a tr

The Flip Flop indicator tracks market trends, ignoring sharp fluctuations and market noise. The indicator can work both for entry points and as a filter.
The Flip Flop indicator displays information in a visual way. Helps in finding entry points during analysis. Suitable for trading on small time frames because it ignores sudden price spikes or corrections in price movements by reducing market noise around the average price.
This indicator is the author's implementation of the classic indicator Parabolic Support and Resist (PSAR). A time-tested product that allows you to not only determine entry/exit points but also reasonable levels for setting protective stop orders. The indicator has two customizable ranges, which allows you to identify long-term and short-term trends. The indicator does not repaint on the data history. The indicator has the ability to give signals and send notifications about them to e-mail and

Introducing the Consecutive Green/Red Candle Alert Indicator for MT4 - Your Trend Spotting Companion! Are you ready to take your trading to the next level? We present the Consecutive Green/Red Candle Alert Indicator, a powerful tool designed to help you spot trends and potential reversals with ease. Whether you're a new trader looking for clarity in the market or an experienced pro seeking additional confirmation, this indicator is your trusted companion. Key Features of the Consecutive Green/Re
FREE

Behaving in a similar fashion as the price action of a chart, the indicator uses " Trix " to opportune itself to the exposure of divergency, flat/low market volume, and price action expansion . The TRIX indicator nicknamed after the Triple-Exponential-average, is a momentum-based oscillator that filters minor price changes and fluctuations that are considered insignificant for forex trading whilst providing money making opportunities! Overall, TRIX is a leading indicator that shows diverge
FREE

Property of Vertical Capital Edition: Gugol_Quants About USA INDEXES QUANT_INDICATOR: This is a indicator created by math modulation to be used as a trading tool, which was developed in MQL. (MT4) This indicator is for use only with US500(S&P500), NAS100(Nasdaq Composite) and US30(Dow Jones). Signals are activated on "Open" Candle. It’s based on Intraday/Swing Trades whose main timeframe is H1, H2, H3 and H4. However you can use it with other assets by testing with the appropriate settings. *
FREE

WONNFX create arrow tester. Сonstructor/Tester. Tester for buffer indicators. Converting a buffer indicator into an arrow signal on the chart. Combining two buffer indicators into one arrow signal. Filter by candle color. You can move the arrow signal several bars forward (useful in cases where the indicator gives signals 2-3 bars late
"WONNFX create arrow tester" is a tool designed specifically for traders who use buffer indicators in their trading strategies. This tester converts the buffer
FREE

This is the finest structure marking you will ever find in any market. indicator is coded considering the actual structure any trader would use. indicator is coded based on actual candle breaks and not coded based on any pivot or predefined values or specific number of candles high and low. please check out the screenshot. if you want me to fine tune it according to your needs then i am open for it. IMPORTANT A demo version of an indicator cannot be run and seen on an online chart. Its behavior

This indicator softens the value of the RSI (Relative Strength Index) and reduces its volatility. You can use this indicator in your expert advisors, indicators and strategies. With this indicator, you don't need to have two indicators on the chart at the same time. For example, an RSI indicator and a Moving Average indicator If you have any questions or concerns, contact me.
FREE
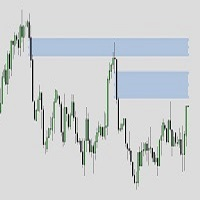
ICT Fair value gapes / Balanced price ranges it marks the fvgs i.e., bisi and sibi both filled and unfilled based on your requirements. it can work on mtf while your on any other time frame i.e., seeing on 5 min. you can watch from filled (BPRs) to unfilled (imbalances) of monthly/weekly/daily/H4/H1 to your likings It can be using multiple times using unique ID with buttons option to on and off the required TF or keeping them all.
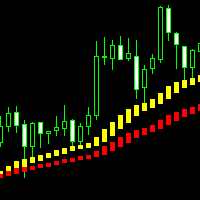
这是 一款可以直观识别波段趋势的分析指标,手工交易最佳选择,不重绘不漂移。 适应任何新手和量化交易的朋友。 参数设置(您购买指标后若不知道如何使用,请私信我): 快线: g_period_88 20
慢线: g_period_88 40
===========交易信号 ===========
快线:黄/蓝线;慢线:红/绿线 多头方向:快线上穿慢线,快线在慢线上方 空头方向:快线下穿慢线,快线在慢线下方
做多信号: 当快线上穿慢线形成一轮多头方向时,首轮多单进场条件为出现两根以上连续阴线,第3根以上K线出现一根阳线,且收盘价格在慢线上方,慢线为红线,即可成交第一单多单,同时如果满足价格回踩触碰到快线,出现一条阳线,且收盘价格在慢线上方,慢线为红线时,也可成交第一单多单;当第一轮多单结束后,此轮多头方向的多单只能满足价格回踩触碰到快线后,出现一条阳线收盘价格在慢线上方,慢线为红线时,才可继续做多进场,即不管快线是黄线或蓝线,只要阳线收盘价格在慢线上方,慢线为红线时就可以做多进场;当快线在慢线上方,阳线收盘价格在慢线上方,但慢线为绿线时,则不进场
做空信号: 当快线下穿慢线形成一
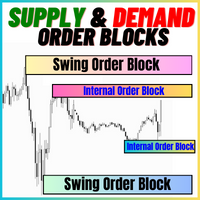
공급 및 수요 주문 블록:
"공급 및 수요 주문 블록" 인디케이터는 외환 기술 분석에 중요한 스마트 머니 개념을 기반으로 한 정교한 도구입니다. 이는 공급 및 수요 영역을 식별하고, 기관 트레이더가 중요한 흔적을 남기는 핵심 영역을 집중 조명합니다. 판매 주문을 나타내는 공급 영역과 구매 주문을 나타내는 수요 영역은 트레이더가 가격 움직임의 잠재적인 반전이나 둔화를 예상하는 데 도움을 줍니다. 이 인디케이터는 브레이크아웃 오브 스트럭처 (BoS)와 페어 밸류 갭 (FVG) 구성 요소를 결합한 똑똑한 알고리즘을 사용합니다. BoS는 시장 교란을 감지하고, 잠재적인 주문 블록을 지적하는 반면, FVG는 정확성을 향상시키기 위해 공정 가치 갭을 고려합니다. 이 도구는 이러한 조건을 시각적으로 나타내어 트레이더가 결정을 내리는 데 도움을 줌으로써 잠재적인 주문 블록을 강조하고 시장 역학 및 전환점에 대한 통찰력을 제공합니다. 사용자 친화적인 디자인으로 다양한 기술 지식 수준의 트레이더에
FREE

우선적으로 이 거래 시스템은 다시 그리지 않고, 다시 그리지 않으며, 지연되지 않는 것을 강조할 가치가 있습니다. 이는 전문적인 거래에 이상적입니다. 온라인 강좌, 사용자 매뉴얼 및 데모. "스마트 서포트 앤 레지스턴스 트레이딩 시스템"은 새로운 및 경험 많은 트레이더를 위해 개발된 고급 지표입니다. 이 시스템은 외환 시장에서 정밀도와 신뢰감을 제공합니다. 이 포괄적인 시스템은 일일 거래 전략, 스윙 거래 전략, 지원 및 저항 전략, 캔들스틱 패턴 전략, VWAP 전략, 다중 시간대 추세 전략 등을 포함한 7개 이상의 전략, 10개의 지표 및 다양한 거래 방식을 결합합니다. 이 시스템은 화살표 신호, 진입 및 출구 지점, 거래 경보, 높은 시간대 추세 분석, 실시간 거래 모니터링 및 트렌드 및 볼륨 캔들 색상 제공합니다. 자동 지원 및 저항 감지로 다양한 시장 상황에서 신중한 결정을 돕는 다면적 인 지표입니다.
스마트 서포트 앤 레지스턴스 트레이딩 시스템은 프리미엄 및 강력한 지

신호 거래 지표 바다 촛불은 위치를 열 신호를 생성,씨 캔들 오실레이터를 사용하여 가격 움직임의 방향을 결정한다. 상품 채널 지수[중앙 거래소]—이동 평균에서 가격의 편차를 측정합니다. 가격이 새로운 최고치에 도달하고 중앙은행이 이전 최고치를 초과할 수 없을 때 차이가 나타납니다. 이 고전적인 차이에는 일반적으로 가격 수정이 따릅니다. 일반적으로 100 이내입니다. 100 위/아래의 값은 과매 수/과매도 상태 및 시정 증가 확률에 대해 알려줍니다.
표시기에 대한 정보 이 표시기는 촛대 형태로 표시되며,이는 시장 상태에 따라 4 가지 색상으로 칠해집니다.
또한 편의를 위해 표시기에 존재하는 모든 색상이 주 메뉴에서 만들어집니다.
표시기는 터미널,전화,메일에 알림을 제공합니다. 색상 변화에 따라 트리거되는.
표시기 사용 방법 표시의 색상에 따라,우리는 구매 또는 판매. 모든 경우에 대해 알림이 제공됩니다.
당신은 색상과 그들이 스크린 샷에서 무엇을 의미하는지 자세히 살펴

고급 암표상 외환 지표는 스캘핑 거래뿐만 아니라 과매도 및 과매 수 수준을 기반으로 한 공식입니다. 이 표시기는 모든 통화 쌍에서 작동합니다,
암호화폐,주식,지수. 귀하의 요구에 맞게 사용자 정의 할 수있는 보편적 인 지표는 어떤 거래 전략에서도 결코 불필요하지 않을 것입니다.
표시기에 대한 정보 고급 암표상 외환 표시기는 눈을 다치게하지 않는 색상 히스토그램의 형태로 제공되며 인식하기 즐겁습니다.
시장 상황에 따라 어떤 변화가 있고 시장이 어떤 상황에 처해 있는지 항상 이해할 수 있습니다.
고급 암표상 화살표 외환 표시기는 고급 매개 변수를 가지고 있으며 신호를 다시 그리지 않습니다.
나는 추세 지표와 함께 사용하고 현재 추세의 방향으로 독점적으로 거래를 여는 것이 좋습니다.
지표를 구입 한 후,저에게 연락이 표시와 함께 작동 할 수있는 좋은 추세 지표를 얻을 수 있어야합니다!
표시기 사용 방법 고급 암표상 표시기는 네 가지 유형의 신호를 제공합니다:
과매 수

Gold Channel is a volatility-based indicator, developed with a specific timing algorithm for the XAUUSD pair, which consists of finding possible corrections in the market.
This indicator shows two outer lines, an inner line (retracement line) and an arrow sign, where the theory of the channel is to help identify overbought and oversold conditions in the market.
The market price will generally fall between the boundaries of the channel. If prices touch or move outside the channel it is a tradi
거래 지표는 예상되는 추가 채널 라인뿐만 아니라 가격 차트에 지원 및 저항 라인을 독립적으로 구축합니다.
표시기에 대한 정보 표시기에는 지원 수준(파란색으로 표시)과 저항 수준(빨간색으로 표시)이 있습니다. 표시기는 또한 더 많은 형성 지원 수준을 가지고 있습니다(이러한 수준은 앞서 언급 한 색상으로 스트로크로 제공됩니다).
내부 지원 수준(녹색으로 표시)과 저항 수준(분홍색으로 표시)도 있습니다. 그들이 방해하는 경우 원하는 경우,당신은 그들을 해제 할 수 있습니다.
주황색 수직 시작 선은 기록을 따라 이동할 수 있으며 선은 자동으로 다시 그려집니다(다시 그려지지 않은 경우 그래프 업데이트).
오른쪽 상단 모서리에는 지원 및 저항 라인 수가 표시됩니다.
표시기는 모든 통화 쌍,암호 화폐 및 주식에서 작동합니다. 모든 시간대에.
표시기 설정 첫 번째 막대=1;//초기 선 구성 막대(수직선 좌표 시작)
삼각근=3;//막대의 최소 선 크기
인 라인=참;//우리가

2 SNAKES is a first class scalping system. As the entries are quite precise, you are likely to become addicted to this system very quickly. You have 2 snakes. When you see a candle above or below them that does not touch them - that is your scalping signal.
Then buy or sell at the green line or close. If you use a larger time frame, scalping can become trend following.
The snakes are calculated precisely in relation to the current state of the market. They ARE NOT moving averages.
You decide

Quarterly Cycles
Quarterly Cycles is based on the Quarterly Theory developed by Daye ( traderdaye on X ) T his is an aid to the user to find Cycles and it is NOT automatic detected, user can select AMDX or XAMD in each Cycle and it will be visually draw on the chart. Quarterly Cycles: Yearly, Monthly, Weekly, Daily, 6 Hour (90 minutes)
Yearly Cycle: The year is divided in four sections of three months each Q1 - January, February, March Q2 - April, May, June Q3 - July, August, September Q4 -

Market Cycles 는 신경망을 사용하여 현재 시장 단계를 결정하는 고유한 독점 지표입니다.
훈련을 위해 신경망은 순환(역전) 패턴을 사용합니다.
통화 시장은 약세에서 강세 기간으로 그리고 다시 그 반대로 순환하는 경향이 있습니다.
이 제품에서는 4개의 타임프레임(M5, M15, M30, H1)의 패턴을 결합하여 신호의 정확도를 크게 높일 수 있었습니다!
Market Cycles 는 EURUSD 통화 쌍, M30 기간에 사용해야 합니다!
지표의 이점 이 독특한 개발은 시장에 유사품이 없습니다. 저렴한 가격. 개발자의 영구적인 기술 지원. 표시기에는 설정이 없으며 구성할 필요가 없습니다. 편리한 신호 알림 시스템: 경고 및 푸시. 수익성 있는 거래의 높은 비율. 예를 들어, 통화 쌍인 EURUSD의 경우 지난 1년 동안 거래의 81%가 이익으로 마감되었습니다. 우리 제품을 설치하기만 하면 필수 불가결한 제품임을 스스로 알게 될 것입니다!
중요한!!! Market C
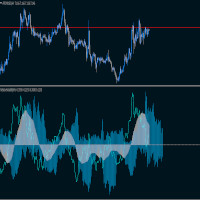
The indicator shows the deviation of the moving average relative to the volatility leading half of its period.
The red histogram shows the moving average relative to the anchor point.
The blue histogram shows volatility relative to the leading half
of the moving average.
The blue line simulates the price relative to the moving average.
The indicator is perfect for both grid trading and trend trading.
The signal does not change when the timeframe changes

Scanning Multi Symbols Scalping Signals based on 3 kinds of Market Analysis methods. Trend, Signal, and Reversator. And each method consists of its own multi timeframes algorithm functions. Summarized to become clear signals direction BUY/SELL, including the signals strength scoring and sending message to all available alert tools. Displayed on a User Friendly and customizable Dashboard. Size, colors, coordinates, highlight, hidden/show and more. Base Timeframe: M15. And M5 to Daily to confirm
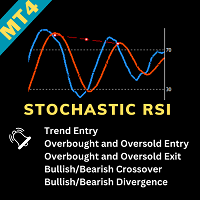
Stochastic RSI Indicator - Master the Art of Timing Elevate your trading game with the "Stochastic RSI Indicator." This powerful tool marries the Stochastic oscillator with the Relative Strength Index (RSI), offering precise insights into market dynamics. It's your key to mastering the art of timing in trading. About the Indicator : The Stochastic RSI Indicator combines two robust indicators - Stochastic and RSI - to provide traders with an exceptional tool for identifying entry and exit points
FREE
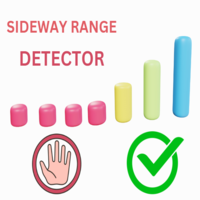
This indicator uses a formula based on bollinger bands to determine if the market is in Range or not. It can be used to filter entries and not operate in a sideways market.
It has a minimum value of 0.2 from which it could be operated, although you can modify it in the options to adjust it to your trading style or the market you use.
If the histogram below is red, the market is in range, if it is green, volatility is higher.
FREE
The Bollinger Bands Multicurrency Scanner Dashboard MT4 is a versatile tool for monitoring trading signals across multiple currency pairs and timeframes using Bollinger Bands. It organizes signals in an intuitive grid format, displaying each symbol’s status across timeframes from M1 to MN1. Traders can enable or disable specific timeframes to suit their strategies. You can find the MT5 version here Bollinger Band Scanner MT5 For detailed documentation click here Bollinger Bands Strategie

Introducing the Super Pivot and Fibo Indicator: Your Ultimate Trading Companion Are you ready to take your trading to the next level? The Super Pivot and Fibo Indicator is here to revolutionize your trading strategy. This powerful tool combines key elements such as pivot points, Fibonacci retracement and extension levels, high-low values, and Camarilla points to provide you with a comprehensive and accurate analysis of the market. Key Features: Pivot Points: Our indicator calculates daily, weekl
FREE

The indicator detects market efficiencies and inefficiencies by studying price movements and marks candles where the best efficiencies occurred. The most 'efficient' candles are indicated with a vertical bar histogram. Taller bars represent these candles. The highs and lows of these candles are supply and demand areas, important levels that will be retested in the future. It can be used on all time frames with the same settings.
FREE

Std Channels The Std Channels Indicator is a technical indicator that uses standard deviation to create five channels around a price chart. The channels are used to identify support and resistance levels, as well as trends and reversals. The indicator is calculated by first calculating the standard deviation of the price data over a specified period of time. The channels are then created by adding and subtracting the standard deviation from the price data. The five channels are as follows: Upper
Support Resistance Tracking Indicator The Support Resistance Tracking Indicator is a technical analysis tool that helps traders identify and track support and resistance levels. It is a valuable tool for traders of all levels, from beginners to experienced professionals. How it works The Support Resistance Tracking Indicator uses a variety of methods to identify support and resistance levels. These methods include: Historical price action: The indicator looks for price levels where the market

Auto Channel Trend The Auto Channel Trend Indicator is a technical analysis tool that automatically draws trend channels on any chart. It uses a simple algorithm to identify the trend direction and then draws two parallel lines that represent the support and resistance levels of the channel. Features: Automatic trend channel drawing Support and resistance levels Trend direction identification Customizable parameters How to use: Add the indicator to your chart. Adjust the parameters to your likin

This script automatically calculates and updates ICT's daily IPDA look back time intervals and their respective discount / equilibrium / premium, so you don't have to :) IPDA stands for Interbank Price Delivery Algorithm. Said algorithm appears to be referencing the past 20, 40, and 60 days intervals as points of reference to define ranges and related PD arrays. Intraday traders can find most value in the 20 Day Look Back box, by observing imbalances and points of interest. Longer term traders c

Support and Resistance Barry Indicator - Your Path to Precision Trading Explore the world of precision trading with the "Support and Resistance Barry Indicator" for MetaTrader 4. This robust tool is designed to help you identify key support and resistance levels with exceptional accuracy, enhancing your ability to make well-informed trading decisions. Basic Details : Indicator Type : Support and Resistance Barry Indicator Key Metrics : Real-time identification of crucial support and resistance l
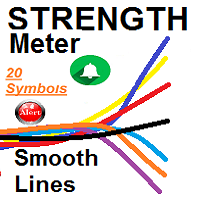
SMOOTH STRENGTH METER INDICATOR (SMOOTH LINE) it draws Currencies TREND Volatility Power / Strength lines : - Detects the 2 highly TRENDED Volatile pairs ( will be the Bold Lines ) - A very Helpful Indicator - It draws smooth lines for up to 20 currencies pairs representing Volatility strength and power - First it indicates the most powerful trended direction pairs : Strongest / Weaker - MAIN FUNCTION :it gives indication of the UP trend most Volatile Line and the

The GGP Wave Trend Oscillator MT4 Indicator is a volatility and momentum tool designed to help traders optimize their trading performance and providing traders find the most accurate market reversals. This indicator is MT4 conversion of the Indicator: WaveTrend Oscillator [WT] by “ LazyBear “ in Trading View website and some alert methods are added to provide real-time alerts when a trading signal is generated, in order to allow traders to act quickly and efficiently. When the oscillator is ab

The GGP ADX and DI MT4 Indicator is used to quantify trend strength. ADX calculations are based on a moving average of price range expansion over a given period of time. This indicator is MT4 conversion of the ADX and DI Indicator by “BeikabuOyaji “ in Trading View website and some alert methods are added to provide real-time alerts when a trading signal is generated, in order to allow traders to act quickly and efficiently. For MT5 version please click here . ADX is plotted as a single line w

The Forex Smart System is a user-friendly and intuitive trading solution designed to empower traders in the complex world of forex trading. With a focus on simplicity and practicality, this system offers a streamlined approach that makes it accessible to traders of all experience levels. User-Friendly Interface: The Forex Smart system is designed with simplicity in mind, making it accessible to traders of all experience levels. Its intuitive interface ensures that users can focus on trading rath

To get access to MT5 version please click here . Also you can check this link . This is the exact conversion from TradingView: "UT Bot" by "Yo_adriiiiaan". The screenshot shows similar results from tradingview and Metatrader when tested on ICMarkets on both platforms. This is a light-load processing indicator. This is a non-repaint indicator. Buffers are available for processing in EAs. All input fields are available. You can message in private chat for further changes you need. Thanks for downl
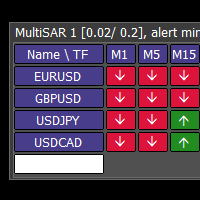
This tool monitors Parabolic SAR indicators on all time frames in the selected markets. Displays a table with signals to open a BUY trade (green) or SELL trade (red). You can easily add or delete market names / symbols. If the conditions for opening a trade on multiple time frames are met, you can be notified by e-mail or phone message (according to the settings in MT4 menu Tools - Options…) You can also set the conditions for sending notifications. The list of symbols/ markets you have entered
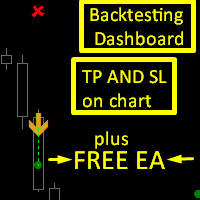
Ambitious Donchian EA can be downloaded from comment section but it need the ambitious donchian indicator to work.
Ambitious Donchian is a Donchian Channel and XO histogram based indicator that gives buy and sell signals in form of up and down arrows with tp and sl as objects on chart.
features :
1. Tp and Sl for each signal , the tp and sl can be selected as based on points or ATR value from indicator settings.
2.backtesting dashboard : the dashboard shows the following according to your input

Homemade Indicator using specific price action system to find suitables buys and sell ideas. *It is very easy to use *Ideal on 5mn timeframe (where i personnally use it)
*It does NOT repaint *It works on every timeframes
*There are a lot of setups of buys and sell everyday *The loss are VERY smalls compared to profits
*It works very well on volatile markets
More ideas to come soon : -Possibilities of changing setups
-Take profits spot -Alerts -etc...
MetaTrader 플랫폼 어플리케이션 스토어에서 MetaTrader 마켓에서 트레이딩 로봇을 구매하는 방법에 대해 알아 보십시오.
MQL5.community 결제 시스템은 페이팔, 은행 카드 및 인기 결제 시스템을 통한 거래를 지원합니다. 더 나은 고객 경험을 위해 구입하시기 전에 거래 로봇을 테스트하시는 것을 권장합니다.
트레이딩 기회를 놓치고 있어요:
- 무료 트레이딩 앱
- 복사용 8,000 이상의 시그널
- 금융 시장 개척을 위한 경제 뉴스
등록
로그인
계정이 없으시면, 가입하십시오
MQL5.com 웹사이트에 로그인을 하기 위해 쿠키를 허용하십시오.
브라우저에서 필요한 설정을 활성화하시지 않으면, 로그인할 수 없습니다.