MetaTrader 4용 새 기술 지표 - 52

The MaxandMin Indicator when used with the Super Canale Indicator gives strength to the input signal. When the arrow of this indicator appears with that of the Super Channel the signal is input, when it appears alone the signal is alert. You can also use this indicator with price action to define the true highs and lows of the price. Its use with the Super Canale indicator gives an additional warning signal or profitable entry.
The Variations Moving Average indicator has eight types of non-standard moving averages.
Double MA - DMA Triple MA - TMA Hull MA - HMA Jurik MA - JMA Adaptive MA - AMA Fractal Adaptive MA - FAMA Volume Weighted MA - VWMA Variable Index Dynamic MA - VIDMA
Works as a trend indicator. Indicator settings Type MA Shift MA Show Trend Period MA Method MA Applied Price MA Color MA
FREE

이 대시보드는 선택한 심볼에 대해 사용 가능한 최신 고조파 패턴을 표시하므로 시간을 절약하고 더 효율적으로 사용할 수 있습니다 / MT5 버전 .
무료 인디케이터: Basic Harmonic Pattern
인디케이터 열 Symbol : 선택한 심볼이 나타납니다 Trend : 강세 또는 약세 Pattern : 패턴 유형(가틀리, 나비, 박쥐, 게, 상어, 사이퍼 또는 ABCD) Entry : 진입 가격 SL: 스톱로스 가격 TP1: 1차 테이크프로핏 가격 TP2: 2차 테이크프로핏 가격 TP3: 3차 테이크프로핏 가격 Current price: 현재 가격 Age (in bars): 마지막으로 그려진 패턴의 나이
주요 입력 Symbols : "28개 주요 통화쌍" 또는 "선택한 심볼" 중에서 선택합니다. Selected Symbols : 쉼표로 구분하여 모니터링하려는 원하는 심볼("EURUSD,GBPUSD,XAUUSD")을 선택합니다. 브로커에 쌍에 접미사 또는 접두사가

표시기는 지정된 영역(BOX)의 수평 볼륨 프로파일과 최대 볼륨(POC)을 표시합니다.
제품 특징. 1. 틱 또는 가격만 사용할 수 있습니다. 2. 적응 그리드 간격(M1-MN). 3. 상자 크기에 따른 적응형 대용량(중앙값) 검색 단계. 4. 상자 라인과 버튼의 자동 카멜레온 색상. 5. 생성 및 삭제가 용이한 다중 상자. 6. 70% 볼륨 영역(설정에서 활성화됨). 7. 최대 수평 볼륨 라인(POC) 터치에 대한 경고가 있습니다. 8. VWAP. 9. 제어 패널.
볼륨 프로필 표시기로 시장을 탐색하십시오. 나는 그것을 위해 그것을 했지만 이제 당신도 사용할 수 있습니다.
주요 설정. Calc Histo Mode – 히스토그램 계산 방법 (Market Profile – 가격으로 계산, Tick Volume Profile – 틱으로 계산). Mode Step In Pips – 핍으로 중앙선 계산. Vertical Step – 히스토그램의 수직 단계(줄 사이의 거리(핍)).

진정한 수급 지표 - 모든 시간대에서 저항 및 지지 수준의 위치를 빠르게 결정할 수 있습니다. 이 지표는 거래에서 기술적 분석을 사용하는 사람들에게 유용합니다. 표시기는 사용하기 쉽고 차트에서 끌어다 놓기만 하면 표시기가 가장 가능성 있는 지지 및 저항 수준을 표시합니다. 기간을 전환하면 새로 선택한 기간의 수준이 표시됩니다.
추천 로봇 스캘퍼 - 테스트 .
입력 매개변수 Use_price 레이블 - 켜기 /끄다 레벨 근처에 가격 아이콘 표시 가격 수준 색상 - 가격 아이콘의 색상을 선택합니다. 가격 수준 크기 - 가격 아이콘 크기 지원/저항 레벨 색상 - 레벨 색상 선택 내 구독 페이지 , 나는 다른 많은 유용한 제품을 가지고 있습니다. 이 지표가 마음 에 든다면 리뷰를 남겨주세요. 유용한 제품을 무료로 공유할 수 있는 원동력이 됩니다.

붐 및 충돌 스파이크 감지기 표시기는 주로 가격에서 붐 및 충돌을 감지하기 위한 고급 전략을 기반으로 코딩됩니다. 가격에서 높은 확률의 붐 및 충돌을 감지하기 위해 복잡한 알고리즘이 이식되었습니다. 잠재적인 붐 또는 충돌 단계에 대해 경고합니다.
붐 단계: 가격이 너무 빠르게 상승할 때. 충돌 단계: 가격이 너무 빠르게 하락하는 경우.
기간 한정 제공: 표시기는 30$ 및 평생 동안만 사용할 수 있습니다.
주요 특징들
푸시 알림을 휴대폰으로 보냅니다. 컴퓨터 또는 노트북에서 팝업 및 소리 경고 다시 칠하지 않는 화살표를 표시합니다(잠재 붐의 경우 위쪽 화살표, 잠재적 충돌의 경우 아래쪽 화살표). 모든 쌍으로 작업합니다.
추천
기간: H1 및 H4 추천 쌍 : 추세 단계의 쌍.
연락하다
질문이 있거나 도움이 필요하면 비공개 메시지를 통해 저에게 연락하십시오.
작가
SAYADI ACHREF, 핀테크 소프트웨어 엔지니어이자 Finansya의 설립자.

The indicator signals the appearance of a possible divergent bar based on the shape of the bar without angulation detection. A bullish divergent bar is a bar that closes in its upper half (the higher the better), has a lower minimum than the previous bar, and drops sharply away from the Alligator indicator. A bearish divergent bar is a bar that closes in its lower half (the lower the better), has a higher high than the previous bar, and moves up sharply from the Alligator.
SETTINGS History - h

Scalping Snake Pro is a unique scalping indicator that shows the trader the price reversal moments and does not redraw. This indicator, unlike many others on the Internet, does not redraw its values. It draws signals on the very first bar, which allows you not to be late with opening deals. This indicator sends notifications to the trader by phone and email when a signal appears. You get all this functionality for only $147.
How to trade with this indicator? Open the H1 timeframe. Currency pa
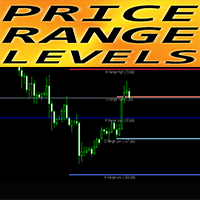
MT4에 대한 외환 지표 "Room_UP_DWN_Day_Week_Month" 표시기 " Room_UP_DWN_Day_Week_Month "는 매우 유용한 보조 표시기입니다. 가격(가격 범위 수준)별로 도달할 수 있는 가장 가능성이 높은 수준을 일간, 주간 및 월간으로 보여줍니다. 일일 범위는 일중 거래자에게 유용합니다. 주간 및 월간 범위는 스윙 및 장기 트레이더를 위한 것입니다. 표시기는 이익 실현 목표를 계획하거나 손절매를 조정하는 데 탁월합니다.
// 더 훌륭한 전문가 자문 및 지표는 여기에서 확인할 수 있습니다: https://www.mql5.com/en/users/def1380/seller // 또한 수익성 있고 안정적이며 신뢰할 수 있는 신호 https://www.mql5.com/en/signals/1887493에 참여하실 수 있습니다. MQL5 홈페이지에서만 제공되는 오리지널 제품입니다.

Scalping Points Pro is an indicator that shows possible price reversal points on the chart and does not redraw its signals. Also, the indicator sends signals to the trader via Email and Push. The accuracy of the signals of this indicator is approximately 92-94% on the M5 timeframe and more than 95% on the H1 timeframe. Thus, this indicator allows the trader to accurately open trades and predict further price movement.
The indicator does not redraw its signals. The indicator works on timefram

MT5 Version Elliot Wave Oscillator MT4 Elliot Wave Oscillator MT4 is an indicator designed to support Elliot Wave counts. The default settings help filtering out the noise in the market allowing a clear perception for the waves counts in differnt timeframes. Elliot Wave Oscillator high customization level allows the you to optimize this indicator to your personal preferences. Shorter Periods and faster reactive MAs will provide more infomation but will require a higher level of experience for
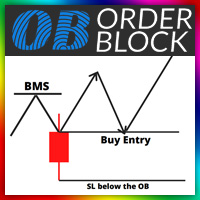
Orde Block Detector: The order block detector can automatically identify the breakthrough of the market structure. After the trend framework breaks through, the order block area can be drawn automatically. In order to draw the OB area more accurately, we also automatically find the candle on the left and right sides of the original candle according to its trading principle, and draw a more accurate ob area through more subtle quantitative rule judgment. Futures : 1. Customize the BMS color, and

Bollinger Bands Breakout Strategy has an Arrows and Scanner Dashboard indicator set. It is for MT4 (Metatrader 4) platform.
When price breaks out of a Bollinger Outer Band in a powerful way, it becomes a great position for scalping. Because the next few bars will most likely keep going in the same direction. Especially if Middle band is also sloping towards that breakout. It's also great for Binary options when using 2-3 next few bars.
Strategy: BUY Bollinger Bands:
- Price breaks out of

The indicator signals the appearance of a possible divergent bar based on the shape of the bar and its standard deviation from the Alligator indicator. A bullish divergent bar is a bar that closes in its upper half (the higher the better), has a lower minimum than the previous bar, and drops sharply away from the Alligator. A bearish divergent bar is a bar that closes in its lower half (the lower the better), has a higher high than the previous bar, and moves up sharply from the Alligator. Stand
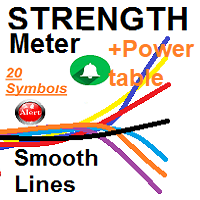
separate indicator window for Currencies Strength smooth lines for up to 20 symbols based on (5) time frames &&& MAIN Window Power TABLE for up to 20 Symbols for (5) timeframes and the Total calculated Symbols strength for each
1- Currencies Strength - It draws smooth lines for up to 20 currencies pairs representing Volatility strength and power calculated by 5 selected time frames not only ***Works on any Time frame but i recommend from M15 M30 H1 .... (lowest frames need higher index of
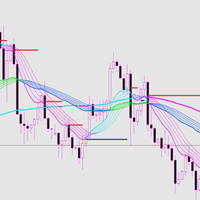
This indicator has good trend malleability and a good trend resistance support line. Index characteristics The color changes, following the trend of different levels. The support and resistance line means that the price follows or reverses.
Basic display A price tag showing historical support and resistance. Shows the approximate recommended range of historical entry positions, as well as take-profit and stop-loss recommendations, and target forecasts. Display the judgment of the current direc
Binary Strong Indication Indicator is Designed Based on 14 Different Strategies Based. You can Use Binary Strong Indication Indicator for Binary Option Trading or if you want you can Try it for Forex. Time-Frame : M1 Depend on your choice on which time frame you want to get Indication. Trade Time Duration: 60 Seconds or 5 Minutes Mostly we Used it for 60 seconds in iq option but you can use it for any binary broker. Input Parameters : HLB = 30 it means Highest & Lowest Point of 30 Bars. This Val

지원 및 저항 수준 찾기 도구:
지원 및 저항 수준 찾기는 거래에서 기술적 분석을 향상시키기 위해 설계된 고급 도구입니다. 동적 지원 및 저항 수준을 갖추고 있어 차트에서 새로운 키포인트가 펼쳐짐에 따라 실시간으로 적응하여 동적이고 반응이 빠른 분석을 제공합니다. 독특한 다중 시간대 기능을 통해 사용자는 원하는 시간대에서 다양한 시간대의 지원 및 저항 수준을 표시할 수 있으며, 5분 차트에 일일 수준을 표시하는 등 세밀한 시각을 제공합니다. 역사적 데이터 세트를 포함한 스마트 알고리즘을 사용하여 다른 S&R 지표와 차별화되는 포괄적인 분석을 보장합니다. 수준을 감지할 때 다중 매개변수 계산을 사용하여 정확성을 높입니다. 사용자는 지원 및 저항 수준의 색상을 개별적으로 사용자 정의하여 개인화된 시각적 경험을 만들 수 있습니다. 도구에는 가격이 중요한 수준에 접근할 때 거래자에게 알림 기능이 포함되어 시기적절한 결정을 돕습니다. 숨기기 및 표시 버튼과 수준의 가시성을 빠르게 전환하
FREE

표시기는 실시간으로 구매 및 판매 신호를 제공합니다. 주요 추세에 따라 방향을 선택할 때 신호의 약 75-80%가 이익으로 처리됩니다. 물론 모든 신호는 차트에 남아 자신의 위치를 변경하지 마십시오,그래서 당신은 쉽게 역사와 전략 테스터 모두 표시의 작동을 테스트 할 수 있습니다. 표시기 설정은 간단하고 논리적입니다:속도 매개 변수는 신호의 수와 주파수를 담당하고,최적의 값은 작업 기간에 따라 10 에서 40 사이이며,히스토리 매개 변수는 신호가 표시 될 히스토리의 막대 수를 담당합니다. 이 매개 변수의 값이 너무 높으면 터미널의 부하가 증가 할 수 있습니다. 다른 매개 변수는 경고 및 알림과 관련이 있습니다. 이 지표는 보편적이며 모든 시간대에서 작동하며 모든 트렌드 전략과 완벽하게 결합하여 운동 시작과 트렌드에 대한 위치를 구축하는 데 매우 높은 품질의 진입 점을 제공합니다. 입력 자체는 신호 막대의 고장 또는 신호가 나타날 때(덜 안정적으로)직접 발생할 수 있습니다. 나는 신

Scalping channel - indicator of price movement direction. Where the channel looks, the price moves there. When the channel looks down and the price is at the top of the channel, we open a sell trade. When the channel looks up and the price is at the bottom of the channel, we open a buy deal. This is a simple scalping strategy for intraday trading on M1, M5, M15, M30 timeframes.
Everyone who buys this indicator will receive a scalper robot as a gift, which trades on this indicator automaticall
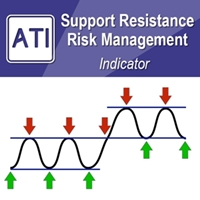
Introduction to Support Resistance Risk Management Support Resistance is the most trusted technical analysis. However, the risk management for the support and resistance is not practiced often. Hence we provide one effective risk managment method for the support and resistance trader. In the book: Scientific Guide To Price Action and Pattern Trading (Wisdom of Trend, Cycle, and Fractal Wave), how to use Support Resistance is described as well as Fibonacci Analysis, Harmonic Pattern, Elliott Wave

Contact me after payment to send you the User-Manual PDF File. Volume Profile Indicator A functional and useful tool that can improve your trading plan.
This indicator calculates volume in price levels(typical volume indicator shows only candle volumes).
With the volume of price levels, you can identify important areas that have the potential to reverse. You can also see the volume of support and resistance levels and decide on them.
Using volume profiles along with Price Action and
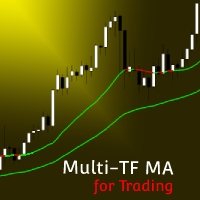
MT5 Version Multi Timeframe MA MT4 Multi Timeframe MA MT4 is an indicator that offers the representation of up to 3 MAs with different Periods and Timeframes. This allows the user to reprensent in one chart and timeframe information coming from other timeframes and get notified as any of the MAs crosses another one. Multi Timeframe MA is the first indicator in the market that offers Multi Timeframe interactions and a high customization level from up to 7 different MA types (SMA, EMA, WMA,

This strategy is best used for Trend based trading. While market is trending, price still makes smaller ranges. Darvas boxes show breakouts from these small ranges, while still following the original market trend. Detailed Description: https://www.mql5.com/en/blogs/post/747919
Features:
Darvas - Check Darvas Box Breakout
- Check Price Above/Below MA or Darvas Box has crossed MA
- Min, Max Box Height
- Max Distance Between Entry Price and Darvas Box
Other Indicators:
- NRTR Tren
KT Bollinger Shots works using a striking blend of the slingshot pattern and the mean-reversion phenomenon applied to financial markets.
In addition, a mathematical algorithm is used with variable deviation to fine-tune the indicator's signals on a different level.
Winning Trade: After a signal, if price touches the middle band in profit, it is considered a winner. Losing Trade: After a signal, if price touches the opposite band or touches the middle band in loss, it is considered a loser.
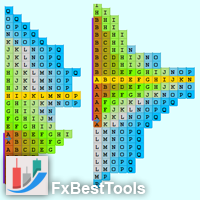
Definition : A Market Profile is an intra-day charting technique (price vertical, time/activity horizontal). Market Profile is best understood as a way to see order in the markets. Market Profile was a way for traders to get a better understanding of what was going on, without having to be on the trading floor. The current indicator is developed based on Easy-to-Use architecture including a wide range of visual settings.
Major Features of Indicator : Various Views of Market Profile The indica
Advanced Indicator Scanner is a multi-symbol multi-timeframe scanner that works with hundreds of custom indicators available across the web including mql5 website market and codebase indicators.
Advanced Indicator Scanner features:
Scans your indicator in 28 customizable instruments and 9 timeframes. Monitors up to 2 lines(buffers) of an indicator. Showing of indicator value on buttons. You can choose between 3 alert modes: Single symbol and timeframe Multiple timeframes of a symbol Multipl
Color Levels - удобный инструмент для тех, кто использует технический анализ с использованием таких инструментов, как Трендовая линия и Прямоугольник. Имеется возможность настройки двух пустых прямоугольников, трех закрашенных и двух трендовых линий. Настройки индикатора крайне просты и делятся на пронумерованные блоки: С цифрами 1 и 2 вначале - настройки пустых прямоугольников (рамок); С цифрами 3, 4 и 5 - настройки закрашенных прямоугольников; С цифрами 6 и 7 - настройки трендовых линий. Объе
FREE

移動平均線クロス、ボリンジャーと移動平均線のクロス、移動平均線の角度でサイン表示
MT5インジケータ こちらに サイト とがあります。 このインジケータは3つのパターンでサインを表示(切り替え可能)します。 ① 移動平均線のクロス ② ボリンジャーバンドと短期移動平均線とのクロス ③ ボリンジャーバンドと短期移動平均線とのクロスと、中期移動平均線と長期移動平均線の角度 移動平均線のクロス 指定した短期移動平均線と長期移動平均線のゴールデンクロスでは買いサイン、デットクロスでは売りサインを表示します。 ディフォルトでは短期は5,長期は20となっています。 もちろん変更可能になります。 移動平均線の種類をEMA(指数平滑移動平均線)やSMMA(平滑化移動平均)などに変更可能で適する価格も変更可能になります。 ボリンジャーバンドと短期移動平均線のクロス ボリンジャーバンド(以降BB)と短期移動平均線のクロスでサインを表示します。 ディフォルトではBB+1σと5MAのゴールデンクロスで買いサイン、BB-1σと5MAのデットクロスで売りサインでサインを表示します。 BBの期間や

This indicator draws on the chart high and low prices of different periods . And If you want, Indicator can alert you when the current price arrive these levels. Alert Options: Send Mobil Message, Send E-mail, Show Message, Sound Alert Time Periods: M1, M5, M15, M30, H1, H4, D1, W1, MN Inputs: TimeShift: You can set start hour for calculating. And that way you can see levels independently from broker server's time-zone. PipDeviation: You can set price sensibility for alert (Default: 3) Lines
FREE
PAX BDB Trade Chaos system of Bill Williams (Bearish/Bullish divergent bar)
One of the signals of the "Trade Chaos" system of Bill Williams. (First wiseman) When bar moving away from the "Alligator" indicator and there is divergence on the Awesome Oscillator indicator, it shows a potential point of movement change. It is based on the opening/closing of the bar, the position relative to the previous ones, the Alligator and AO. When trading, the entrance is at the breakthrough of the bar(short

** All Symbols x All Timeframes scan just by pressing scanner button ** After 17 years of experience in the markets and programming, Winner indicator is ready. I would like to share with you! *** Contact me after purchase to send you instructions and add you in "123 scanner group" for sharing or seeing experiences with other users. Introduction The 123 Pattern Scanner indicator with a special enhanced algorithm is a very repetitive common pattern finder with a high success rate . Interestingly,

A visualization system for favorite candlesticks price action patterns. Once attached, indicator will automatically mark next patterns on the chart: Pinocchio bar - a small-body bar with a long 'nose', very well-known reverse pattern; Inside bar - a bar whose range lies inside the range of the previous bar. It represents market incertitude; Outside bar - a bar whose range exceeds the range of the previous bar. It represents market incertitude; Rails pattern - two consequent opposite bars with al

[ MT5 Version ] Only the next 10 units at current price! Final price: $299 How to trade using Order Blocks: Click here Discover the future of trading with Order Block Indicator , meticulously crafted for traders who demand unparalleled accuracy and customization. Whether you're scalping or swing trading, this tool is your gateway to mastering Order Blocks and Supply and Demand Zones—critical areas where price reversals often occur. Why Choose Order Block Indicator? Transform Your Trading Stra
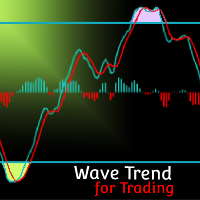
MT5 Version Wave Trend MT4 Wave Trend is an oscillator, which helps identifing in a extremely accurate manner market reversals. The Oscillator being obove the overbought level and a cross down of the fast into the slow MA usually indicates a good SELL signal. If the oscillators is below the oversold level and the fast MA crosses over the slower MA usually highlights a good BUY signal. The Wave Trend indicator can be also used when divergences appear against the price, indicating the current mo
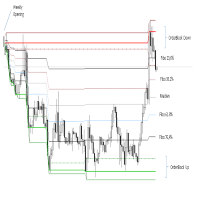
The indicator is activated at the beginning of each week and detects both bullish and bearish ORDERBLOCK potentials. These levels are of high operational probability, being able to use a minimum ratio of 3 to 1 to maximize profits. It is recommended to use pending orders at the OB levels of the chart and place the SL up to a maximum of 20 pips from the entry price.
Submit the indicator to Backtesting to become familiar with its performance and complement it with other trend or oscillation typ

The indicator is triggered at the start of each trading day and detects both bullish and bearish ORDERBLOCK potentials. These levels are of high operational probability, being able to use a minimum ratio of 3 to 1 to maximize profits. It is recommended to use TimeFrame M5 to M30 for a proper display and consider pending orders at the OB levels of the chart and place the SL up to a maximum of 20 pips from the entry price.
Submit the indicator to Backtesting to become familiar with its performa
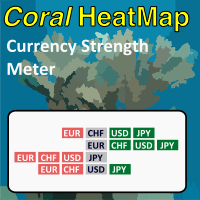
Coral Heatmap is a currency strength meter based on the ATR values for the selected timeframe. There are two main view modes: All Currencies (default) - see the ranked strength of all currencies in a single view Selected Currency - see the relative strength of all other currencies compared to a selected currency You can optionally display the timeframe selection toolbar; timeframe is always synchronized to the current chart timeframe. Use keyboard shortcuts to quickly navigate currencies (up/d

This indicator simplifies your entry zones by displaying the areas where you can plan your entry that potentially could give you high risk/reward ratios. Other than picking the most optimal entry points, the Hot Zone indicator can act as your typical support/resistance indicator for pullbacks for all timeframes. You can use this indicator as the only trading indicator or use it with another indicator for reentry purposes. Besides, when using Hot Zones, the risk/reward ratio should be well abov
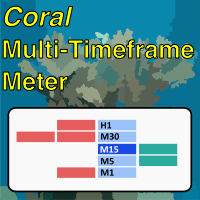
Coral Multi TF Meter allows you to quickly see how price is moving on a single currency pair across multiple timeframes at once. You can select which timeframes to display; the size, position, colors of cells; whether to display values or not; and how often the meter is updated. The calculation is based on ATR distance for each displayed timeframe. Hover over the header cell for the row (with the currency name in it) to see the current ATR value (in pips) for that period. When "Display Values
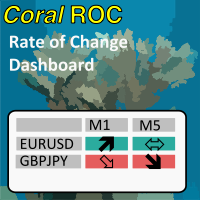
Coral Rate of Change Dashboard displays "rate of change" calculations across multiple symbols and timeframes simultaneously. See at a glance which pairs are moving, and how quickly. Receive alerts when any symbol + timeframe is experiencing very strong movement. You can display data for currency pairs, or for individual currencies (takes the average for each currency across all available pairs). See the CoralDash product description for the core functionality of the dashboard (symbol exposu
Highly configurable Rate of Change (ROC) indicator. Features: Highly customizable alert functions (at levels, crosses, direction changes via email, push, sound, popup) Multi timeframe ability Color customization (at levels, crosses, direction changes) Linear interpolation and histogram mode options Works on strategy tester in multi timeframe mode (at weekend without ticks also) Adjustable Levels Parameters:
ROC Timeframe: You can set the current or a higher timeframes for ROC. ROC Bar Shift:
FREE

CoralDash is a simple symbol shortcut dashboard. The Symbol List has many presets to choose from: Market Watch Open Orders Current Chart Majors A custom list Clicking the symbol has two available actions Set the current chart symbol Filter the list of symbols shown in the dashboard based on one currency (e.g., see all EUR pairs) Click the "PAIR" cell in the header to toggle between the two available actions Click the symbol cell to apply the action For the filter, click the left side to selec
FREE
CoralPage is a simple little utility to add navigation controls to your chart. You can now easily step through the symbols in the Market Watch without having to click-and-drag a symbol from the Market Watch onto your chart. It's a simple but indispensable time-saver! Click move to the first, previous, next or last symbol in the Market Watch. Shift-click to go the the previous or next symbol that has an open order. CoralPage is completely free. If you like this, please check out my other prod
FREE
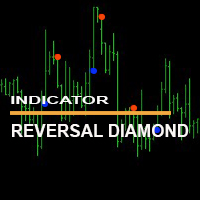
Индикатор " Reversal Diamond Indicator" мощный инструмент для торговли на рынке форекс. " Reversal Diamond Indicator" не перерисовывается и не меняет свои значения при переключении временных периодов. The "Reverse Diamond Indicator" indicator is a powerful tool for trading on the forex market. The "Reverse Diamond Indicator" does not redraw and does not change its values when switching time periods.

Индикатор " Nostradamus ind" мощный инструмент для торговли на рынке форекс. " Nostradamus ind" не перерисовывается и не меняет свои значения при переключении временных периодов. The "Nostradamus ind" indicator is a powerful tool for trading on the forex market. "Nostradamus ind" does not redraw and does not change its values when switching time periods.

Индикатор "Trend direction ind" является трендовым индикатором. Индикатор "Trend direction ind"не запаздывает, выдает сигналы на нулевом баре и не перерисовывает при переключении таимфреймов. С индикатором "Trend direction ind" вы будете с легкостью определять текущую тенденцию. The "Trend direction ind" indicator is a trend indicator. The "Trend direction ind" indicator does not lag, gives signals at the zero bar and does not redraw when switching time frames. With the "Trend direction ind

Универсальная, очень простая но надёжная торговая стратегия для ловли откатов после сильного импульса. Подходит как для Форекса, Стоков и Бинарных опционов. Чем выше ТФ, тем точнее сигналы, но реже входы. Можно применять как вход для работы по одному(двум) барам, так и для построения небольшой сетки из 3-5 колен как с мартингейлом так и без. Для Бинарных опционов просто время экспирации. В индикаторе есть алерты, пуш уведомления, уведомления на почту. Можно настроить расписание работы. Можно н

Это инструмент для проверки сторонних стрелочных индикаторов с выводом статистики на экран. Так же можно применить для них встроенные фильтры. Или можно вообще создать свою систему из одних только встроенных фильтров. Блок ADX Включение ADX - вкл/выкл использование индикатора ADX ( Average Directional Movement Index ); Период - период используемого индикатора; Уровень - сигнальный уровень для используемого индикатора; Тип цены - тип цены для используемого индикатора; Блоки
Индикатор "BO indicator at zero bar" для торговли бинарных опционов. Индикатор выдаёт свои сигналы на нулевом баре не перерисовывает и не меняет свои показатели при переключении временных периодов. Рекомендую использовать индикатор совместно с другим индикатором как фильтр "BO indicator at zero bar" indicator for binary options trading. The indicator gives its signals on the zero bar, does not redraw and does not change its indicators when switching time periods. I recommend using the indicato
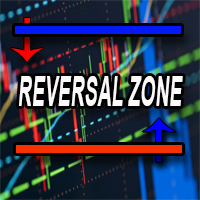
Индикатор "Reversal zone" показывает силовые уровни и возможные точки разворота на текущем графике. Индикатор "Reversal zone" поможет трейдеру разобраться с текущей ситуацией The "Reverse zone" indicator shows power levels and possible reversal points on the current chart. The "Reverse zone" indicator will help the trader to deal with the current situation

Индикатор "Trend zone" Помощник трейдеру, показывает на графике текущую тенденцию. Он надеюсь станет незаменимым индикатором в ваше трейдинге. Индикатор не перерисовывается и не меняет свои значения про переключение временных периодов The "Trend zone" indicator is a trader's assistant, shows the current trend on the chart. I hope it will become an indispensable indicator in your trading. The indicator does not redraw and does not change its values about switching time periods

Индикатор "Zigzag levels" основан на индикаторе зигзаг. Индикатор показывает зоны уровней поддержки и сопротивления относительно индикатору зигзаг. Индикатор "Zigzag levels" сделает хорошую службу в вашем трейдинге. Всем больших профитов!!! The Zigzag levels indicator is based on the zigzag indicator. The indicator shows the zones of support and resistance levels relative to the zigzag indicator. The Zigzag levels indicator will do a good service in your trading. Big profits for everyone!!!

Koala Trading Solution 채널 에 가입하여 MQL5 커뮤니티에서 최신 신호 및 Koala 제품에 대한 소식을 확인하세요. 가입 링크는 아래에 있습니다: https://www.mql5.com/en/channels/koalatradingsolution 설명 :
우리는 외환 시장(PSAR)에서 전문적이고 인기 있는 지표 중 하나를 기반으로 하는 새로운 무료 지표를 도입하게 된 것을 기쁘게 생각합니다. 이 지표는 원래 포물선 SAR 지표에 대한 새로운 수정이며, 프로 SAR 지표에서 점과 가격 차트 사이의 교차를 볼 수 있습니다. 교차는 신호가 아니지만 이동 가능성의 끝을 말하는 것입니다. 새로운 파란색 점으로 매수를 시작하고 첫 번째 파란색 점 앞에 손절매를 1 attr 배치하고 마지막으로 점이 가격 차트를 교차하는 즉시 종료할 수 있습니다.
매수 또는 매도 신호를 여는 방법은 무엇입니까? 첫 번째 파란색 점으로 공개 매수 거래 및 첫 번째 빨간색 점으로 공
FREE

Contact me after payment to send you the User-Manual PDF File. ADVANCE PRICE ACTION TRADING CONCEPT. To test the indicator, you can download the demo version on my product list. it’s free (only shows patterns that have occurred in the past of the market). Quasimodo is a reversal trading pattern that appears at the end of an uptrend. As a price formation, the Quasimodo pattern is depicted by three peaks and two valleys, where: First, the middle peak is the highest, while the outside two peaks

(자동번역) 대부분의 거래자들은 1700년대 혼마 무네히사(Munehisa Homma) 가 창안한 일본의 유명한 하이킨 아시(Heikin-Ashi) 지표를 알고 있습니다. 때때로 Heiken-Ashi 로 표기되지만 그 의미는 동일하게 유지됩니다. 즉 일본어에서는 "평균 막대"입니다. 이는 매우 잘 알려진 Heikin Ashi 표시기의 구현이지만 몇 가지 기능이 추가되었습니다. 우선, 틱 카운트 볼륨, 실제 볼륨 또는 실제 범위를 기반으로 한 의사 볼륨 등 해당 값에 볼륨 에 따라 가중치 를 부여할 수 있습니다. 주요 이점은 특히 거래량이 적은 기간 동안 잘못된 반전의 수를 줄이는 것입니다. 또한 최고점과 최저점의 추적을 늦추는 데 도움이 됩니다. 옵션으로 막대의 실제 범위를 기반으로 의사 볼륨을 사용할 수 있습니다. 이는 실제 거래량이나 틱 카운트 거래량 데이터가 없는 기호에 유용합니다. 추가 기능으로 이 표시기는 정지에 사용할 수 있는 최대 이동 수준도 표시합니다. 계산의 기초를
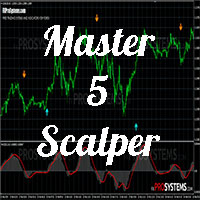
안녕하세요 트레이더, 특히 스캘퍼 이번에는 5분 단위로 스캘퍼를 위한 특별 지표를 소개합니다.
이 지표는 이해하기 쉬운 스캘퍼 지표를 찾는 데 혼란스러워하는 초보자에게 도움이 될 것으로 기대됩니다.
알았어 계속해
이 표시기는 5분 시간 프레임에서만 실행됩니다. 이 표시기는 거래 플랫폼에 MQID를 입력하여 모바일을 통해 거래자에게 알림을 제공할 수도 있습니다.
이 표시기는 수정된 스토캐스틱 오실레이터 방법을 사용합니다.
오늘 업데이트에서 지표는 이동 평균 지표의 추세를 기반으로 알림을 제공할 수 있습니다. 더 정확한 결과를 얻기 위해 5분 시간 프레임, 피벗 포인트 표시기(피보나치) 및 볼린저 밴드(기간 120) 사용
따라서 이 표시기가 알림을 제공하는 경우 가격이 매수 또는 매도할 가치가 있는지 여부를 결정합니다.
100% 수익을 보장하지 않습니다
팁과 트릭
- 이동평균선 추세가 상승하면 매수 알림을 기다립니다
- 이동평균선 추세가 하락하면 매

MT5 Version MA Ribbon MT4 MA Ribbon is an enhanced indicator with 8 moving averages of increasing periods. MA Ribbon is useful to recognize trend direction, reversals and continuation points in the market as well as potential entry, partial take profit and exit points. Entry points for long and shorts position can be found when the price entries or leaves the Ribbon, at retest or a defined number of MA crossovers. It offers a good combination with mostly any volume or momentun indicators to f
FREE

MT5 Version Fibonacci Bollinger Bands MT4 Fibonacci Bollinger Bands is a highly customizable indicator that shows areas of support and resistance. This indicator combines the logic for the Bollinger Bands with the Fibonacci level. Fibonacci Bollinger Bands is the first indicator in the market that allows the user to 100% customize up to 12 Fibonacci levels, the Moving Average type and the price data source to use for the calculations. This flexibility makes the Fibonacci Bollinger Bands easi
FREE

The indicator (Current Strength) is represented in a separate window by Blue and Pink histogram . The parameter NPeriod represents the number of bars on which we calculate the variation of forces, the recommended value is 5. The Blue histogram measures the buyers force , while the Pink histogram measures the sellers force . The change in color signifies the change in strength which leads t he price . Each drop (especially below 52.8) after touching levels 96.3 or 1.236 must be condidered
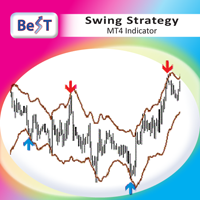
BeST Swing Strategy is a Metatrader indicator based on the corresponding Jim Berg's work about volatility as described in his article "The Truth About Volatility" (TASC 2/2005).The indicator consists of 2 channel lines deriving as (MA +/- times the ATR) and can be used as a standalone trading system.The outlier prices of the Market as of the indicator's values can be used for producing Entry and Exit Signals.
Advantages of the indicator == Uses 2 Swing Strategies (Normal and Reverse)
== Ne
Allows you to find the average volatility / expected price movement for ANY custom period starting at ANY time of day. Simply set a vertical line at the desired entry time and calculate your TP target within the expected volatility range. Indicator places 5 custom vertical lines on chart at the same times each day throughout the history + gives live alerts with custom text each day. 1. Get the average price movement / volatility of ANY time period starting at each vertical line, so you know h

Features:
- Moving Average Slope for Max Past Bars - Slope Period - Slope Thresholds - Multiple Slope Type options - See slope visually as a histogram - Info Panel Show/Hide Slope Calculations and Types:
The slope value is calculated using the Slope Period. Suppose Period is 5, it will check the MA value for bar (x) and bar (x+5). And find the slope angle between them.
Read detailed description about Slope Types and Settings here: https://www.mql5.com/en/blogs/post/747651
FREE

This strategy is best used for Scalping and Binary Options. Strategy: There are 3 EMAs: Faster, Medium and Slower. When Price is Trending, wait for Price to bounce an EMA and scalp at each bounce. Features: - Check if 3 MAs are Stacked - Check Price Bounce Off MAs (Faster, Medium, Slower) - Min Distance Between Faster and Medium MA Filter - Max Distance Between Entry Price and Faster MA Filter - High Volume Check - Heiken Trend Check - Volatility Check - Higher/Lower Timeframes MA Stacked check
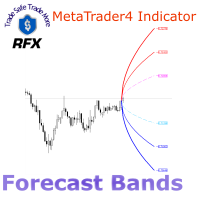
The RFX Forecast Bands indicator calculates the three significant confidence levels, 99%, 95% and 68% of price movement for a configurable number of bars in the future. The essence of calculations is based on statistical analysis of the asset's recent price changes. These levels can be used for many different purposes in trading systems. For example, one can use them for setting the target profit and stop loss levels effectively. The extreme upper and lower bands represent 99% confidence level,

The Qv² Halifax - Indicator developed through a complex series of calculations, which aims to easily identify buylng and selling signals.
Buy signal are indicated by up arrows.
Sell signal are indicated by down arrows.
An important detail: In order to make the indicator work, the timeframes M1, M5. M15. M30, H1 D1 must be all updated.
It can be used on all pairs (I use it on Gold).
it is a very good deal in the trending market
To learn more about my work click here

RSI Trend Line is a simple indicator that draws trend lines.
Parameters:
Level Step - the step between the highs and lows.
Period_RSI - standard parameter of the RSI indicator.
Upper Line Color - sets the color of the trend lines for UP.
LowerLine Color - sets the color of the trend lines for Down.
Alerts - the parameter is responsible for On/Off notifications when trend lines intersect with RSI. By default, it is On.

** All Symbols x All Timeframes scan just by pressing scanner button ** ***Contact me after purchase to send you instructions and add you in "RSI scanner group" for sharing or seeing experiences with other users.
Introduction RSI divergence is a main technique used to determine trend reversing when it’s time to sell or buy because prices are likely to drop or pick in the charts. The RSI Divergence indicator can help you locate the top and bottom of the market. This indicator finds Regular div

If you like this project, leave a 5 star review. Often times we are using brokers that are outside of the GMT-0 timezone, this
not only complicates things, but, it can make seeing when a trading session starts
a bit more difficult than it should. This indicator allows you to set a timezone offset it will draw a vertical line for the: Day. Week. Month. Quarter. year.
FREE
This indicator helps to trade in the right direction of the market, by knowing the bias of the market. If you are a swing trader this is the best indicator for you. You will just see the bias on the top right of your chart/screen. You can sometime wait for reversals then continue with the trend/bias. Indicator is based on moving averages and showing daily bias of the market. KEEP IN MIND THAT THE BIAS IS STRICTLY SHOWING THE DAILY TIMEFRAME TREND ONLY.
You can check the video attached.
MetaTrader 플랫폼 어플리케이션 스토어에서 MetaTrader 마켓에서 트레이딩 로봇을 구매하는 방법에 대해 알아 보십시오.
MQL5.community 결제 시스템은 페이팔, 은행 카드 및 인기 결제 시스템을 통한 거래를 지원합니다. 더 나은 고객 경험을 위해 구입하시기 전에 거래 로봇을 테스트하시는 것을 권장합니다.
트레이딩 기회를 놓치고 있어요:
- 무료 트레이딩 앱
- 복사용 8,000 이상의 시그널
- 금융 시장 개척을 위한 경제 뉴스
등록
로그인
계정이 없으시면, 가입하십시오
MQL5.com 웹사이트에 로그인을 하기 위해 쿠키를 허용하십시오.
브라우저에서 필요한 설정을 활성화하시지 않으면, 로그인할 수 없습니다.