Regardez les tutoriels vidéo de Market sur YouTube
Comment acheter un robot de trading ou un indicateur
Exécutez votre EA sur
hébergement virtuel
hébergement virtuel
Test un indicateur/robot de trading avant d'acheter
Vous voulez gagner de l'argent sur Market ?
Comment présenter un produit pour qu'il se vende bien
Nouveaux indicateurs techniques pour MetaTrader 4

iMRPHN: Supertrend & Swing Reversal Indicator A trading indicator that integrates Supertrend zone detection with swing-based entry logic. Designed for traders who apply both trend-following and counter-trend approaches. The indicator works across multiple timeframes and offers several helpful visual and alert-based features. Key Features: Automatic identification of swing high and swing low levels Automatic Fibonacci retracement Supertrend reversal zone visualization in real-time Highlights are
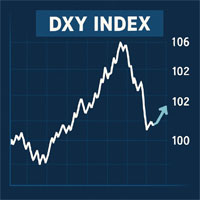
DXY Index indicator to help predict USD effect to your trade. DXY Index will help to see the power of USD.
For example if you trade XAUUSD and the DXY Index weaker, it could be the XAU will be bullish.
The same if DXY Index getting stronger, it could be that XAU will be bearish. I hope this indicator will help many trader to have better position to trade. Use this indicator wisely.
L'indicateur Bougies Multi-Timeframes est un puissant outil de visualisation conçu pour aider les traders à aligner leur analyse des unités de temps courtes sur la structure des unités de temps longues. En traçant les bougies d'une unité de temps longue sélectionnée (H1, H4, D1, etc.) directement sur votre graphique actuel, cet indicateur vous offre une perspective plus claire de l'évolution globale du marché sans changer de graphique.
Qui a besoin de cet indicateur ? Cet outil est idéal p
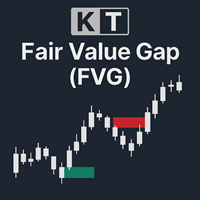
KT Fair Value Gap (FVG) identifie et met en évidence les zones de déséquilibre temporaire du prix sur le marché. Ces écarts agissent souvent comme des zones potentielles de poursuite du mouvement – ou dans certains cas, de retournement (aussi appelés FVG inversés). FVG haussier : Affiché sous forme de zones vertes, ce type d’écart agit comme une zone de support où le prix pourrait reprendre son mouvement haussier. Une fois comblé, il peut également devenir un point de retournement potentiel. FVG
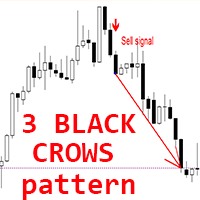
Indicateur Crypto_Forex « Modèle 3 Corbeaux Noirs » pour MT4.
- L'indicateur « Modèle 3 Corbeaux Noirs » est très performant pour le trading Price Action : pas de refonte, pas de délai. - L'indicateur détecte les modèles baissiers « 3 Corbeaux Noirs » sur le graphique : signal de flèche rouge sur le graphique (voir images). - Alertes PC, mobile et e-mail. - Son homologue haussier « Modèle 3 Soldats Blancs » est également disponible (lien ci-dessous). - L'indicateur « Modèle 3 Corbeaux Noirs »
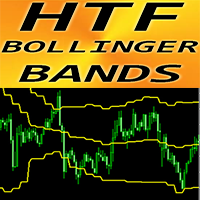
Indicateur Crypto_Forex « Bandes de Bollinger HTF » pour MT4.
- Améliorez vos méthodes de trading avec l'indicateur professionnel « Bandes de Bollinger HTF » pour MT4. HTF signifie « Higher Time Frame ». - Les bandes de Bollinger sont l'un des meilleurs indicateurs du marché : un outil idéal pour le trading. - Environ 90 % des fluctuations de prix se produisent entre les deux bandes. - L'indicateur HTF Bollinger Bands est idéal pour les systèmes de trading multi-périodes avec des entrées de Pr
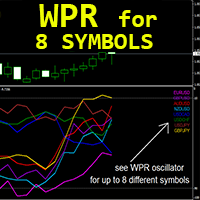
Indicateur Forex « WPR pour 8 symboles » pour MT4, sans modification.
- Le WPR est l'un des meilleurs oscillateurs pour le scalping. - Il est idéal pour les entrées de vente en zone de surachat (supérieure à -10) et les entrées d'achat en zone de survente (inférieure à -90). - Le WPR pour 8 symboles permet de contrôler les valeurs WPR de jusqu'à 8 symboles différents sur un seul graphique. - Cet indicateur est également idéal pour combiner les entrées Price Action en zone de survente/surachat.
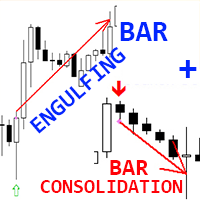
Indicateur Crypto_Forex « Barre d'avalement et Barre de consolidation » pour MT4.
- Les figures « Barre d'avalement et Barre de consolidation » sont très performantes pour le trading d'actions de prix. - L'indicateur détecte les barres d'avalement et les barres de consolidation sur le graphique : - Barre d'avalement haussière : signal de flèche verte. - Barre d'avalement baissière : signal de flèche orange. - Barre de consolidation haussière : signal de flèche bleue. - Barre de consolidation b

FullScalping est un indicateur sans repainting ni backpainting , spécialement conçu pour générer des entrées scalping CONSTANTES sur tous les marchés. Parfait pour les traders agressifs à la recherche d’action continue ! Consulte le canal des indicateurs pour les dernières informations et mises à jour: https://www.mql5.com/en/channels/forexnewadvisor Vous verrez des signaux apparaître presque à chaque bougie , soit pour confirmer la tendance, soit pour signaler un retracement clé. C’est
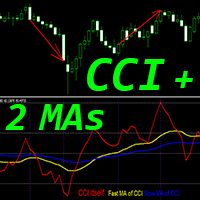
Indicateur Crypto_Forex « CCI et 2 moyennes mobiles » pour MT4, sans refonte.
- L'indice Commodity_Channel_Index (CCI) est idéal pour le trading dynamique en suivant la tendance. - L'indicateur « CCI et 2 moyennes mobiles » vous permet de visualiser les moyennes mobiles rapides et lentes de l'indicateur CCI. - Tendance haussière : la moyenne mobile rapide est supérieure à la moyenne lente ; tendance baissière : la moyenne mobile rapide est inférieure à la moyenne lente. - Le CCI est l'un des o
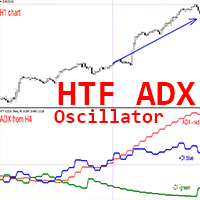
Indicateur Crypto_Forex HTF ADX pour MT4.
- Améliorez vos méthodes de trading avec l'indicateur professionnel HTF ADX pour MT4. HTF signifie « Higher Time Frame » (période supérieure). - L'ADX (ligne rouge) mesure la force d'une tendance : si la valeur de l'ADX est supérieure à 20 et présente une forme ascendante, la tendance est forte. - Si le DMI + (ligne bleue) est supérieur au DMI - (ligne verte), le cours est en hausse et l'ADX mesure la force de la tendance haussière. - Si le DMI - (lign

Indicateur Crypto_Forex pour MT4 Heiken Ashi Histo Filter : un outil de trading auxiliaire performant et efficace ! Pas de refonte !
- Nouvelle méthode de calcul avancée : 10 options pour le paramètre « Prix de calcul ». - Idéal pour combiner avec les tendances de prix : - Histogramme vert : recherche de tendances haussières. - Histogramme magenta : recherche de tendances baissières. - Cet indicateur offre de nombreuses possibilités d'amélioration, même pour les stratégies standard. - Alertes
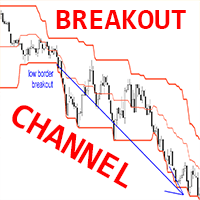
Indicateur Crypto_Forex BREAKOUT CHANNEL pour MT4, sans refonte.
- Cet indicateur peut être utilisé comme système de trading complet basé sur les cassures hautes/basse. - Il ne comporte qu'un seul paramètre : HYSTORY DEPTH, qui reflète le nombre de bougies prises en compte par l'indicateur. - Valeurs recommandées pour le paramètre HYSTORY DEPTH : période D1 : 20 (un mois), H4 : 30 (une semaine), H1 : 24 (un jour). - BREAKOUT CHANNEL se compose de 3 lignes : limite haute : prix maximum des N de
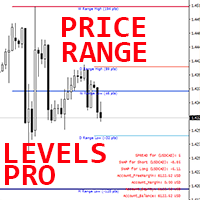
Indicateur Forex « Price Range Levels Pro » pour MT4.
- L'indicateur « Price Range Levels Pro » est un outil de trading auxiliaire professionnel très utile. - Il affiche les niveaux quotidiens, hebdomadaires et mensuels les plus probables, atteignables par le prix (niveaux de fourchette de prix). - La fourchette quotidienne est utile pour les traders intraday. - Les fourchettes hebdomadaires et mensuelles sont utiles pour les traders swing et long terme. - L'indicateur est idéal pour planifier

Indicateur Crypto_Forex « RSI SPEED » pour MT4 : excellent outil prédictif, sans retouche.
- Le calcul de cet indicateur est basé sur des équations physiques. Le RSI SPEED est la dérivée première du RSI lui-même. - Le RSI SPEED est idéal pour scalper les entrées dans la direction de la tendance principale. - Utilisez-le en combinaison avec un indicateur de tendance approprié, par exemple HTF MA (comme sur les images). - L'indicateur RSI SPEED indique la vitesse à laquelle le RSI change de dire
Hello fellow trader, I have built this indicator by combining trend and entry mechanisms i have used for years. This is one of my high probability strategies. All calculations are done based on pure price action-based market structure. Multiple confluences are used to validate and filter entries. All calculations are done behind the scenes, and you are given only buy sell signals. Accuracy becomes higher and higher as you trade higher timeframes, also based on my experience with the technique,

Cet indicateur a été conçu pour le scalping agressif et les entrées rapides sur les options binaires , en générant des signaux à chaque bougie , afin que vous sachiez exactement ce qui se passe à tout moment.
Regardez le trading en direct: https://youtu.be/QR5F_9uIb6k Rejoignez la chaîne Happy Scalping : https://www.mql5.com/en/channels/forexnewadvisor
Pas de repaint : le signal de la bougie en cours est généré en TEMPS RÉEL , ce qui signifie qu’il peut changer tant que la bougie es
M5 Signal
- M5 Signal was built specifically for the M5 timeframe and for all currency pairs.
- The M5 Signal indicator provides accurate BUY and SELL signals.
- The indicator is perfect for scalping.
- The indicator is easy to use.
- With a simple and intuitive interface, the indicator displays clear circles on the chart, making it easy to interpret and act on the signals.
When it detects a good entry point, it gives you a signal in the form of a circle.
- White circles: Buy signals.
-
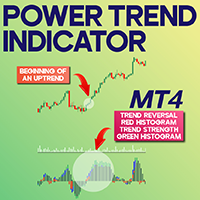
Power Trend Indicator for MetaTrader 4 The Power Trend Indicator for MetaTrader 4 is designed to assess both the momentum and direction of price movements. This MT4 indicator presents the trend strength using a four-color-coded system, allowing traders to spot weak momentum phases and anticipate potential trend initiations. Its visual feedback is valuable for recognizing shifts in market sentiment and detecting trend transitions. Red signals indicate reversals, blue suggests mild trends, while g
FREE
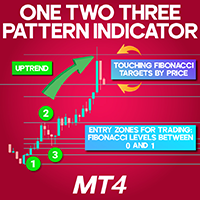
1-2-3 Pattern Indicator for MetaTrader 4
The 1-2-3 Pattern Indicator for MetaTrader 4 is a sophisticated technical tool designed to identify potential market reversals. It highlights three significant turning points, connecting them with a ZigZag pattern to visually map the price trajectory. Once the formation is complete, the indicator automatically generates Fibonacci retracement levels between the first two points to assist with trade planning. «Indicator Installation & User Guide»
MT4 Indi
FREE

Core Drift Index: Your Reliable Guide in the World of Trading Core Drift Index is an innovative trend indicator designed for precise detection of market directions and reversal points . This powerful tool enables traders to optimize their investments , minimize risk, and maximize profit. Key Features and Benefits Intuitive Trend Detection Core Drift Index clearly shows trend direction, helping traders make timely entry and exit decisions. High Probability of Success With its high accuracy
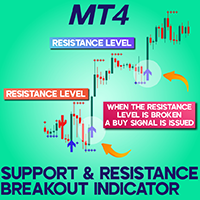
Support Resistance Breakout Indicator (SRBAI) download for MetaTrader 4
The Support Resistance Breakout Indicator (SRBAI) available for MetaTrader 4 (MT4) is designed to highlight significant pivot zones by mapping support and resistance levels on the price chart. Blue dashed lines represent support zones, while red dashed lines indicate resistance levels. Once the price breaks through a support area, the indicator generates a sell alert with a red downward-pointing arrow. Conversely, a resista
FREE

Average Daily Range (ADR) Indicator for MetaTrader 4 The Average Daily Range (ADR) Indicator for MetaTrader 4 is a vital technical analysis tool used to assess the typical price movement range an asset experience during a trading day.
By analyzing the average distance between daily highs and lows over a specified number of days, this indicator defines the ADR High (upper boundary) and ADR Low (lower boundary), helping traders identify possible support and resistance zones. «Indicator Installatio
FREE
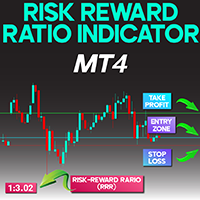
Risk Reward Indicator for MetaTrader 4
The Risk Reward Indicator for MetaTrader 4 is developed to assist traders in determining the potential risk and return of a trading position. It calculates the Risk-to-Reward Ratio (RRR) using three key levels: Entry Price (EP), Stop Loss (SL), and Take Profit (TP).
This tool graphically presents the RRR at the top-left corner of the chart and highlights the trade levels with three distinct horizontal lines:
• Green Line – Indicates the Take Profit level
•
FREE
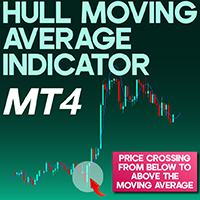
Hull Moving Average Indicator MetaTrader 4
The Hull Moving Average (Hull MA) indicator, developed by Alan Hull, is designed to minimize delay in standard moving averages and enhance responsiveness in trend evaluation. Available on the MetaTrader 4 platform, this indicator allows traders to spot short-term directional moves with greater clarity. It serves as an effective tool for identifying optimized trade entry and exit points. «Indicator Installation & User Guide»
MT4 Indicator Installation
FREE
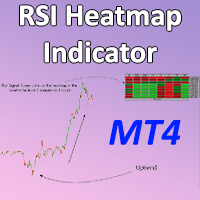
RSI Heatmap Indicator for MetaTrader4 The RSI Heatmap Indicator is a powerful technical tool in MetaTrader 4 that allows traders to assess the relative strength conditions of different currency pairs via a color-coded heatmap. By merging the Relative Strength Index (RSI) with a visual heatmap approach, this indicator simplifies market analysis by displaying strength and directional bias of multiple instruments at a glance. This indicator produces a heatmap based on calculated RSI levels across v
FREE
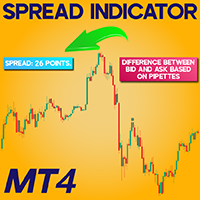
Spread Indicator download For Meta Trader 4
The Spread Indicator on MetaTrader 4 (MT4) serves to reveal the real-time gap between the Bid and Ask values. This variance, calculated in points (pipettes), appears clearly at the upper-left section of the chart window. «Indicator Installation & User Guide»
MT4 Indicator Installation | Spread Indicator Download for MT5 | ALL Products By TradingFinderLab | Best MT4 Indicator: Refined Order Block Indicator for MT4 | Best MT4 Utility: Trade
FREE
MTRade is a professional arrow indicator based on the classic Parabolic SAR algorithm. It automatically detects the moments of trend direction change and displays clear signal arrows on the chart: up (buy) and down (sell).
Basis: original Parabolic SAR algorithm with full adaptation for visual display by arrows;
Signals: up arrow — possible up reversal (buy); down arrow — possible down reversal (sell);
No redrawing: signals are recorded only after a confirmed reversal, excluding "jumps" and
Trend detection is one of the basic challenges of every trader. Finding a way to tell when to enter a trade is very important, timing is a game changer, not too early and not too late. Sometimes, due to not knowing the market conditions, the trader closes his positions with a small profit or allows the losses to grow, these are the mistakes that novice traders make. Indicator Trend Whipper is a complete trading strategy and can improve the trader's trading process. The trend detection algorithm

The indicator defines the buy and sell arrows with high performance and consistent results. Automatic analysis of market opportunities ; Help traders earn more from their investments;
Never repaints, recalculates or backpaints signals; This is FREE demo version of the indicator and works only on "EUR USD M5". ProTrading Arrow - All details about the indicator here : Works in all symbols and TF + free EA and Multi Currency Scanner + SPECIAL BONUS .
FREE
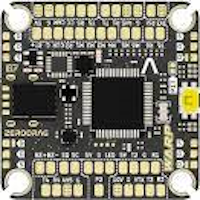
Warp Range Sensor: The Color of Your Trend Warp Range Sensor is a trend direction indicator that visually displays the current market condition by coloring bars red and blue based on trend direction. What Does Warp Range Sensor Do? Identifies the Current Trend Direction Blue bars indicate an uptrend Red bars signal a downtrend Universal Application
Compatible with all currency pairs and timeframes , from short-term scalping to long-term trading. Powered by Market Context & Historical Data
W

Rocket pro is a powerful indicator for MetaTrader 4, designed to identify the most relevant trends in the financial market. If you are looking for a tool that accurately predicts movements, Rocket pro is your ally.
Live signal: https://www.mql5.com/en/signals/2303662 How it works: This indicator combines three different methods - volume analysis, candlestick closing and symmetrical trend - to detect and signal buying and selling opportunities. Rocket pro is like a "rocket" when it detects a bu

Divergence Divergence refers to when the price of a currency pair moves in one direction while the trend indicator is moving in the opposite direction. With divergence, there can be positive and negative signals. Divergences in Forex trading are quite common signals of technical analysis. These are basic early Forex signals indicating the trend reversal and filter false signals. Application of this indicator It is usually not easy to detect divergences by the trader and it may be time-consuming
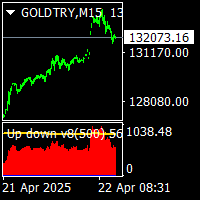
Up down v8 indicator is no repaint counter trend indicator . it try to find market up down points. it works all timeframes and all pairs. suitable for beginner and experienced trader. there is wave and c values to set defaults. minimum processed value cnt can be equal to wave value. traders can change them suitable up down points on different time frames. indicator use moving averages histograms and volatilty trigger. when red histogram is over volatility level that is tops. . when blue histogr

Indicator defines the buy and sell arrows with high performance and consistent results . Automatic analysis of market opportunities ; Identifies a direction of a trend; Suitable for trend trading or following the trend;
This is FREE demo version of the indicator and works only on "EURUSD M5".
Forex Trend Commander full version: All details about the indicator here : Works in all symbols + free Multi Currency Scanner + free SPECIAL BONUS .
FREE
As the suggested, with this indicator you are able to switch from one symbol or timeframe to another in the same single chart. So forget about opening tons of chart on your screen! It's not designed for ICT or SMC trader, but if you are that kind of trader you still can use it. Imagine you have a strategy containing various indicators and settings, on a single chart you can screen the entry opportunity then move to the next symbol or timeframe.
FREE
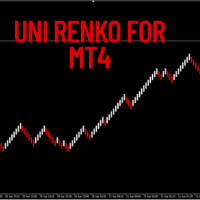
This versatile tool lets you create various Renko-style charts, including Median Renko, Mean Renko, and Traditional Renko with wicks . It offers a wide range of chart options to suit the needs of day traders, scalpers, and long-term investors.
Indicator Settings Starting Price. Box Size (in pips). Shift Percent. Timeframe Name. Show Wicks (On or Off). Amount of Bars.
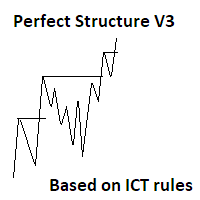
Here is the V3 of perfect structure. Whats new? (Please check added screenshots for better understanding.) 1. Coded based on ICT rules. 2. No more trend confusions...-- Added labels to show current trend 3. No more timeframe juggling and missing out important points, -- Now You can add indicator multiple times to mark multi timeframe structure on the same chart window( 1D structure on 4H or may be 4H structure on 15 min timeframe and more.....) 4. No more waiting in large range as sometimes mark

Pink J ICT trading system. Whats new? (Please check added screenshots for better understanding.) 1. Coded based on ICT rules. 2. No more trend confusions...-- Added labels to show current trend 3. No more timeframe juggling and missing out important points, -- Now You can add indicator multiple times to mark multi timeframe structure on the same chart window( 1D structure on 4H or may be 4H structure on 15 min timeframe and more.....) 4. No more waiting in large range as sometimes market makes h
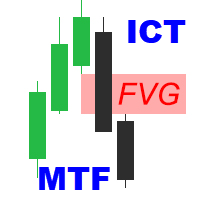
ICT Fair Value Gaps MTF Indicator Unlock the power of Fair Value Gaps (FVGs) across multiple timeframes using the ICT Fair Value Gaps Multi - Timeframe Indicator —a precision tool built for traders who follow the Smart Money Concept (SMC) . Key Features : Multi-Timeframe FVG Detection : Automatically identifies Fair Value Gaps from higher timeframes (M15, H1, H4, etc.) and plots them on your active chart for immediate insight. Break of Structure (BOS) & Change of Character (CHoCH
Scalping Strategy BUY SELL
Having a strategy in the market is one of the main conditions for trading. The presence of various and complicated indicators and tools sometimes makes trading difficult, and the user gets confused after trying various methods and gets stuck in a loss cycle, the result of which is usually clear. This indicator is a simple strategy based on the detection of pivots and short-term trends, which helps you to easily trade in trends. Sometimes a simple but efficient st

MACD Indicator The Moving Average Convergence and Divergence (MACD) is a trend following momentum indicator which shows the relationship between two moving averages that we chose and configure them on the indicator. The MACD is calculated by subtracting the 26-period exponential moving average and the 12 period D.A.M. These are the default parameters when you put the MACD indicator on the charts, and the period is usually 9 which means the last 9 candles. DT-Oscillator This is Robert C. Miner's

Price Change Indicator Introduction The Price Change Indicator is a powerful tool designed to help traders identify significant price movements over a specified period. By calculating and visualizing percentage changes between current and historical prices, it allows traders to quickly spot potential trading opportunities when markets show unusual volatility or momentum. Features Real-time monitoring of price changes Visual histogram display when changes exceed threshold Text display showing cur
FREE
RSI Powerful Arrows Works on ALL Timeframes
Instant Signals (No Delay / No Repaint)
Alerts: Pop-up, Sound, Email & Push Notifications
High Accuracy: ~98% Win Rate (optional Martingale)
Clean Arrows Directly on Chart (Main Window) The RSI Powerful Arrows is a highly reliable trading indicator that combines the Relative Strength Index (RSI) with Moving Averages and Bollinger Bands to deliver ultra-precise buy and sell signals. It draws non-repainting arrows dir

Hello fellow trader, I have built this indicator by combining trend and entry mechanisms i have used for years. This is one of my high probability strategies. All calculations are done based on pure price action-based market structure. Multiple confluences are used to validate and filter entries. All calculations are done behind the scenes, and you are given only buy sell signals. Accuracy becomes higher and higher as you trade higher timeframes, also based on my experience with the technique,

Ultimate Trend Rider
Ride the markets with confidence — your all‑in‑one trend‑capturing powerhouse.
Key Features & Benefits Adaptive Multi‑Filter Engine
Combines Supertrend, ADX, ATR volatility, and volume filters to ensure you enter only the strongest, most reliable trends. Multi‑Candle Confirmation
Eliminate “false start” signals: require multiple consecutive closes above/below your trend line before triggering an entry. Customizable Take‑Profit Alerts
Three levels of RSI‑based “TP” mar

Z Score Pair Trade Indicator for MT4 is a powerful statistical tool designed to help traders identify mean-reversion opportunities and overbought/oversold market conditions with precision. Based on standard deviation and mean analysis, this indicator calculates the Z-score of a selected spread, price series, or custom input to determine how far the current value deviates from its historical average.
Unlock powerful market insights with the Z Score Pair Trade Indicator — a must-have tool for tr

Arrow Indicator (Buy/Sell Alerts) – Simple Yet Powerful Tool! Product Version: 1.01 Indicator Type: Trend Reversal Signals Timeframes Supported: All (Recommended: H1, H4, D1) Key Features: Buy Signal : Green upward arrow () appears below the candle Sell Signal : Red downward arrow () appears above the candle Accurate Trend Reversal Detection – Based on tried and tested SMA strategy. ️ Clean Chart View – Minimalist, non-intrusive arrow signals for easy trading. Work

CDS SR Fractal Level: Enhance Your Trading Accuracy with Automatic Fractal-Based Support and Resistance Levels The CDS SR Fractal Level indicator is an advanced trading tool designed by CDS to automatically identify and visualize key Support and Resistance (SR) levels. This indicator utilizes the concept of fractals to present relevant SR levels for your trading decisions. Key Features: Automatic Fractal Level Identification: The indicator dynamically marks fractal levels as they form on the pri

The Great Oracle – Your Guide to Consistent Trend Trading Success
The Great Oracle is a powerful trend-following indicator designed for traders who seek precision in their entries and exits. Whether you’re navigating trending markets or spotting opportunities in ranging conditions, The Great Oracle provides you with accurate signals and a second chance to join strong market trends. It’s the ultimate tool for traders who want to maximize profits while keeping risks manageable.
Key Features:
•
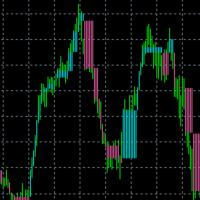
When there is no position, when changing the color, you can consider opening an order. With the fluctuation of the market, when the current color changes again, you need to close the position and leave. Suitable for different cycles, the trading rules are simple and require friends to explore on their own.
I hope friends who use this indicator can make a lot of money, rolling bigger and bigger like a snowball. thank you!

NOTE: CYCLEMAESTRO is distributed only on this website, there are no other distributors. Demo version is for reference only and is not supported. Full versione is perfectly functional and it is supported CYCLEMAESTRO , the first and only indicator of Cyclic Analysis, useful for giving signals of TRADING, BUY, SELL, STOP LOSS, ADDING. Created on the logic of Serghei Istrati and programmed by Stefano Frisetti ; CYCLEMAESTRO is not an indicator like the others, the challenge was to interpret only t
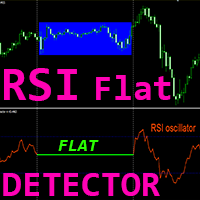
L'indicateur Crypto_Forex « Détecteur RSI FLAT » est un outil auxiliaire efficace pour le trading ! Pas de refonte. Je vous propose d'améliorer vos méthodes de trading avec cet excellent indicateur pour MT4.
- L'indicateur affiche les zones de prix plates sur le graphique. Il dispose d'un paramètre « Sensibilité plate », qui permet de détecter les prix plats. - Le détecteur RSI FLAT peut être utilisé pour confirmer les entrées d'action de prix ou en combinaison avec d'autres indicateurs. - Il
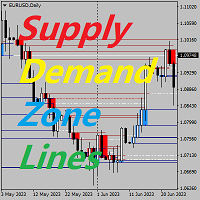
Indicateurs clés des prix de la zone d'offre et de demande arrière-plan Le système recherche automatiquement les zones d'offre et de demande dans la ligne K et trace des lignes de prix clés en temps réel. Les traders peuvent négocier en fonction des lignes de négociation de prix. Caractéristiques principales Le système recherche automatiquement les zones d'offre et de demande dans la ligne K. Le système tracera également des lignes de prix clés en temps réel, et les traders pourront négocier en
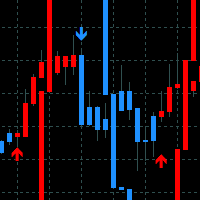
Reversal Bands - indicateur conçu pour l'analyse de la volatilité et l'application des résultats dans le trading. Fournit des signaux de direction des prix le long de la tendance et dans les premiers stades d'un renversement.
Capacités de l'indicateur
L'indicateur est basé sur des lignes de vitesse construites selon les principes d'accélération et de décélération de la volatilité en utilisant le degré de lissage. La force motrice de la ligne est la volatilité, plus elle est grande, plus les li
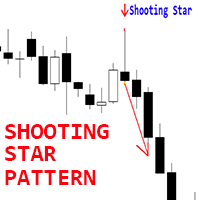
Indicateur Crypto_Forex « Étoile filante » pour MT4.
- L'indicateur « Étoile filante » est un indicateur très performant pour le trading Price Action : aucun changement de couleur, aucun délai. - L'indicateur détecte les étoiles filantes baissières sur le graphique : signal de flèche rouge sur le graphique (voir images). - Alertes PC, mobile et e-mail. - L'indicateur « Étoile filante » est idéal pour combiner les niveaux de support et de résistance.
// D'excellents robots et indicateurs de tr
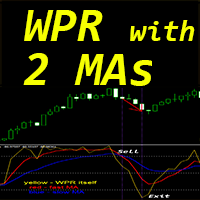
Indicateur Crypto_Forex "WPR et 2 moyennes mobiles" pour MT4, sans repeinture.
- WPR lui-même est l'un des meilleurs oscillateurs pour le scalping. - L'indicateur "WPR et 2 moyennes mobiles" vous permet de voir les moyennes mobiles rapides et lentes de l'oscillateur WPR. - L'indicateur donne la possibilité de voir les corrections de prix très tôt. - Il est très facile de configurer cet indicateur via des paramètres, il peut être utilisé sur n'importe quelle période. - Vous pouvez voir les cond
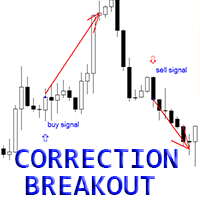
Indicateur Crypto_Forex « Modèle de cassure de correction » pour MT4.
- L'indicateur « Modèle de cassure de correction » est un indicateur très performant pour le trading d'action des prix : aucun changement de couleur, aucun délai. - L'indicateur détecte les barres de cassure haussières et baissières après une correction de prix : - Modèle de cassure de correction haussière : signal de flèche bleue sur le graphique (voir images). - Modèle de cassure de correction baissière : signal de flèche
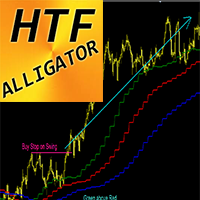
Indicateur Crypto_Forex Alligator Higher Time Frame pour MT4.
- L'indicateur Alligator est l'un des indicateurs de tendance les plus puissants. HTF signifie Higher Time Frame. - Cet indicateur est idéal pour les traders de tendance et peut être combiné avec des entrées Price Action. - L'indicateur HTF Alligator vous permet d'intégrer un Alligator Higher Time Frame à votre graphique actuel. - N'envisagez des entrées d'achat que lorsque la ligne verte est supérieure à la ligne rouge et que la li
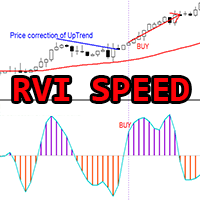
Indicateur Crypto_Forex « RVI Speed » pour MT4, sans retouche.
- Le calcul de cet indicateur est basé sur des équations physiques. Le RVI Speed est sa dérivée première. - L'indice de vigueur relative (RVI) est un indicateur de momentum technique très utile sur les marchés en tendance. - Le RVI Speed est idéal pour les entrées de momentum après une correction des prix dans le sens de la tendance principale. - Utilisez-le en combinaison avec un indicateur de tendance approprié, par exemple l
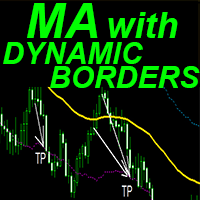
Indicateur Crypto_Forex « Moyenne Mobile avec Bordures Dynamiques » pour MT4.
- L'indicateur possède une fonctionnalité unique : les Bordures de Volatilité Dynamiques. - Les Bordures de Volatilité Dynamiques utilisent les valeurs de la Plage Vraie Moyenne pour le calcul. - Cet indicateur est idéal pour le ciblage TakeProfit et la configuration SL sur les lignes de bordure. - L'indicateur est également idéal pour combiner avec les signaux Price Action.
// D'excellents robots et indicateurs de
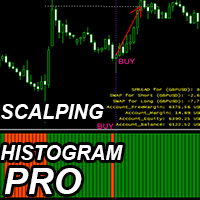
Indicateur Crypto_Forex « Scalping Histogram Pro » pour MT4, sans retouche.
- L'indicateur Scalping Histogram Pro permet de rechercher des signaux d'entrée dans la direction principale de la dynamique des prix après une légère correction. - L'indicateur Scalping Histogram Pro est disponible en deux couleurs : orange pour une dynamique baissière et vert pour une dynamique haussière. - L'affichage d'au moins 10 barres consécutives de la même couleur sur l'histogramme indique une forte dynamique.
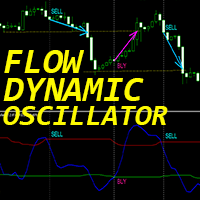
« Dynamic Flow Oscillator » est un indicateur Crypto Forex personnalisé avancé, un outil de trading efficace pour MT4 !
- Nouvelle génération d'oscillateurs - voir les images pour comprendre leur utilisation. - L'oscillateur Dynamic Flow dispose de zones de survente/surachat adaptatives. - L'indicateur utilise les données de prix et de volume pour identifier les zones de survente et de surachat. - L'oscillateur est un outil auxiliaire permettant de trouver des points d'entrée précis dans les z

Nom du Produit A arca Fonctionnalités Principales Identification Automatique des Zones Clés
A arca détecte et met en évidence automatiquement les niveaux de support et de résistance, facilitant l’identification des points d’entrée et de sortie potentiels. Signaux d’Achat et de Vente Clairs
Affiche des marqueurs pour indiquer les opportunités d’achat et de vente, aidant les traders à déterminer le moment optimal pour ouvrir ou fermer une position. Analyse Multi-Unités de Temps
Intègre des donn
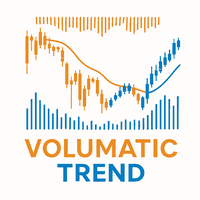
Volumatic Trend is a powerful, trend-following indicator that merges directional analysis with real-time volume behavior. By combining adaptive trend logic and volume overlays, it gives traders a detailed snapshot of market conviction and potential turning points. From instant trend shift detection to volume-weighted candle visuals, this tool brings deeper context to price movement. MT5 Version - https://www.mql5.com/en/market/product/136211/ Join To Learn Market Depth - https://www.mql5.com/
FREE
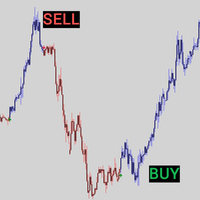
Special offer! https://www.mql5.com/ru/users/bossik2810 Arrow Candle - These are colored candles that show the trend based on volume and trend slope. This indicator will show you the color change on the next bar of the confirmation candle. Blue candles = possible buy (volume is increasing), Red candles = bullish weakness (volume is decreasing) possible sell. Arrow Candle is optimized for trading in any market and can be used in trending and non-trending markets. The Super Multiplier parameter
FREE

MarketSessions Indicator The Essential Tool for Global Market Session Visualization The MarketSessions indicator is a powerful MT4 tool designed to help traders visualize major forex market sessions directly on their charts. By clearly displaying the active trading hours of Sydney, Tokyo, London, and New York markets, this indicator helps you identify optimal trading periods and understand market volatility patterns. Key Features: Clear visualization of all four major trading sessions (Sydney, T
FREE
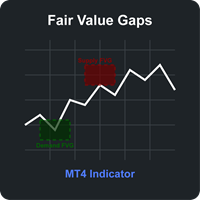
Fair Value Gaps (FVG) Indicator for MT4 The Fair Value Gaps (FVG) Indicator is a powerful technical analysis tool designed to identify and visualize significant price imbalances in the market. These gaps, created when price makes a strong directional move, represent areas where price has moved so quickly that no trading activity occurred, potentially indicating institutional interest and strong market momentum. Key Features: Dual Gap Detection : Automatically identifies both Supply FVGs (bearish
FREE
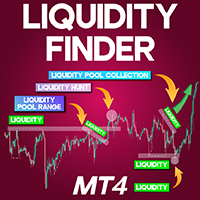
Liquidity Finder Indicator MT4
The Liquidity Finder Indicator MT4 is a powerful tool integrated into MetaTrader 4 (MT4) that assists traders in detecting zones of high liquidity concentration. This indicator automatically highlights both dynamic (angled) and static (horizontal, dotted) trend lines, offering insight into areas where price is likely to react. Static lines often align with significant chart patterns like Double Tops or Double Bottoms, acting as key markers for potential liquidity z
FREE
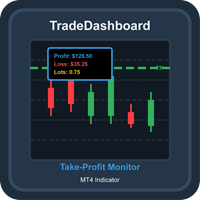
TradeDashboard Comprehensive MT4 Indicator for Trade Visualization and Analysis Overview TradeDashboard is a powerful MetaTrader 4 indicator designed to enhance your trading experience by providing real-time visualization of take-profit levels for all open positions. This advanced tool goes beyond basic TP indicators by displaying comprehensive metrics including potential profits, losses, and total lot sizes, all directly on your chart. Key Features Take-Profit Visualization : Clearly displays h
FREE
123456789101112131415161718192021222324252627282930313233343536373839404142434445464748495051525354555657585960616263646566676869707172737475767778798081828384858687888990919293949596979899100101102103104105106107108109110111112113114115116117118119120121122123124125126127128129130131132133134135136137138139140141142143144145146147148149
Le MetaTrader Market est la seule boutique où vous pouvez télécharger un robot de trading de démonstration gratuit pour le tester et l'optimiser à l'aide de données historiques.
Lisez l’aperçu de l'application et les avis d'autres clients, téléchargez-la directement sur votre terminal et testez un robot de trading avant de l'acheter. Seul MetaTrader Market vous permet de tester gratuitement une application.
Vous manquez des opportunités de trading :
- Applications de trading gratuites
- Plus de 8 000 signaux à copier
- Actualités économiques pour explorer les marchés financiers
Inscription
Se connecter
Si vous n'avez pas de compte, veuillez vous inscrire
Autorisez l'utilisation de cookies pour vous connecter au site Web MQL5.com.
Veuillez activer les paramètres nécessaires dans votre navigateur, sinon vous ne pourrez pas vous connecter.