Regardez les tutoriels vidéo de Market sur YouTube
Comment acheter un robot de trading ou un indicateur
Exécutez votre EA sur
hébergement virtuel
hébergement virtuel
Test un indicateur/robot de trading avant d'acheter
Vous voulez gagner de l'argent sur Market ?
Comment présenter un produit pour qu'il se vende bien
Nouveaux indicateurs techniques pour MetaTrader 4 - 93
Profits are on the way! This indicator is SO SIMPLE… when the red Drop Coming arrow appears, a price drop may be on the way! When more than one "Drop Coming" signal appears on a bull run, that means the drop is getting closer. HOW TO USE 1. When the red "Drop Coming" arrow appears, a price drop may be on the way! To get the best setting it's a matter of tweaking the indicator until it gives you the best results. Our recommendation, and what our traders do is open their chart and move the input n

You’ll love how you can receive alerts to your email and SMS when the candles turn green or red signifying the best buy and sell times in correlation to confirmed uptrends and downtrends. TO USE 1. Buy when green candles appear - this represents an uptrend. 2. Sell when red candles appear - this represents a downtrend. EXTRA FEATURE This indicator NEVER repaints so when a candle closes, that color is final. Also, the blue trend lines in the photos are not included, this is to demonstrate the pri
Wouldn’t you love a heads up alert when the market is switching from bullish to bearish momentum? When the background turns green, there is your signal to place a long trade to increase your profitability. Also, when the background turns red, guess what? It’s time to go short for profits. HOW TO USE 1. When the background turns green, this is the best place to take long trades. This also represents a bull market. 2. When the background turns red, this is the best place to take short trades. This

You’re going to love this! We have coded in the ability for you to be alerted by email or SMS when the Green Buy Line crosses below the Red Stop-loss line signaling a sell. And to take it one step further to increase your profits, we coded in the ability for you to be notified with the Price crosses down below the Green Buy Line or below the Red Stop-loss Line to give you earlier exit opportunities. HOW TO USE 1. Buy when the green buy line crosses above the blue trend line. You can also buy whe

Oscillatory price direction indicator for Forex. It has 2 operating modes - trend and scalping. The trend mode of operation allows you to determine the direction of the market movement in the medium term.
The scalping mode works by determining the price movement in the short term. Consists of a blue line, from which the balance between the directions of the price and signal green / red line.
The green line shows the direction of the price up, and the red line shows the direction of the price dow
特徴: MTF Moving Averageを8本一気に表示してくれるインジケータになります。 8本も必要ない場合にももちろん非表示にできます。
どの通貨でも使用可能になります。 それぞれのMTF Moving Averageの色や太さを変更できます。 各パラメータの説明: Method:MAの種類設定をします。 Applied price:MAで使用する価格を設定をします。 TimeFrame M5:使用するMAの時間足を設定します。 Period M5:使用するMAの期間を設定します。 ※ラベルに関係なく8本のMTF MAはどの時間足でも期間設定可能になります。
Update Frequency(seconds):MTF Moving Averageの再作成更新頻度を入力します。

Zig-Zag indicator with additional signals for inputs.
Visually easy to use:
The red zig-zag line is an uptrend. The blue zig-zag line is a downward trend. Arrows in the form of additional signals.
Works on any trading pairs. On any timeframe.
Not redrawn.
Input parameters
Zig-Zag Period - Zig-zag period (from 5) Signal Period - period of signal arrows (from 3) Alerts for signals
Play sound - Sound alert Display pop-up message - Notification by message on the screen Send push notification

Currency Strength Meters are a great way to identify strong and weak currencies. With this CSM indicator attached to your chart, you will get a clear overlook over the 8 major currencies: USD, EUR, JPY, CAD, CHF, GBP, AUD, and NZD.
Suggested timeframes to scan is: M15 - H1 - H4 - Daily You can however just change timeframe to check in the settings. Bear in mind that scanning very low timeframes such as M1 will require a lot of resources and might make your mt4 terminal slow.
The strength sca

Winner Overbought Oversold
Winner Overbought Oversold indicators are best suited for overbought/oversold analysis. Basically, there are two types of momentum oscillators: bound and unbound. Bound oscillators, such as this, fluctuate within a specific range. The most popular indicators used to identify overbought and oversold conditions are the relative strength index (RSI) and the stochastic oscillator . But you need a second conformation for entry and exit position from forex market. T
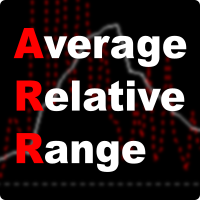
ARR indicator is similar to ATR but it returns percent range in relation to open price of given bar. It is mostly useful for cryptocurrency symbols where ATR ranges from years ago can't be directly compare with current values. First buffer (red dotted line) represents percent range of single bar and second buffer (white solid line) represents simple average of defined number of last bars. Only one input, PERIOD relates to number of bars used for average calculation (in default equals to 14).
FREE

Présentation de ProEngulfing - Votre Indicateur de Modèle Engulf Professionnel pour MT4 Libérez la puissance de la précision avec ProEngulfing, un indicateur de pointe conçu pour identifier et mettre en avant des modèles engulf qualifiés sur le marché du forex. Développé pour MetaTrader 4, ProEngulfing offre une approche méticuleuse de la reconnaissance des modèles engulf, garantissant que vous ne recevez que les signaux les plus fiables pour vos décisions de trading. Comment fonctionne ProEngu
L'outil ultime que chaque trader de spread attendait. Cet indicateur puissant pour MetaTrader vous permet d'insérer n'importe quelle paire d'instruments de votre choix, vous offrant une flexibilité sans précédent dans vos stratégies de trading. Aucun des deux instruments n'a besoin d'être le symbole sur lequel l'indicateur est placé, vous permettant un contrôle total sur votre analyse. Qu'est-ce qui rend le Zero Based Spread Oscillator unique ? Oscillation réelle autour de zéro : Contrairement
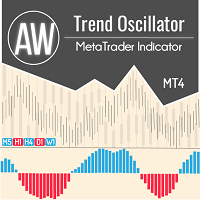
Oscillateur de tendance avec système de filtrage avancé. Il détermine la tendance, son affaiblissement et son renforcement. Possède un panneau multi-période intégré. AW Trend Oscillator fonctionne sur toutes les périodes et sur tous les symboles (devises, indices, pétrole, métaux, actions). MT5 version -> HERE / Problem solving -> HERE Caractéristiques et avantages:
Filtrage avancé des tendances Modification de la sensibilité de l'indicateur en un clic Installation facile Panel multi-période
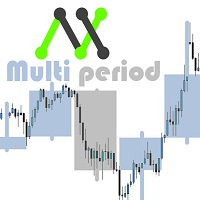
With this customizable indicator you will be able to observe other timeframes besides the usual one. This way you will get to know better the general environment in which the price moves and probably will be better your effectiveness. *It is important that the timeframe in the indicator is greater than that set in Metatrader. I'll share more indicators for free soon. If you have any specific ideas of an indicator that you want to have you can write me a private message directly. Opinions, review
FREE
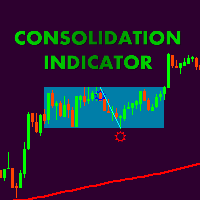
Сonsolidation box indicator with possibility of flexible settings according to the traiders requipments. Also, it is possible to embed indicatior in EA. Thank Alexey Mavrin for realization of technical task. According to the classic technical analysis the price is in motion without a clear direction for almost 70% of the market time and methods of getting profit from flat should be in the arsenal of any trader. Price consolidation- are periods of market equilibrium when supply and demand are app
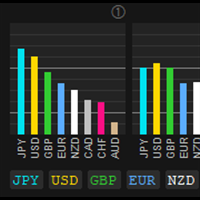
CS Info [Currency Strength Information] CS Info is the real-time MTF calculation of 28/34 symbols for the strength of 8 currencies/XAU - AUD, CAD, CHF, EUR, GBP, JPY, NZD, USD and XAU. It analyses the trend or momentum/strength of all 8 currencies and XAU to determine high probability currency combinations and trading opportunities.
Key Features Floating position - with click on Control to select and move
Mode A/Mode B for presentation of CS Calculation FX or FX/XAU to change FX or FX/XAU Ac

Fact shows favorable moments for entering the market. The indicator can work both for entry points, and as the filter. Uses two settings.
This is a hybrid trend indicator, as it is based on the signals of elementary indicators and a special algorithm for analysis. The intelligent indicator algorithm accurately detects the trend, filters market noise and generates input signals.
The indicator uses a color alarm: blue - when changing from descending to ascending, and red - on the contrary, to d

SETI is a Break indicator multipair searching SETI is a powerful indicator of for any par and any timeframe. It doesn't requires any additional indicators for the trading setup.The indicator gives clear signals about opening and closing trades. This Indicator is a unique, high quality and affordable trading tool. Can be used in combination with other indicators Perfect For New Traders And Expert Traders Low risk entries. Never repaints signal. Never backpaints signal. Never recalculates
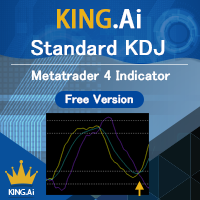
The standard KDJ indicator is presented by KING.Ai. This indicator were built base on the the theory of KDJ . KDJ is a very effective and useful strategy to trade especially in swing trading. Method to apply (please also refer to the graphic): 80/20 rule: Price from bottom to top 20 to 80. And price from top to bottom 80 to 20. Both is enter market signal. Indicator period: The indicator is made by period 9,3,3 KING.Ai Forex trader believe that such strategy must complement with other indicato
FREE

Hello this Indicator will draw Channels to help you to take decision to buy or sell or waiting you can show one channels or two or tens of channels if you want please watch our video for more details https://www.youtube.com/watch?v=5Cq_l9I3Yr0 good luck -------------------------------------------------------------- السلام عليكم هذا المؤشر يرسم قنوات سعرية لمساعدتك على اتخاذ قرار الشراء أو البيع أو الانتظار يمكنك عرض قناة واحدة أو قناتين أو عشرات القنوات إذا أردت يرجى مشاهدة الفيديو لمزيد من التف

The Deviator trend indicator in calculations uses reliable algorithms. It shows favorable moments for entering the market with arrows, that is, using the indicator is quite simple.
Shows successful signals - can be used with an optimal risk ratio. The indicator can be used both for pipsing on small periods, and for long-term trading.
It uses only one parameter for setting, which sets the number of bars for calculation.
It works on all currency pairs and on all timeframes. Of course, the appr

The Trend ADW indicator can be used both for piping for small periods and for long-term trading. When using, it is recommended to look at an additional indicator for a filter of possible false signals.
The indicator shows the direction of the trend, signaling this using pivot points. It can be used with an optimal risk ratio. The arrows indicate favorable moments and directions for entering the market. Uses one parameter to adjust (adjust from 1 to 3). It works on all currency pairs and on all
BBMA Dashboard Fx This is a Multi pair and Multi time frame dashboard. The founder of the system is Mr. Oma Ally, which is a system based from Bollinger Band and Moving Average( BBMA ).
BBMA consists of the use of 2 indicators: Moving Averages Bollinger Bands BBMA consists of 3 types of entries: Extreme MHV Re-Entry This Dashboard Help you to scan current Extreme and Reentry setup ( MHV not included).
The features of BBMA Dashboard : 1.Current TRENDS in Market Based on BBMA method. De

Teknolojide ki yüksek gelişim, üretim, e ticaret, lojistik vb tüm sektörlerde kullanıma başlandığı gibi artık finansal piyasalarda da “ yapay zeka ve algoritma” kullanılmaya başlandı. Smart Algoritma indikatörü; kaynak kodu içinde yer alan algoritma ve yapay zekası ile hiçbir analize ihtiyaç duyulmadan gün içi bütün forex enstrümanları için size buy ve sell sinyalleri yanında hedef kanal (gün içi en yüksek ve en düşük seviyeler) verir. İndikatör texti aşağıda ki bölümlerden oluşur ve herkesin a

Smart Gread Ultimate Edition (SGUL) indicator - based on smart order grid strategy.
Maximum customization and flexibility of strategies are the main features of this indicator.
In the right corner there is a table with the number and volume of orders.
List of adjustable parameters:
K: 2.0 - Factor of the next order increase (if the price moves in the other direction).
TP: 50 - The number of points at which the order is closed with a profit (minimum profit per 1 lot).
Step: 80 - The numb

パラボリックのデータをもとにトレンドの方向性を1分足から月足まで表示します。 1分足から 月足 まで表示されているので今どの方向に価格が動いているのかがすぐに分かります。 更新はティク毎ではなくディフォルトでは1秒毎、もちろん変更も可能なのでチャートの表示が遅くなるようなことはありません。 機能: どの通貨でも表示可能になります。 パラボリックの数値を変更することは可能になります。 上昇時と下降時のアイコンの色を指定することが可能になります。 表示位置(Y軸)が変更可能 になります。 表示位置 (左上 、 右上 、 左下 、 右下) が 指定 が可能 になります。 フォント を指定することが可能になります。 フォントサイズ が 変更可能 になります。 アイコンのサイズ が 変更可能 になります。 週足、 月足 の非表示 が 可能 になります。
FREE
SYSTEM INTRODUCTION: The Binary Options Conqueror System Is Specifically Designed For Binary Options Trading. Unlike Other Systems And Indicators That Were Adopted From Other Trading Environments For Binary Options. Little Wonder Why Many Of Such Systems Fail To Make Money . Many End Up Loosing Money For Their Users. A Very Important Fact That Must Be Noted Is The Fact That Application Of Martingale Is not Required. Thus Making It Safer For Traders Usage And Profitability. A Trader Can Use F

This algorithm is created for you to receive alerts as to when the green stochastic line has crossed above the red stochastic line to launch a long trade and vice-a-versa for short trades. This indicator is a work horse for your profit picture! HOW TO USE 1. When the green stochastic line has crossed above the red stochastic line with a green background, this is an ideal place for a long entry. 2. When the green stochastic line has crossed below the red stochastic line with a red background, thi
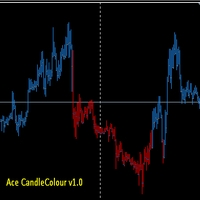
if you prefer to trade manually on forex, maybe this can help you to analyze and when to open orders. u can use anytimeframe and pair forex , how to use it ? simple Blue Colour = Trend is Up White Colour = Trend Sideway Red Colour = Trend is Down Timeframe recommend m15 - day 1 When is the order start time? for example, if the color now comes out blue, wait for shift candle 3 after the last color comes out. if the color is still the same and does not change immediately open a buy position.
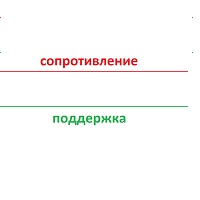
Торгуя на рынке форекс, многие используют уровни поддержки сопротивления убеждая себя что, если цена закрепится выше-ниже уровня, рынок пойдет далее по направлению-данное убеждение работает только в том случае, если учитывается направление движения рынка с более старшего временного интервала! Исходя из выше сказанного был написан индикатор уровней который рассчитывается по математической формуле Индикатор уникален тем, что он помимо основных уровней, учитывает и уровень с более старшего временно
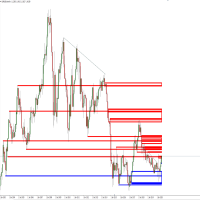
This product makes your trend lines perfectly horizontal and brings them to present automatically. SPEND YOUR TIME TRADING AND NOT FORMATTING TREND LINES! Makes for the cleanest of charts! This product is ideal for S/D, S/R, and other technical analysis styles! The most important part is that you won't know how you ever traded with out it! First month is free!

Advanced version of CyberZingFx Volume Plus, the ultimate MT4 indicator for traders seeking highly accurate buy and sell signals. With an additional strategy and price action dot signals that enhances its effectiveness, this indicator offers a superior trading experience for professionals and beginners alike. The CyberZingFx Volume Plus Advanced version combines the power of volume analysis and historical price data with an additional strategy, resulting in even more precise and reliable signals

NEW YEAR SALE PRICE FOR LIMITED TIME!!! Please contact us after your purchase and we will send you the complimentary indicators to complete the system Cycle Sniper is not a holy grail but when you use it in a system which is explained in the videos, you will feel the difference. If you are not willing to focus on the charts designed with Cycle Sniper and other free tools we provide, we recommend not buying this indicator. We recommend watching the videos about the indiactor and system before pu

Indicateur de Rupture de Force des Devises (Currency Strength Breakout Indicator)
Obtenez un avantage dans votre trading avec l' Indicateur de Rupture de Force des Devises , un outil puissant qui analyse huit devises sur plusieurs périodes de temps (M1, M5, M15, M30 et H1), le tout dans une fenêtre unique et facile à lire. Identifiez les devises les plus fortes et les plus faibles, et tradez les retracements avec précision grâce à des alertes vous aidant à entrer dans les tendances au bon momen
FREE
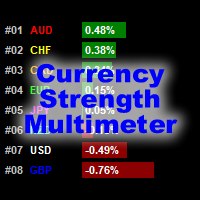
VIEW THE CURRENCY STRENGTH AND PAIR STRENGTH FOR "X" BARS IN A GIVEN TIMEFRAME. The Currency Strength Multimeter indicator shows the strength, direction and rank of each of the following currencies: AUD CAD CHF EUR GBP JPY NZD USD Furthermore, it also shows the strength, direction and rank of each of the following currency pairs: AUDCAD AUDCHF AUDJPY AUDNZD AUDUSD CADCHF CADJPY CHFJPY EURAUD EURCAD EURCHF EURGBP EURJPY EURNZD EURUSD GBPAUD GBPCAD GBPCHF GBPJPY GBPNZD GBPUSD NZDCAD NZDCHF NZDJPY

Buy and sell signals using the MACD histogram. The interface is simple and easy to understand. You can perzonalize the indicator in several ways according to its visual style or even more importantly, its setting of parameters to detect market signals. Using the Multiplier option in the menu you can increase the indicator period although it is recommended to use the default settings.
FREE

Based on a combination of indicators, E13 Acid Fulx is an excellent indicator for knowing when to buy or sell on any asset and temporaryity. The indicator myself I have used it as a tool for my analysis when trading Forex. It is a useful and easy-to-understand trend indicator. If you combine it with your own analyses you will surely get a good result in your operation.
FREE

Based on a combination of indicators, PS Acid Fulx is an excellent indicator for knowing when to buy or sell on any asset and temporaryity. The indicator myself I have used it as a tool for my analysis when trading Forex. It is a useful and easy-to-understand trend indicator. If you combine it with your own analyses you will surely get a good result in your operation.
FREE

The principle of this indicator is very simple: detecting the trend with Moving Average, then monitoring the return point of graph by using the crossing of Stochastic Oscillator and finally predicting BUY and SELL signal with arrows, alerts and notifications. The parameters are fixed and automatically calculated on each time frame. Example: If you install indicator on EURUSD, timeframe M5: the indicator will detect the main trend with the Moving Average on this timeframe (for example the Moving

The Reaction indicator forms arrows (by default, red and blue). The indicator is set in the usual way to any trading symbol with any time interval.
This is an indicator of trend and trading signals, based on the principle of a combined analysis of calculated reference points within the channel as well as overbought and oversold levels.
Input parameters Period - indicator period; LevelUp - overbought level; LevelMid - balance level; LevelDown - oversold level.
Indicator Benefits High accuracy

Cluster indicator working in the price channel. For operation, the indicator builds a channel line - (dashed line).
Inside the channel, cluster sections are determined that determine the direction of the price movement - (histograms in two directions),
start with large arrows. Small arrows are plotted above / below each histogram - indicator increase volatility.
The indicator does not redraw the values.
Works on any tools and timeframes. Entrances are made when large arrows appear, inside small

The indicator is designed to trade binary options on small time frames up to m 30 Signals The blue up arrow is a buy signal. The red dn arrow is a sell signal. The signal will appear together with the advent of a new candle and during formation Signals on the current candle Expiration time one candle from the timeframe on which you are trading You can use moving average to filter out false signals. Or escort support levels. This tool is reliable in trading.

The Fixed Event indicator shows points for entering the market, points of potential market reversal.
The indicator combines several progressive algorithms. Combined systems for analyzing historical data are projected onto lines in the form of straight lines connecting extremes. That is the pivot point of the market. These extremes or pivot points of the market can be used as level lines! Which is very convenient for finding support and resistance lines. Ready trading system.
Uses one paramete

The key difference between the Trend Canal indicator and other channel indicators (for example, from the Bollinger indicator) is that Trend Canal takes into account not simple moving averages, but twice smoothed ones, which allows one to more clearly determine the market movement, and on the other hand makes the indicator less sensitive. Trend Canal is a non-redraw channel indicator based on moving averages.

Hello this Indicator can Change TimeFrame easily and faster for current chart only or for all charts in same time (very fast) you can change it by press any number from 1 to 9 please watch our video https://www.youtube.com/watch?v=f6jWz_Y7dMs good luck -------------------------------------------------------------- السلام عليكم هذا مؤشر لتغيير الفريم للشارت الحالي او لجميع الشارتات بشكل اسرع وأسهل يمكنك تغيير الفريم بالضغط على اي رقم من 1 الى 9 بحيث يتمت غيير فريم الشارت الحالي فقط او جميع الشار
Check out other great products from https://www.mql5.com/en/users/augustinekamatu/seller
This indicator is the best so far at estimating reversal points especially on high time frames. It does not repaint and is based on a combination of moving averages computed using custom functions. No inputs required, it is simple plug and play. The principles used ensure that it can be used on CFDs, Commodities and Stock with incredibly great results. With proper money management and portfolio balancing
FREE
The indicator informs when the current bar closes and a new bar opens. TIME is an important element of trading systems. BarTimerPro indicator helps you CONTROL THE TIME . Easy to use: place on the chart and set “alarms” if it necessary. In the tester, the indicator does not work. See the Lite version BarTimerPro-Lite
Key Features
4 operating modes: Shows the time elapsed since the opening of the current bar (11) Shows the time remaining until the current bar closes (11) Indicator Updates Every
FREE

The indicator informs when the current bar closes and a new bar opens. TIME is an important element of trading systems. BarTimerPro indicator helps you CONTROL THE TIME . Easy to use: place on the chart and set “alarms” if it necessary. In the tester, the indicator does not work. Key Features
Shows the time elapsed since the opening of the current bar Indicator Updates Every Second Setting the appearance (31-36) and the location (21-24) of the indicator, changing all texts (41-50). 4 types of “
FREE

Please check the " What's new " tab regularly for a complete and up-to-date list of all improvements + parameters. FREE indicator for my trading utility Take a Break . This indicator allows you to manage multiple other EAs with just one Take a Break EA instance. Simply specify the corresponding Chart Group in the indicator(s) and Take a Break EA settings and you are good to go.
Setup examples (Indicator + EA)
As a prerequisite, add the URL https://trading.custom-solutions.it to the list of al
FREE
Machine translation of the following: This indicator is used to close or open the price and time scales.Select true to display scale and false to close scale.After the price scale is closed and then opened, it may show that it is not at all. But it can be solved by switching time cycle.This indicator has two tags, D and P, which can be opened or closed in real time by clicking.The related parameters can be modified by user, such as the name, position and coordinates of the label.
FREE
Fully automated Forex Expert advisor that trades with accuracy. With volatility it executes pending orders and secures the safe entry .
No special indicator is used.
Just catch the market movement with special algorithms Recommended pair is Eur/Usd
Can be started with only $50 1% to 2% Draw Down only 20% to 25% monthly return Tight SL with good TP Developed for Metatrader 4
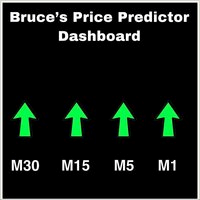
This is a Dashboard Indicator based on Bruce's Price Predictor Indicator . This Dashboard will Give you a visual to see the trend direction without having to flip through timeframes, so you can always be trading in direction of the trend, with little effort. I Recommend www.CoinexxBroker.com as a great broker and the one I personally use
*Non-Repainting Dashboard Arrows *For Desktop MT4 Only *Great For Scalping *Great For Swing Trading *Dashboard Arrow Entry Alerts *Dashboard Arrow Signals
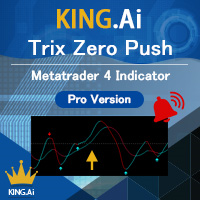
The brand new trading indicator using TRIX strategy is exclusive presented by KING.Ai. Exclusive Functions including Mobile Push Notification . This indicator with Three-mode alerts is developed by KING.Ai ONLY. It is probably impossible that you could find a TRIX indicator like this one. It is very difficult for you to trade with the Trix strategy as there is limited time for traders to monitor every currency. However, the Trix strategy is very profitable especially using in DAY CHAT. It
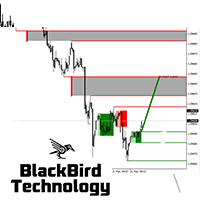
Multi Signal Indicator contains a whole series of intersting buy,sell and exit signals that can be separately turned on/off. Signals : Liquidity Pools Liquidity Pools Forecast Projection Reversal Blocks Pinbar groups Overbought/Oversold with Moving Average Band (5 MA bands) Moving Average Difference Liquidity is an important aspect in the market, especially for institutional investors, as they need lots of liquidity to enter or exit the market. Therefore, institutional traders focus more on dema
指标功能:完成十字光标跟随,多个窗口鼠标位置的同步显示。 功能 开启 :点击"H"标签,标签变成"S",开启十字光标,通过鼠标点击,完成第二个以上窗口的位置同步。 可以大周期同步小周期 (注意:在大周期同步小周期时,要注意小周期中的数据是否足够多) , 也可以小周期同步大周期。 功能关闭:点击 "S"标签,会变成"H"。或者通过键盘的"ESC"键,关闭。
指标可以多个窗口加载,也可以单窗口加载。
参数设置: LabWindow:标签显示的窗口 LabConer :标签显示的角落位置 LabX :标签位置横坐标 LabY :标签位置竖坐标 LabShowBackup :标签背景显示于背景 LabFontName :标签的字体名称 LabFontSize :标签的字体大小
FREE

Este indicador Tick Bid Transaction identifica las ventas que ofrece tu Broker. Relaciona el volumen “no real” y los Ticks de la demanda de un cierto modo, luego el algoritmo marca con un punto donde se realiza una transacción, según el tamaño del punto significa que la venta es mayor o menor o, hubo muchas ventas al mismo tiempo lo que nos dice que si el punto es muy grande es muy probable que el Activo baje como así también si hay una cierta acumulación de puntos de diferentes tamaños. Este in

Este indicador Tick Ask Transaction es representado en una ventana separada tick a tick del Ask e identifica las compras que ofrece tu Broker. Relaciona el volumen “no real” y los Ticks de la oferta de un cierto modo, luego el algoritmo marca con un punto donde se realiza una transacción, según el tamaño del punto significa que la compra es mayor o menor o, hubo muchas compras al mismo tiempo lo que nos dice que si el punto es muy grande es muy probable que el Activo suba como así también si hay
DPPD (Dynamic Price Percent Deviation) is a simple yet effective indicator following the rule "buy low, sell high". Indicator can send e mail, alert, and MQL ID push notifications. There is also a possibility to set an individual personal notification at any deviation level. Individual notification can have an added individual comment. Why is DPPD dynamic? Because deviation is not measured from a static point. Deviation is measured as a price deviation from a given average in percent. Reccommend

The principle of this indicator is very simple: detecting the trend with Moving Average, then monitoring the return point of graph by using the crossing of Stochastic Oscillator and finally predicting BUY and SELL signal with arrows, alerts and notifications. The parameters are fixed and automatically calculated on each time frame. Example: If you install indicator on EURUSD, timeframe M5: the indicator will detect the main trend with the Moving Average on this timeframe (for example the Moving
The principle of this indicator is very simple: detecting the trend with Moving Average, then monitoring the return point of graph by using the crossing of Stochastic Oscillator and finally predicting BUY and SELL signal with arrows, alerts and notifications. The parameters are fixed and automatically calculated on each time frame. Example: If you install indicator on EURUSD, timeframe M5: the indicator will detect the main trend with the Moving Average on this timeframe (for example the Moving

The AI That Puts You Ahead of the Market
You're Losing Trades – And It’s Not Your Fault. The market is ruthless. You analyze charts, test strategies, follow indicators—yet profits slip through your fingers. Why? Because traditional trading forces you to guess. What if you didn’t have to?
Most strategies are based on hope, not proof. You wouldn’t gamble your money in a casino, so why trade without statistical certainty?
TRADE EXTRACTOR Changes Everything.
This is not just an indicator. It’s

The indicator plots the trend from an EMA of "n" periods and the cycle from another EMA of "k" periods from the previous EMA. This allows the crosses to be much more effective and the amplitude of the cycle allows to verify the strength of the trend. This indicator should be used as a complementary tool to confirm market entry signals. It is possible to add three times the indicator applied to maximum price, minimum price and median price in TimeFrame of one hour for example, in order to identif
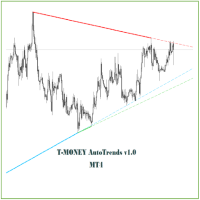
The indicator identifies and graphs the relevant trends (UpTrend and DownTrend) taking the relevant minimum and / or maximum in the market. Likewise, it projects the corresponding direction of the trend that constitutes levels of support for operational decision-making.
A good practice using these trends is to trade on breaks, whether they are confirmed and a counter trend is generated or if the price rejoins the original trend after a false break. You can add more than one trend by modifying
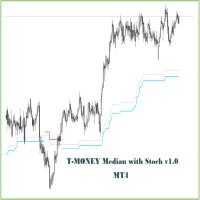
This indicator plots the Median of "n" periods and confirms the crossings with the Stochastic Oscillator. It is an indicator that combines the Median as a determining level of the price cycle and the Stochastic Oscillator for the confirmation of crosses.
It should be used as a complementary or supporting indicator with Price Action or other strategies to validate market entries.
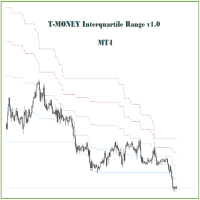
This indicator graphs channels formed by the Local Maximum and Local Minimum of "n" periods and from this channel adds the Median and Interquartile Range. It is important to note that when the price enters the range, the interquartile range is reduced considerably with respect to its historical level, which can be visually warned with this indicator and the operator will have the possibility of deciding to stay out of operations in these conditions of market.
The Q Factor (by default at 0.25 b
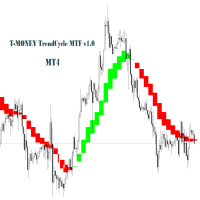
The present indicator is similar to TrendCycle but it allows to graph in any TimeFrame the cycle-trend of a Superior TimeFrame. For example, you can include in the TimeFrame H1, the cycle-trend corresponding to H4 or D1. This is of particular importance for Swing traders or looking for medium-term trends.
It can be used as a support indicator to confirm trends or medium-term trend changes and avoid false breaks.
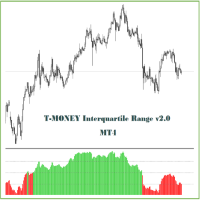
This indicator is similar to "T-MONEY Interquartile I" but it is normalized (on a scale of 0 to 100) and is plotted in a separate window. The normalized interquartile range, the median, and the maximum and minimum zones can be observed. As a visual aid, the green color has been considered in the histogram when the asset is trading above the configured median of "n" periods, and red when the asset is trading below it.
Like its similar, this indicator should be used as a support tool for making

The Price Action Finder indicator is an indicator of entry points, which is designed to search and display patterns of the Price Action system on a price chart. The indicator is equipped with a system of trend filters, as well as a system of alerts and push notifications. Manual (Be sure to read before purchasing) | Version for MT5 Advantages
1. Patterns: Pin bar, Outside bar, Inside bar, PPR, Power bar, Hanging man, Inverted hammer 2. Pattern filtering system. Removes countertrend patterns from

It's a simple but useful tool for creating a grid based on Envelopes.
Only 2 parameters can be set: 1) "Period" - the period of all visible Envelopes (i.e. 4) and 1 Moving Average (Envelopes axis), 2) "Deviations Distance" - the distance between Envelopes.
Naturally, the colors of all 9 lines can be changed as desired. It works with everything that is available in your Market Watch.
Good luck!
FREE

It's a simple but useful tool for creating a grid based on Bollinger Bands .
Only 2 parameters can be set: 1) "Period" - the period of all visible Bollinger Bands (i.e. 4) and 1 Moving Average (axis of all Bollinger Bands), 2) "Deviations Distance" - the distance between Bollinger Bands.
Naturally, the colors of all 9 lines can be changed as desired. It works with everything that is available in your Market Watch.
Good luck!
FREE
Le MetaTrader Market est un magasin unique de robots de trading et d'indicateurs techniques.
Lisez le mémo de l'utilisateur de MQL5.community pour en savoir plus sur les services uniques que nous offrons aux traders : copie des signaux de trading, applications personnalisées développées par des freelancers, paiements automatiques via le système de paiement et le MQL5 Cloud Network.
Vous manquez des opportunités de trading :
- Applications de trading gratuites
- Plus de 8 000 signaux à copier
- Actualités économiques pour explorer les marchés financiers
Inscription
Se connecter
Si vous n'avez pas de compte, veuillez vous inscrire
Autorisez l'utilisation de cookies pour vous connecter au site Web MQL5.com.
Veuillez activer les paramètres nécessaires dans votre navigateur, sinon vous ne pourrez pas vous connecter.