Regardez les tutoriels vidéo de Market sur YouTube
Comment acheter un robot de trading ou un indicateur
Exécutez votre EA sur
hébergement virtuel
hébergement virtuel
Test un indicateur/robot de trading avant d'acheter
Vous voulez gagner de l'argent sur Market ?
Comment présenter un produit pour qu'il se vende bien
Nouveaux indicateurs techniques pour MetaTrader 4 - 30

This indicator presents an alternative approach to identify Market Structure. The logic used is derived from learning material created by DaveTeaches (on X) Upgrade v1.10: add option to put protected high/low value to buffer (figure 11, 12)
When quantifying Market Structure, it is common to use fractal highs and lows to identify "significant" swing pivots. When price closes through these pivots, we may identify a Market Structure Shift (MSS) for reversals or a Break of Structure (BOS) for co
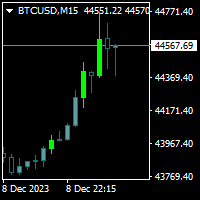
Trendfinder MA Pro are based on Colored candlesticks showing the trend based on two Moving Averages as Signal and two Moving Averages as a Buy and Sell Zone, the slope of the slow Signal moving average and ATR and Volume increasing. This indicator will give you the color change on the next bar on the confirmation candle and will provide alert on Buy and sell signal, when it enters the buy and sell zone and when the market test the buy or sell zones as support or resistance and will never repain
FREE

This indicator is not only for trading but also for learning, thanks to it, you can learn to identify trend, support and resistance.
You've probably heard about the Dow trend theory, where higher highs and higher lows indicate an uptrend, and lower highs and lower lows indicate a downtrend. This indicator determines this trend based on the Dow Theory. You just need to enter a number representing the number of candles between extremes. The optimal solution is the number 3 (H1 TF), unless you wa
FREE

The "Trend Edges" indicator determines whether the trend is rising or falling. It is suitable for any time frame (tested on DAX).
The indicator should be treated like Bollinger Bands, meaning that if it breaks out upwards, you can buy with a stop loss below the lower edge.
Find a trending pair, index or CFD. Additionally :
-Sound alert on trend change.
-Alert Notification
-Alert Notification on your mobile phone Check my other indicator "Trend Edges histogram"
FREE

This indicator is an addition to "Trend Edges."
The "Trend Edges histogram" indicator determines whether the trend is rising or falling. It is suitable for any time frame (tested on DAX).
Find a trending pair, index or CFD. Additionally :
-Sound alert on trend change.
-Alert Notification
-Alert Notification on your mobile phone Check my other indicators.
FREE

Introducing the advanced trading tools of 2023. MTF PPAAF Model S. This is sub window version of my best trading tool : MTF Precise Price Action Arrow Filtered. Click here to learn more about MTF PPAAF . This trading tool is equipped with various powerful features : MTF = Multi Time Frame = Time Frame can be changed. On/off button. Non Repaint Arrows. Customizable parameter, color etc. Can show all time frame (ATF) crossover arrows of fast stochastic main line & fast stochastic signal line (

This indicator provides the ability to recognize the SMC pattern, essentially a condensed version of the Wyckoff model. Once the pattern is confirmed by RTO, it represents a significant investment opportunity. There are numerous indicators related to SMC beyond the market, but this is the first indicator to leverage patterns to identify specific actions of BigBoy to navigate the market. Upgrade 2024-03-08: Add TP by RR feature. The SMC (Smart Money Concept) pattern is a market analysis m

This indicator will show yesterday and today high low, very useful to understand the market sentiment. To trade within the range/ break out. Previous day low- can act as support- can used for pull back or break out Previous day high- can act as resistance- can used for pull back or break out The previous day high low breakout strategy refers to the day trading technique that provides traders with multiple opportunities to go either long or short . The main idea is to identify the trend in its m
FREE

FusionAlert StochRSI Master is an indicator available for MT4/MT5 platforms, it is a combination of RSI & Stochastic indicator which provide "alerts" when the market is inside "overbought and oversold" regions combined for both indicators, results in more precise and accurate signals to be used as a wonderful tool, in the form of "buy or sell" signals. This indicator comes with many customization options mentioned in the parameter section below, user can customise these parameters as needful. Jo
FREE

QuantumAlert RSI Navigator is a free indicator available for MT4/MT5 platforms, its work is to provide "alerts" when the market is inside "overbought and oversold" regions in the form of "buy or sell" signals. This indicator comes with many customization options mentioned in the parameter section below, user can customise these parameters as needful. Join our MQL5 group , where we share important news and updates. You are also welcome to join our private channel as well, contact me for the pri
FREE

This indicator is a histogram showing the trend based on 3 different moving averages. When all averages are set in ascending order, the indicator is green, and when in descending order, it is red. If the averages do not show a trend, the color is yellow. Additionally, each average can have different settings, such as Mode MA and Price MA. You can also set an alert and receive notifications on your phone.
To enable the alert and push notification, you need to activate them first in the MT4 settin
FREE

The risk-to-reward ratio is used for assessing the potential profit (reward) against the potential loss (risk) of a trade. Stock traders and investors use the R/R ratio to fix the price at which they'll exit the trade, irrespective of whether it generates profit or loss. A stop-loss order is generally used to exit the position in case it starts moving in an opposite direction to what a trader anticipated.
The relationship between the risk and reward helps determine whether the potentia
FREE

The indicator still has a few bugs but is ready for testing.
This is my first indicator that determines entry and exit points. The entry point is based on breaking the peaks determined by a channel indicating highs and lows (invisible channels). TP1 is a probable target at which most positions can be closed. The channel determining the opening and closing of positions is based on different assumptions. The red stop loss line is determined based on lows and highs.
The stop loss can be adjusted a
FREE

QuantumAlert Stoch Navigator is a free indicator available for MT4/MT5 platforms, its work is to provide "alerts" when the market is inside "overbought and oversold" regions in the form of "buy or sell" signals. This indicator comes with many customization options mentioned in the parameter section below, user can customise these parameters as needful. Join our MQL5 group , where we share important news and updates. You are also welcome to join our private channel as well, contact me for the p
FREE
WONNFX iSTATS - information indicator showing profit/loss on your MT4 account (pips, lots, currency, percentage) current profit profit for today profits for the current week profits for the current month profit for the current quarter profit for the current year
A convenient format for displaying statistics of your trading account in real time. (the indicator can be installed on any MT4 terminal chart)
FREE

QuantumAlert CCI Navigator is a free indicator available for MT4/MT5 platforms, its work is to provide "alerts" when the market is inside "overbought and oversold" regions in the form of "buy or sell" signals. This indicator comes with many customization options mentioned in the parameter section below, user can customise these parameters as needful. Join our MQL5 group , where we share important news and updates. You are also welcome to join our private channel as well, contact me for the pri
FREE

The Cossover MA Histogram indicator is a simple tool showing the trend based on crossover of moving averages. Simply specify two mobving averages and addicional parameters like MA method and Applied price. When fast MA is above slow MA the histogram is green, indicating an uptrend. When MA fast is below MA slow the histogram is red, indicating an downtrend.
FREE

Are you searching for a tool that can uncover hidden market imbalances and guide your trading decisions? Look no further than the Fair Value Gap Indicator. This powerful tool acts as a magnet, pulling the price back to its starting point before making a move. By identifying these gaps on charts, you can take advantage of bearish bias trades and predict potential future price movements with greater accuracy. Created by a three-candle sequence, the Fair Value Gap Indicator is suitable for both bul

Just another plain Super Trend indicator.
On this one i have added another buffer (on index 2) which can be used on EA; the values is -1 to identify a bearish trend while for bullish trend the value is 1.
Here a code snippet:
int trend = ( int ) iCustom ( NULL , Timeframe, "SuperTrend" , Period , Multiplier, 2 , 1 ); It work on every timeframe.
If you need help to integrate it on your EA, don't hesitate to contact me.
FREE

The “ Ticks Overcome Signal ” indicator, as outlined in your provided code, is a custom tool designed for use with MetaTrader 4 (MT4), a popular platform for Forex trading. This indicator seems to focus on tracking the momentum and direction of price movements by counting consecutive up and down ticks. Here’s an overview of the psychological aspects, logic benefits, and usage instructions for this indicator on MT4: Decision Support : Traders often face psychological challenges in decision-making
FREE

IX Power : Découvrez des insights de marché pour les indices, matières premières, cryptomonnaies et forex Vue d’ensemble
IX Power est un outil polyvalent conçu pour analyser la force des indices, matières premières, cryptomonnaies et symboles forex. Tandis que FX Power offre une précision maximale pour les paires de devises en utilisant toutes les données disponibles, IX Power se concentre exclusivement sur les données du symbole sous-jacent. Cela fait de IX Power un excellent choix pour les m

Si vous utilisez Inside Bar sur TradingView, où repérer les inside bars est facile et réconfortant, mais que vous ne le trouvez pas sur le marché MQL, votre recherche s'arrête ici. Pourquoi InsideBar Highlight ? Aussi simple que ABC : Inside bars simplifié. Notre outil se concentre sur le corps de la bougie, pour que vous puissiez voir ce qui compte sans aucun mal de tête. Votre style, votre choix : Coloré ou tout uniforme ? C'est vous qui décidez. Repérez les mouvements vers le haut ou vers le
FREE
Cette VWAP est une VWAP simple, mais nous avons intégré des notifications qui vous informent lorsque le prix atteint ou traverse la ligne de la VWAP. Cet indicateur est un indicateur VWAP traditionnel pour MetaTrader 4 (MT4). Les paramètres par défaut sont ceux de la VWAP normale, mais vous avez la possibilité de modifier le calcul de la VWAP et, mieux encore : Lorsque le prix touche ou traverse la VWAP, vous en serez informé par des alertes, des notifications sur votre téléphone portable, des e
FREE

Ce code a été publié à l'origine par LuxAlgo à partir d'un autre langage de programmation.
Il possède des capacités de prédiction de tendance acceptables qui peuvent être utilisées pour de nombreux objectifs de trading. Voici une description du générateur de code :
Cet indicateur s'appuie sur les lisseurs Nadaraya-Watson précédemment publiés. Ici, nous avons créé un indicateur d'enveloppe basé sur le lissage de noyau avec des alertes intégrées à partir des croisements entre le prix et les ex

Indicateur pour les options Binaires et Forex "Highway profits" est basé sur le principe de trouver le prix derrière les lignes de canal. Une fois que le prix sortira pour le canal et commencera progressivement à y revenir, c'est à ce moment-là que les signaux apparaîtront. Le commerce d'un tel indicateur est très facile et pratique. Et ils peuvent être échangés même par un commerçant novice ou un commerçant avec des années d'expérience.
Pour chaque actif, vous devez choisir vos paramètres. Pa
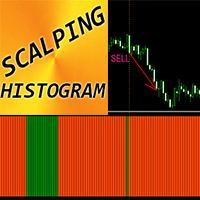
Indicateur Crypto_Forex "Scalping Histogram" pour MT4, pas de repeinture.
- L'indicateur Scalping Histogram peut être utilisé pour rechercher des signaux d'entrée dans la direction principale de la dynamique des prix après une correction mineure des prix. - L'histogramme Scalping peut être en 2 couleurs : orange pour la dynamique baissière et vert pour la dynamique haussière. - Une fois que vous voyez au moins 10 barres d'histogramme consécutives de la même couleur, cela signifie qu'une forte

Level Breakout Indicator est un produit d'analyse technique qui fonctionne à partir des limites supérieure et inférieure, ce qui peut déterminer la direction de la tendance. Fonctionne sur la bougie 0 sans redessin ni retard.
Dans son travail, il utilise un système de différents indicateurs dont les paramètres ont déjà été configurés et combinés en un seul paramètre - « Scale », qui effectue la gradation des périodes.
L'indicateur est facile à utiliser, ne nécessite aucun calcul, à l'aide d'un s

Indicator is converted from another programming language code by programmer " sbtnc ". MQL version is simplified to be more useful by less settings complexity. There is some clues from programmer about indicator: The indicator tracks and reports the percentage of occurrence of daily tops and bottoms by the time of the day. At certain times during the trading day, the market reverses and marks the high or low of the day. Tops and bottoms are vital when entering a trade, as they will decide if y
FREE

Introducing ISIS SCALPER for MetaTrader 4: Innovation Beyond the Traditional! Discover the future of trading strategies with our innovative indicator, carefully designed to transcend the limitations of conventional products. This is not just another indicator, but a flexible and powerful tool that empowers traders to explore the full potential of the market. Exceptional Features: Unlimited Versatility: Designed to adapt to any asset and time frame, our indicator allows you to create custom strat

TREND HARMONY MT4 – Multi Timeframe Trend and Phase and Pullback Level Visualizer indicator for Metatrader4 The TREND HARMONY indicator automates deep trend analysis and generates visualizations for you. Take control of your trades by eliminating uncertainty! Revolutionize your trading experience with precision and insight through the TREND HARMONY Multi Timeframe Trend Indicator – your ultimate MT4 trend visualization indicator. Are you tired of missing trading opportunities or consistently e
Всем добрый день, Это Вадим Сергеевич Лепехо. Выложил на общее обозрение очередной свой продукт(индикатор). Индикатор прост. В этом индикаторе я добавил формулу расчета точек входа. Сам индикатор я скачал в бесплатных индикаторах в mql mt4: arrows_template(шаблон стрелок). В свойствах, описании индикатора я указал имя автора. Суть индикатора рисует стрелки, знаки куда ходить, что делать и т.д...... Стратегия входа построена на пересечении двух 'машек' (MA) с разными периодами, объем, parabolic s

This automated AK Edge Scalping Indicator can be employed to oversee trades and identify optimal entry points for all time frames and both buying and selling when the price starts trending upwards or downwards. It is designed to recognize zones for Sell/Buy trades by utilizing the Moving Average and the MACD. Additionally, it incorporates the Average True Value to fine-tune the Stop Loss and the Take Profit. It can be effectively used in conjunction with other strategies to facilitate prompt en
FREE

With the Trend and News indicator you will always be up to date : News + Trends + Forecast
News Displayed on the chart as vertical lines with a description in the form of a tooltip The text displays two news: the previous published and the next expected
They have filters: by importance (High, Medium, Low) and time period (Day, 4 days, Week) Full table of news for a given period (T button)
Controlling the display of vertical lines on the chart and the sound signal before and after the publicati

Arrow signal indicator for scalping Has three sensitivity levels
Quickly detects changes in price direction and provides signals to open positions Equipped with built-in audio and visual alerts about trend changes. Can send notifications to a smartphone or email. Works on all timeframes, all currency pairs, metals, indices and cryptocurrencies. Can be used when working with binary options.
Distinctive features Does not redraw; Three sensitivity options; Three types of alerts; Simple and clea

Pivots Indicator Traders have been using this indicator for a long time, but the main difference or might better call it betterment applied to well known pivots indicator is that you can change how the pivot can be illustrated. There are two ways to get the pivots on the chart. you can use either number of candles or the movement of the market using points of retracement. you can find out more on the video. furthermore pivots lines can be drawn to see the possible support and resistance prices w

Всем добрый день, Это Вадим Сергеевич Лепехо. Выложил на общее обозрение очередной свой продукт(индикатор). Индикатор прост. В этом индикаторе я добавил формулу расчета точек входа. Сам индикатор я скачал в бесплатных индикаторах в mql mt4: arrows_template(шаблон стрелок). В свойствах, описании индикатора я указал имя автора. Суть индикатора рисует стрелки, знаки куда ходить, что делать и т.д...... Стратегия входа построена на пересечении двух 'машек' (MA) с разными периодами. Данный индикатор н
FREE

A powerful trend analysis tool for traders of all levels Super Trend Analyzer is a technical analysis tool that uses the Relative Strength Index (RSI) and Moving Average (MA) indicators to identify trends in the market. It is a versatile tool that can be used by traders of all levels of experience.
How does it work An uptrend begins when the main trend line and the auxiliary trend line cross from below and the lower minor oscillator is on the rise. A downtrend begins when the main trend line an
FREE

You've probably heard about the Dow trend Theory, where higher highs and lows indicate an uptrend, and lower highs and lows indicate a downtrend. This indicator determines this trend based on the Dow Theory. You just need to enter a number representing the number of candles between extremes. The optimal solution is the number 3, unless you want to have the trend from M5 but you're on M1, then you need to multiply this number by 5. Check various combinations to trade with the trend. In the scree
FREE
The Finding Average Volume indicator for MetaTrader 4 is a technical analysis tool that calculates the average volume of swing bars. Swing bars are a type of price chart pattern that identifies potential turning points in the market. The indicator is displayed as a zigzag trend line that is bounded by two vertical lines. The average volume is calculated for the entire swing bar pattern. Benefits of Using the Finding Average Volume Indicator Identify potential trend changes: The Finding Average
Всем добрый день, Это Вадим Сергеевич Лепехо. Выложил на общее обозрение очередной свой продукт(индикатор). Индикатор прост. В этом индикаторе я добавил формулу расчета точек входа. Сам индикатор я скачал в бесплатных индикаторах в mql mt4: arrows_template(шаблон стрелок). В свойствах, описании индикатора я указал имя автора. Суть индикатора рисует стрелки, знаки куда ходить, что делать и т.д...... Стратегия входа построена на пересечении двух 'машек' (MA) с разными периодами + обьемы. Данный ин
Всем добрый день, Это Вадим Сергеевич Лепехо. Выложил на общее обозрение очередной свой продукт(индикатор). Индикатор прост. В этом индикаторе я добавил формулу расчета точек входа. Сам индикатор я скачал в бесплатных индикаторах в mql mt4: arrows_template(шаблон стрелок). В свойствах, описании индикатора я указал имя автора. Суть индикатора рисует стрелки, знаки куда ходить, что делать и т.д...... Стратегия входа построена на пересечении двух 'машек' (MA) с разными периодами, объемы, parabolic

Всем добрый день, Это Вадим Сергеевич Лепехо. Выложил на общее обозрение очередной свой продукт(индикатор). Индикатор прост. В этом индикаторе я добавил формулу расчета точек входа. Сам индикатор я скачал в бесплатных индикаторах в mql mt4: arrows_template(шаблон стрелок). В свойствах, описании индикатора я указал имя автора. Суть индикатора рисует стрелки, знаки куда ходить, что делать и т.д...... Стратегия входа построена на пересечении двух 'машек' (MA) с разными периодами? объемы, parabolic

CycleView is an indicator that highlights possible phases of expansion and contraction in the different time frames, it helps to highlight the correct timing to make the entry. The cycle can be changed via external settings. After installing the indicator, you can contact me by message for the best settings and time frames to use.
The indicator works by analyzing the price action. When the indicator is downloaded, you need to move the EX4 file from "Market-Expert" to "Market-indicator".

up down stars indicator is no repaint indicator. it hold long way to signals. suitable all pairs and all timeframes. it needs at least 1000 bars on charts. 1 is critical level for signals. if red line reach 1 it gives red star to sell.. if blue line reach 1 it gives blue star to buy.. signals comes mostly exact time. sometimes lower timeframes it makes consecutive signals.

The Starting Points indicator for MetaTrader 4 is a technical analysis tool that shows the monthly, weekly, and daily starting points, as well as the 1000-point and 500-point levels, in the forex market. The indicator is displayed as a series of horizontal lines that represent the starting points and levels. Benefits of Using the Starting Points Indicator Identify potential trend changes: The Starting Points indicator can help traders identify potential trend changes by highlighting areas wher
FREE
Oscillators and Volatility: Oscillators like RSI and Stochastic are particularly useful in assessing the market sentiment and potential turning points in volatility. However, it's essential to use them in conjunction with other indicators and analyses for a comprehensive view. Divergences between price movements and oscillator readings can be powerful signals. For example, if a volatility index is making new highs, but the oscillator fails to confirm these highs, it may indicate weakening momen
FREE

This indicator allows you to overlay three different moving averages on the chart simultaneously. Each of these moving averages has additional settings such as: -Time frame
-Shift
-MA method
-Applied price
Using this indicator, you can easily set up three moving averages and find the one that suits you the best. You can also use this indicator to determine the trend when the moving averages cross.
FREE

This indicator filters the Zigzag indicator to calculate the main support and resistance
levels.
Variables
minimum gap between peaks : is the distance (GAP) between the peaks of
the Zigzag
peaks sensitivity : Minimum number of nearby peaks
look back: it means that it has to test the last 50 peaks in the Zigzag
object name perfix: a prefix for level’s line name on chart
FREE

FireArrow is an arrow signal based indicator that give buy and sell signals with tp and sl levels , the indicator gives buy/sell signals with alert on candle close along side tp and sl levels on chart for each signal
this indicator does not repaint/back-paint and signal is not delayed.
Strategy : Open buy same moment buy arrow appear and open sell same moment a sell arrow appear , set tp as drawn on chart along side sl.
Recommended Time frame : 15 and above
this arrow is good as ? : addon t

ADX MA: The Ultimate Trend Strength Guide
In forex trading, the Average Directional Index (ADX) is a vital indicator for gauging trend strength. Here's a streamlined approach to using ADX for effective trading:
1. Add ADX to your forex chart. 2. Interpret ADX values: <20 is weak, >40 is strong. 3. Identify trend direction: +DI above -DI indicates an upward trend, and vice versa. 4. Execute trades based on ADX and trend: Strong up trend, consider buying; strong down trend, consider selling; we

Overview Automated smart money market structure identification following smart money concept and inner circle trader concept, it gives an unprecedented edge on your smart money and market structure analysis by automatically identifies valid market structure using smart money concept: Identify impulsive and corrective moves Identify valid pullbacks built by impulsive and corrective market moves Idenitfy bearish or bullish leg and their inducements for smart money concept Identify valid market st

The Dot on Histogram Trend indicator is a straightforward tool in forex trading. When used in conjunction with other indicators, it can be highly rewarding.
The indicator consists of a blue and red histogram, representing positive and negative territories, respectively. Buy opportunities arise when the histogram is positive, while sell opportunities emerge when it's negative.
Signal Steps:
1. Dot at Zero Level: - Green Dot: Indicates a clear uptrend; take action. - Red Dot: Do nothing;

MR BEAST INDICATOR ATR SUPLIED AND DEMAND ¡Descubre la herramienta definitiva para la toma de decisiones financieras con nuestro asesor experto! Diseñado para operar en la vanguardia de los mercados globales, este asesor se destaca por su capacidad única para analizar tendencias en tiempo real utilizando el indicador Average True Range (ATR) y el equilibrio de oferta y demanda. Al aprovechar el ATR, nuestro asesor experto evalúa la volatilidad actual del mercado, proporcionándote una visión clar
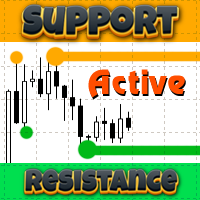
The Support Resistance Active indicator for MT4 identifies highs and lows across various timeframes, displaying support and resistance lines. Notably, previously tested highs and lows are eliminated to avoid clutter on the chart.
This indicator focuses on weekly and daily levels, termed as sell zones and buy zones. It draws support or resistance lines (fractal lines) for these zones. Tested areas are visually connected with a line, enhancing clarity on the chart.
The indicator is Multi-Timefr

Indicator ini berdasarkan Gain ADX - Follow Trend - Disertai Pivot, Support & Resistant Daily
Dengan indicator ini semoga menjadikan indicator yang porofit able, selama mengikuti signal yang tampil, apabila berwarna Hijau siap2 untuk Buy, dan berwarna Merah siap2 untuk Sell.
Akan tampil signal Sell/Buy di saat gain mencukupi, baik TF Kecil maupun TF Besar TF Besar / High TF adalah Trend Kuat TF Kecil / Low TF adalah Trend Lemah
Open Posisi pada High TF, signal akan menunjukkan Sell/Buy.
FREE

Indicator Statistics MultiPairs for MT4 1. Current Openning Ords - Symbols Openning + Buy Orders + Buy Volume + Sell Orders +Sell Volume - DrawDown by Symbols - Floating by Symbols 2. Closed Orders - Statistics by Today, Week, Month, YTD and Volume - Sum of Closed Orders by Symbol 3. Statistics by Day - Statistics by Say and Volume 4. DrawDown by Day - Each day DrawDown in Week - Percent of DrawDown Contact me at Telegram @MaiMew68
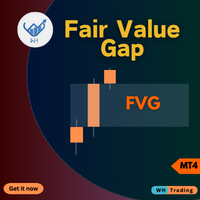
Faites l'expérience du trading comme jamais auparavant avec notre indicateur Fair Value Gap MT4 sans précédent (FVG)
salué comme le meilleur de sa catégorie. Cet indicateur de marché MQL5 sort de l'ordinaire,
offrant aux traders un niveau inégalé de précision et d’informations sur la dynamique du marché. EA Version: WH Fair Value Gap EA MT4
SMC Based Indicator: WH SMC Indicator MT4
Caractéristiques:
Analyse des écarts de juste valeur, la meilleure de sa catégorie. Personnalisation. Alerte
FREE

Ce produit reçoit des informations provenant d'outils d'indicateurs/signaux et affiche des flèches ou des notifications lorsque des conditions spécifiques sont remplies.
Par exemple, des flèches et des notifications s'affichent lorsque MA25 et MA50 se croisent, lorsque le SAR s'inverse, lorsque le MACD change son plus/moins ou lorsque le cours de clôture croise les bandes de Bollinger.
Veuillez vous référer à l'exemple d'image de paramètres pour des configurations spécifiques.
Pour les manue
FREE

L'indicateur de flèche pour le Forex et les options Binaires est créé sur la base des volumes de tiques. Contrairement à de nombreux indicateurs de volume, l'indicateur "Super volumes" calcule les volumes haussiers et baissiers et donne des signaux sur la prédominance de l'un d'eux. Si nous disons en ce moment dans cette gamme il y avait un avantage des volumes haussiers, alors le signal sera sur Buy. Ou si la prédominance était des volumes baissiers, le signal sera respectivement sur Sell.
Da
L'indicateur de flèche "Create a cool signal" pour le marché des options Binaires et Forex est une sorte de concepteur de leurs signaux! Dans lequel vous pouvez choisir vos conditions de signal sur la base des indicateurs MT4 standard 10-et prescrits dans CELUI-ci et plus un autre indicateur de tampon tiers que vous pouvez ajouter à la variable "buffer indicators".
C'est fait simplement! Enregistrez le nom de votre indicateur et enregistrez ses numéros (vous les trouverez dans la section des c
Indicateur pour le Forex et les options Binaires est écrit sur la base de 2 indicateurs standard dans MT4: ADX et RVI.
Les signaux sont reçus lors des intersections simultanées des lignes des deux indicateurs. Mais aussi dans les codes prescrits et les signaux d'inversion. C'est quand les signaux sont convertis en sens inverse. Vous pouvez également activer ou désactiver chacun des indicateurs. Et aussi dans RVI, vous pouvez utiliser 2 types de signaux: 1) Juste quand une ligne est au-dessus/a

Scalping and Binary Signal Detector - Indicateur de scalping qui donne des signaux directionnels pour l'ouverture de positions le long de la tendance.
L'indicateur est un système de trading complet qui peut être utilisé pour le Forex et les options binaires.
Le système d'algorithmes vous permet de reconnaître des mouvements de prix intenses sur plusieurs barres consécutives.
L'indicateur fournit plusieurs types d'alertes pour les flèches.
Fonctionne sur tous les instruments de trading et délais
L'indicateur de flèche pour les options Binaires et le Forex est un indicateur d'inversion. Créé et écrit sur la base de modèles d'inversion. Il est recommandé pour les options Binaires de le mettre sur le graphique M5. Entrez dans les transactions pour 1-3 bars. Sur un actif différent en fonction des séances de négociation, vous devez choisir votre temps d'expiration.
Dans les variables externes, vous pouvez modifier les paramètres. Ainsi, vous pouvez augmenter et diminuer la fréquence des s

L'indicateur de flèche "Anaconda LD" est un indicateur d'inversion pour le marché Forex et principalement pour les options binaires. L'algorithme est écrit sur la base de modèles d'inversion. Il est préférable de l'utiliser avec d'autres indicateurs pour filtrer les signaux. Même avec les indicateurs standard dans MT4, même avec d'autres indicateurs personnalisés. Les indicateurs de canal ou de niveau sont particulièrement appropriés...
Vous devez choisir le temps d'expiration pour différents

Comment trader avec un indicateur scalping : flèche bleue - acheter, flèche rouge - vendre. Tout est très simple. La stratégie fonctionne sur toutes les paires de devises. Délais recommandés : M5, M15, H1, H4. Aucun autre indicateur n'est nécessaire pour le trading. L'ensemble de la stratégie de trading repose exclusivement sur un seul indicateur de trading "Click Scalper". Il s'agit du dernier développement d'indicateurs de scalping pour Metatrader4. Placez simplement l'indicateur sur le graph

About testing Mode: 1.To get the best usage experience please use the tick data to test and adjust the test speed to proper speed (tick price jump quickly but K bars scroll slowly)!!! 2.Click "Indicator Properties"-> Click "Reset" before testing the indicator to restore the default parameters of the indicator.
1. Compound Drawings (1) Line segment with arrow (2) Continuous line segment (broken line) (3) Parallelogram (4) Polygon (5) Profit and loss ratio measurement tools
2. Backtracking

Multi Divergence Indicator for MT4 - User Guide Introduction Overview of the Multi Divergence Indicator and its capabilities in identifying divergences across multiple indicators.
Importance of divergence detection in enhancing trading strategies and decision-making.
List of Indicators RSI
CCI
MACD
STOCHASTIC
AWSOME
MFI
ACCELERATOR
OSMA
MOMENTUM
WPR( Williams %R)
RVI Indicator Features
Indicator Selection: How to enable/disable specific indicators (RSI, CCI, MACD, etc.) for divergence detectio
FREE
This automated VOLUME SCALPING INDICATOR can be utilized to manage trades and identify potential areas of support and resistance for both buying and selling. It is designed to identify zones for Sell/Buy trades based on the volume analysis and can be effectively used in conjunction with other indicators, such as order block indicators, and more. Currently designed for MT4, it will later be adapted to function on MT5. We also offer the opportunity to customize the robot according to your trading
FREE

Exclusive Arrival: Presenting for the First Time . This is your secret weapon for predicting which way the wind will blow with the next market shift. It assists you in developing your trading strategy by predicting the direction of the next candle. Compatible with forex, stocks, and cryptocurrencies on all timeframes, but higher timeframes are recommended. MT5 Version - https://www.mql5.com/en/market/product/108937/ How does it work ? It's pretty neat. The algorithm separates green and red can

Check my paid tools they work great and I share Ea's based on them for free please r ate
The Dual Timeframe RSI (Relative Strength Index) indicator is a novel trading tool that allows traders to monitor RSI readings from two different timeframes on a single chart. This dual perspective enables traders to identify potential trend confirmations and divergences more effectively. For instance, a trader might use a 1-hour RSI alongside a daily RSI to ensure that short-term trades align with the broa
FREE
Le MetaTrader Market est un magasin unique de robots de trading et d'indicateurs techniques.
Lisez le mémo de l'utilisateur de MQL5.community pour en savoir plus sur les services uniques que nous offrons aux traders : copie des signaux de trading, applications personnalisées développées par des freelancers, paiements automatiques via le système de paiement et le MQL5 Cloud Network.
Vous manquez des opportunités de trading :
- Applications de trading gratuites
- Plus de 8 000 signaux à copier
- Actualités économiques pour explorer les marchés financiers
Inscription
Se connecter
Si vous n'avez pas de compte, veuillez vous inscrire
Autorisez l'utilisation de cookies pour vous connecter au site Web MQL5.com.
Veuillez activer les paramètres nécessaires dans votre navigateur, sinon vous ne pourrez pas vous connecter.