Regardez les tutoriels vidéo de Market sur YouTube
Comment acheter un robot de trading ou un indicateur
Exécutez votre EA sur
hébergement virtuel
hébergement virtuel
Test un indicateur/robot de trading avant d'acheter
Vous voulez gagner de l'argent sur Market ?
Comment présenter un produit pour qu'il se vende bien
Nouveaux indicateurs techniques pour MetaTrader 4 - 14
A Fair Value Gap (FVG) in Forex trading is essentially the difference between the current market price of a currency pair and what it's believed to be worth based on economic factors or reversion to the mean idea in technical analysis. Market price deviates significantly from this estimated "fair value," it can signal potential trading opportunities. Several factors can cause an FVG to appear. It often arises from market sentiment, economic news, or geopolitical events that temporarily push a cu
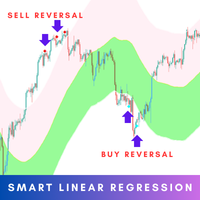
The Smart Linear Regression indicator is a powerful, non-repainting tool designed for traders looking for enhanced accuracy in market analysis. Unlike the typical linear regression channels that often repaint, this indicator provides reliable insights without changing past values, making it more trustworthy for forecasting future price movements. MT5 Version - https://www.mql5.com/en/market/product/124894/ Overview: The Smart Linear Regression Indicator goes beyond the basic linear regression c
"Easy Indicator" forex is a pointer indicator based on non-standard calculation principles. The optimal exit is marked with a yellow cross, it signals the optimal exit point in the current trend. An emergency exit is marked with a red dot, signaling a possible change in trend. The “Risk” section displays the current risk for a given transaction, which is calculated taking into account the features of the current chart.
SMC Probability - is an indicator designed to track the actions of institutional investors, commonly known as “smart money”. This tool calculates the probability that smart money will actively participate in buying or selling in the market, which is referred to as smart money order flow. The indicator measures the probability of three key events: Change of Character ( CHoCH ), Shift in Market Structure ( SMS ), and Break of Structure ( BMS ). These probabilities are displayed as percentages a

Description : In the world of trading, candlestick patterns are a popular technical analysis tool used by many traders. There are numerous candlestick patterns, ranging from reversal patterns to continuation patterns. However, remembering all these patterns can be challenging, especially for novice traders. This often leads to traders having to manually memorize and identify candlestick patterns, which can be time-consuming and prone to errors. Candle Pattern Pro is a powerful indicator design
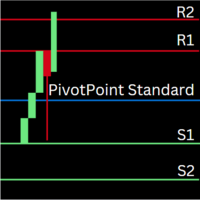
Pivot Point Indicator for MetaTrader 4 (MT4) Overview The Pivot Point Indicator calculates daily, weekly, and monthly pivot points and plots key support and resistance levels on your charts. This indicator helps traders identify potential reversal points and key areas of interest for price action, making it a valuable tool for both short-term and long-term trading strategies. Key Features Daily, Weekly, and Monthly Pivot Points : Easily switch between daily, weekly, and monthly pivot points by a
FREE
WayAlarmPoint is an indicator for the MetaTrader 4 platform, which provides various ways to notify about price movement in any direction. Its simple functionality allows you to select the desired sound for a given direction and set an individual distance in points for each side of the price movement. In addition, the indicator will accurately indicate the time when the goal is reached.
This indicator is ideal for those who want to go about their business without losing control of the market sit

WayAlarmPrice is an indicator for the MetaTrader 4\platform. It offers a variety of ways to notify you of price movements in any direction.
This easy-to-use indicator allows you to select the appropriate sound for each direction and set an individual distance to a specific price for each side of the road. In addition, it accurately determines the time to reach the goal.
To get started with the indicator, simply place it in the indicators folder of your MetaTrader 4 terminal, then move it to the

Indicator for manual trading. How to use: Open positions on STDV 1 or 2. Take Profit is the centerline. How it works: The trading strategy is based on the statistic, which shows that almost 70% of the price movement is within the STDV 1 and 95% between STDV 2 and 99% between STDV 3.
The price swings around the midline, and when it reaches STDV 1, it has a 70% chance of going back to the midline.

Order blocks are essential structures in trading that indicate areas where large institutional traders , like banks and hedge funds, have placed their orders. These blocks represent significant price levels where substantial buying or selling activity has occurred, providing clues about potential market movements. So, why should you, as a trader, care about order blocks? Well, knowing where these big orders are placed can give you a huge advantage. It’s like having a map showing where the treasu

Chart patterns are a common tool used by traders to identify potential trading opportunities in the financial markets. These patterns are formed by the price action of a security, and can provide valuable information about the direction in which the price is likely to move. Some of the most common chart patterns include head and shoulders, double tops and bottoms, triangles, and flags and pennants. By analyzing these patterns, traders can make informed decisions about when to enter or exit a tr

江恩理论 江恩理论是金融市场分析中的一种重要工具,它基于市场周期性和自然法则的假设,通过特定的技术分析工具来预测市场走势。江恩理论的主要内容包括: 市场周期 :江恩认为市场存在周期性波动,这些周期可以通过特定的时间周期和价格周期来识别。 价格和时间 :江恩理论强调价格和时间之间的相互作用,认为两者是市场分析的关键要素。 江恩角度线 :这是江恩理论中的一种重要技术分析工具,用于识别市场的支撑和阻力水平。 江恩轮中轮 :又称“江恩圆形图”,是江恩发明的另一种重要技术分析工具,用于预测市场的未来走势。 量化分析 :T3指标可能通过特定的数学模型或算法来量化市场的行为或特征。 趋势识别 :T3指标可能用于识别市场的趋势方向,包括上升趋势、下降趋势或横向整理。 交易信号 :基于T3指标的分析,投资者可能能够获得买入或卖出的交易信号。

Harmonic Price Patterns Harmonic price patterns identify the stages of a retracement so that when the pattern is complete, you have a clear buy or sell signal. Retracements are vexing at all times, and any help is always welcome, although, with harmonic price patterns, the orthodoxy is to apply Fibonacci numbers. Again, Fibonacci numbers are not a proven theory, and in fact, there is a great deal of evidence that Fibonacci numbers appear in securities prices, including Forex, only about the numb
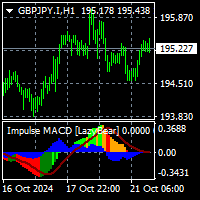
To get access to MT5 version please click here . This is the exact conversion from TradingView: " Impulse MACD" by LazyBear.
This is a light-load processing and non-repaint indicator. All input options are available except candle coloring option. Buffers are available for processing in EAs. You can message in private chat for further changes you need. Thanks for downloading

Le tableau de bord MT4 CCI Scanner vous aide à suivre les niveaux de l'indice des canaux de marchandises (CCI) sur différents délais et instruments, et fournit des alertes en temps réel lorsqu'un nouveau signal est détecté. Il est convivial et léger en termes de puissance de calcul, garantissant une performance fluide sur n'importe quel ordinateur. Caractéristiques clés : Regroupement automatique des instruments : Le scanner collecte tous les instruments de votre liste de surveillance du marché
FREE

Simple ATR Stop Loss : Votre boussole de volatilité du marché qui vous aide à naviguer dans les eaux traîtres du trading , en établissant des Stop Losses plus intelligents et en vous faisant ressembler à un ninja du trading (cape non incluse). Attention, tous les aficionados du trading et les experts du marché ! Voici l'indicateur Simple ATR Stop Loss – votre nouveau meilleur ami dans le monde sauvage du trading. Il est plus simple qu'un puzzle de deux pièces mais plus puissant
FREE

Crypto_Forex Indicator HTF Ichimoku pour MT4.
- L'indicateur Ichimoku est l'un des indicateurs de tendance les plus puissants. HTF signifie - Higher Time Frame. - Cet indicateur est excellent pour les traders de tendance ainsi que pour la combinaison avec les entrées Price Action. - L'indicateur HTF Ichimoku vous permet d'attacher Ichimoku d'une période plus élevée à votre graphique actuel. - Tendance à la hausse - ligne rouge au-dessus de la bleue (et les deux lignes sont au-dessus du nuage)
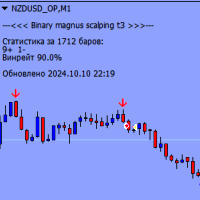
Binary Magnus Scalping T3 est un indicateur d'options binaires qui fonctionne sur n'importe quelle période et avec n'importe quelle paire de devises. Utilise l'analyse de cluster pour identifier les points d'entrée et émet une alerte sous la forme d'une fenêtre contextuelle et d'une flèche tampon sur le graphique rouge ou bleu avant la fermeture de la bougie actuelle.
Principales caractéristiques de l'indicateur :
Fonctionne sur n'importe quelle période (M1, M5, M15, M30, H1, H4, D1) Prend en

ATR Pyramid ️ : Votre ticket pour empiler des profits plus hauts qu'une tour de Jenga sous stéroïdes , transformant la volatilité du marché en une fête de surf sur les tendances ️ et d'ajout de positions , où seul le premier trade risque un wipeout , tandis que vous protégez le reste en faisant glisser votre stop loss vers le haut comme un ascenseur , créant une zone de confort qui est la seule vraie voie pour multiplier votre compte forex plus vite qu'un lapin sous espresso !!!
FREE

Alpha Trend sign est notre outil de Trading très populaire depuis longtemps, il valide notre système de Trading et invite clairement les signaux de Trading sans dérive.
Fonctions principales:
• En fonction de la zone active du marché, selon les indicateurs, il est intuitif de déterminer si le cours actuel appartient à la tendance ou à la tendance.
Et coupez le marché selon les flèches d'indication de l'indicateur, les flèches vertes suggèrent d'acheter et les flèches rouges suggèrent de vend

Scalper Inside Volume Pro is a professional trading system that combines multiple indicators to calculate an overall composite signal. It is based on an algorithm focused on volume, the Money Flow Index, and the Smart Money concept. The indicator takes into account structural Swing points where price reversals occur. Scalper Inside Volume Pro provides all the necessary tools for successful scalping. This comprehensive trading system is suitable for traders in the Forex market as well as for use

MTF (Multi-Timeframe) Countdown Timer indicator, designed for MetaTrader 4 (MT4). The indicator displays the remaining time for new candles across multiple timeframes, along with other essential trading information such as server time, local time, and the spread of custom currency pairs. Features: Multi-Timeframe Countdown : Displays the time remaining for the next candle in up to six configurable timeframes, such as M5, H1, or D1. Customizable Appearance : Background, border, and text colors ca
FREE

The indicator is designed to display key price ranges on the graph and analysis of market dynamics within the established limits. It uses the parameter Period = 1200 , which means the calculation of data based on 1200 candles or bars to form and display the range. This period is suitable for long -term trends and allows you to identify important levels of support and resistance.
The Alert = True function activates a sound or visual notice when reached the price of the boundaries of the range o
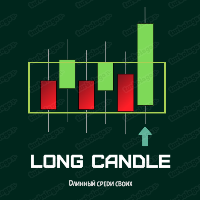
A LONG CANDLE SEARCH INDICATOR. This indicator will allow you to quickly find a candle that differs from others, namely its long one.
When the price moves out of the "flat" momentum, it indicates that the trend wants to change. So it's time to enter into a deal!
Keep in mind that not all arrows guarantee you an excellent entry point. Before opening a deal, make sure that the price has broken out of the flat. You can also resort to other indicators.
I'll show you good entry points in the scre
FREE
This non-repainting indicator, inspired by Larry Williams’ renowned "VIX Fix", replicates the power of the VIX (Volatility Index) but works across all asset classes—making it a versatile tool for traders. Originally designed for stock indices, this version adapts to any market, including forex, commodities, and crypto, providing valuable insights into potential market bottoms.
For more details, check out this pdf: https://www.ireallytrade.com/newsletters/VIXFix.pdf
Key Features: Based on the w
FREE

The Trend Bomer indicator can be used alone or as an addition to your strategy. Does not repaint and causes no delay. Customizable SL and TP setting. It provides alerts as well as signals and when an alert is received orders are placed after waiting for the candle to close. The red arrow indicates the sell signal and the blue arrow indicates the buy signal. It can be optimized for all currencies, commodities or cryptocurrencies. You can change and optimize the settings using the "indicatorPeriod

This indicator is based on the strategy shared by TheMas7er on his youtube channel.
The IDR/DR range will help you identify the high and low of the day once a candle closes above or below the the DR levels.
The IDR/DR range is determined 1 hour after session open, 09:30 am est.
I have incorporated the fibonacci tool to help you mark the retracement for a good entry in the premium or discount zone.
Important
This indicator is designed for the indices and M5 timeframe, but you are welcome to

The indicator is based on the calculation of liquidity on the market and thus shows where the market can most likely turn.. It shows the places of liquidity where the price will reach sooner or later... The indicator can be set to several types of liquidity and therefore can display several levels on the graph.. It is a unique tool that can help you very well in your trading The indicator is suitable for currency pairs with the most liquidity (Forex,Crypto...)
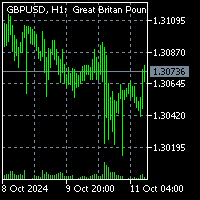
To get access to MT5 version please click here . This is the exact conversion from TradingView: "VolATR" by "barrettdenning" The screenshot shows similar results from tradingview and Metatrader when tested on ICMarkets on both platforms. This is a light-load processing. This is a non-repaint indicator. All input options are available. Buffers are available for processing in EAs. You can message in private chat for further changes you need.
Here is the source code of a sample EA operating base
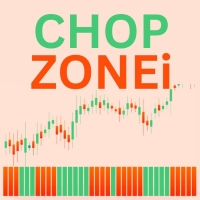
ChopZonei is a custom technical analysis indicator built to help traders identify trend strength and market conditions by calculating the angle of a chosen moving average (MA) over a specified period. The resulting angles are used to classify price action into various "chop zones," which are color-coded based on the direction and magnitude of the angle.
Key Features:
Multi-Timeframe Support: ChopZonei allows the user to calculate the indicator based on a higher timeframe (HTF) while avoiding

L'indicatore QuantumBlocks è uno strumento avanzato progettato per i trader che desiderano identificare con precisione zone di accumulazione o distribuzione nel mercato, comunemente note come "Order Blocks". Questi livelli rappresentano aree chiave dove istituzioni finanziarie o trader di grande volume piazzano i loro ordini, influenzando pesantemente il movimento dei prezzi. Funzionalità principali: Identificazione automatica dei blocchi di ordini rialzisti e ribassisti : L'indicatore scansion

Unveil Market Secrets with Sneaky Busters on MetaTrader 4! Delve deeper into the intricate world of trading with the Sneaky Busters indicator, specifically crafted to spotlight the sophisticated maneuvers of smart money and uncover hidden market trends. Comprehensive Features: 1. Smart Money Accumulation & Distribution Detection: Accurate Analysis: Identify key zones where smart money collects and disperses assets. These insights help you understand market sentiment and potential turning points.
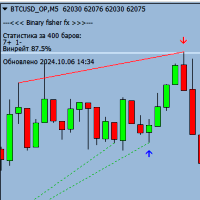
Binary Fisher FX est un puissant indicateur d'options binaires qui fonctionne sur n'importe quelle période et avec n'importe quelle paire de devises. Cet indicateur est conçu pour identifier les mouvements de tendance et indique les points d'entrée sous la forme d'une flèche avant la clôture de la bougie actuelle.
Principales caractéristiques de l'indicateur :
Fonctionne sur n'importe quelle période (M1, M5, M15, M30, H1, H4, D1) Prend en charge toutes les paires de devises Expiration de 1 à
FREE
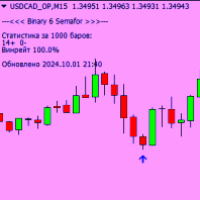
Binary 6 Semafor est un indicateur d'options binaires universel pour MetaTrader 4.
-Fonctionne sur n'importe quelle période et paire de devises
-Détection précise du point d'entrée
-Le signal apparaît sur le graphique avant la fermeture de la bougie actuelle
-Expiration 1 bougie
-Flèches tampon pour l'entrée
-Afficher les statistiques pour l'actif actuel
Résultats des tests :
L'indicateur a passé des tests avec des rendements impressionnants, démontrant son efficacité dans diverses con
Binary Super FX pour MetaTrader 4 est un puissant oscillateur pour le trading d'options binaires. Il peut être utilisé sur n’importe quelle période et n’importe quelle paire de devises.
L'indicateur Binary Super FX fournit des signaux d'entrée précis sous forme de flèches tampon avant la fermeture d'une bougie, avec une expiration de 1 bougie. Cela permet aux traders de prendre des décisions rapides et éclairées concernant l'entrée dans une transaction.
Il est important de noter qu’avant d’ac
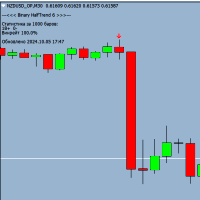
Binary HalfTrend 6 est un puissant indicateur de tendance conçu pour le trading d'options binaires, fournissant des signaux d'achat et de vente précis. La date d'expiration n'est que d'une bougie, vous pouvez échanger à tout moment. L'indicateur Binary HalfTrend 6 analyse les tendances du marché et génère des signaux fiables sous forme de flèches sur le graphique pour un trading rentable. Avant de l'utiliser dans le trading en direct, je recommande de le tester sur un compte démo pour sélection
FREE

MASTER MA est un indicateur basé sur le croisement des moyennes mobiles, utilisant 3 moyennes mobiles avec des périodes différentes pour générer des signaux, la stratégie est très simple, mais l’indicateur a un tableau de bord de statistiques qui montre des résultats de test de retour instantanés utiles tels que le taux de victoire/les bénéfices totaux gagnés... etc., cet indicateur a des entrées TP et SL en points afin que vous puissiez avoir votre TP et SL souhaités visibles sur le graphique
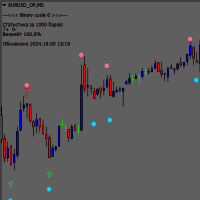
L'indicateur Binary Cucle 6 est un oscillateur puissant pour le trading d'options binaires sur la plateforme MetaTrader 4. Il est conçu pour fonctionner sur des délais à partir de M5 et peut également être utilisé sur n'importe quelle paire de devises.
L'indicateur Binary Cucle 6 fournit des signaux précis pour entrer dans une transaction sous la forme de flèches bleues et rouges qui apparaissent sur le graphique avant la fermeture de la bougie actuelle. Cela permet aux traders de prendre des

Le Support Resistance Whisperer est un outil puissant conçu pour aider les traders à identifier les niveaux de support et de résistance cruciaux sur le marché. Cet indicateur utilise l'action des prix pour dessiner de manière dynamique des lignes de résistance rouges et des lignes de support vertes sur votre graphique, offrant une représentation claire et visuelle des zones de prix clés où des inversions ou des ruptures potentielles du marché peuvent se produire. Contrairement aux méthodes t
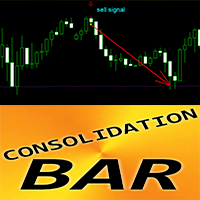
Modèle de barre de consolidation de l'indicateur Crypto_Forex pour MT4.
- L'indicateur "Consolidation Bar" est un indicateur très puissant axé sur la cassure pour le trading Price Action. - L'indicateur détecte la consolidation des prix dans une zone étroite pendant 1 barre et affiche : la direction de la cassure, l'emplacement de l'ordre en attente et l'emplacement du SL. - Barre de consolidation haussière - Signal de flèche bleue sur le graphique (voir les images). - Barre de consolidation b

Indicateur de tendance Fxcycle - Trading de précision pour des profits constants
Version : 1.00 Copyright : Fxcycle
L'indicateur de tendance Fxcycle est un puissant outil de suivi de tendance conçu pour aider les traders à identifier facilement la direction du marché. Conçu pour les traders de tous niveaux, cet indicateur fournit des signaux d'achat et de vente précis basés sur une analyse avancée des tendances, ce qui en fait l'outil idéal pour tous ceux qui cherchent à maximiser leurs profi

### **Indicateur WaveSignal ForexCycle**
L'indicateur **FxCycle WaveSignal Indicator** est la solution parfaite pour les traders qui cherchent à identifier des opportunités de trading fortes et précises en utilisant une approche **modèle de vague** combinée à des **moyennes mobiles exponentielles (EMA)**. L'indicateur est conçu pour fournir des signaux clairs **Achat** et **Vente** basés sur le mouvement du prix autour de la **ligne de vague supérieure** et **ligne de vague inférieure**, ainsi

The Area of Interest (AOI) Indicator is a powerful tool designed to help traders identify key market zones where price reactions are highly probable. This indicator specifically highlights two critical zones: Seller AOI (Area of Interest) : This zone represents areas where sellers are likely to enter the market, often acting as resistance. When the price approaches or touches this zone, it signals that a potential sell-off could occur. Buyer A OI (Area of Interest) : The BOI zone identifies re
FREE

Trading System Double Trend est un système commercial indépendant composé de plusieurs indicateurs. Détermine la direction de la tendance générale et donne des signaux dans la direction du mouvement des prix.
Peut être utilisé pour le scalping, le trading intrajournalier ou intrasemaine.
Possibilités
Fonctionne sur toutes les périodes et instruments de trading (Forex, crypto-monnaies, métaux, actions, indices.) Lecture visuelle simple des informations sans charger de graphique L'indicateur ne

Advanced Reversal Hunter Pro (ARH) is a powerful, innovative volatility-based momentum indicator designed to accurately identify key trend reversals. Developed using a special algorithm that provides a clear construction of the average volatility range, without redrawing its values and does not change them. The indicator adapts to any market volatility and dynamically adjusts the width of the band range, depending on current market conditions. Indicator advantages: Advanced Reversal Hunter Pro

Introducing Order Blocks Breaker , a brand-new way to identify and leverage order blocks in your trading strategy. After developing multiple order block tools with unique concepts, I’m proud to present this tool that takes things to the next level. Unlike previous tools, Order Blocks Breaker not only identifies order blocks but also highlights Breaker Order Blocks —key areas where the price is likely to retest after a breakout. MT5 - https://www.mql5.com/en/market/product/124102/ This tool inco
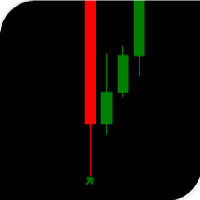
The arrow indicator without redrawing shows potential entry points into the market in the form of arrows of the appropriate color: the up arrows (usually green) suggest opening a purchase, the red down arrows suggest selling. The appearance of arrows may be accompanied by beeps. It is usually assumed to enter at the next bar after the pointer, but there may be non-standard recommendations. Arrow indicators visually "unload" the price chart and save time for analysis: no signal – no deal, if ther

Have you ever wondered why most systems are not effective in live trading? My answer is that it's all the fault of the so-called "Smart Money" or the institutional ones,, they constantly create spikes first up then down and vice versa to screw all the retail investors by tearing away their capital, confusing them and making the markets move randomly without any rules. But in all this there is a famous strategy, which in 2009 won the world championship, exploiting and rowing against the instituti
About:
Looks for price making a trend flip pattern. Importance of this pattern is that after it happens, price tends to range a bit and then breakout right after.
Features:
Looks for trend flip pattern Num of bars creating pattern Extend lines to right to wait for breakout Bull/Bear Strength for candles making the pattern Filter using Halftrend/NRTR
How it Works:
Use this technique for scalping. After a pattern happens, you will see a red/green rectangle. Red means a Bearish pattern and green

THE PRICE ACTION INDICATOR! This program finds candlestick absorption patterns and a false breakdown, after which it draws the entry points with arrows.
Input parameters:
1. PPR_Arrow The On parameter/Off display of the absorption model arrows. By default, it is set to true.
2. FB_Arrow Everything is the same as the first parameter, only for false breakdown models. By default, it is set to true.
Sincerely, Novak Production.
FREE
the indicator presents three supertrends that identify a possible trend for the day and places possible entry flags when they are aligned, audible and visual alarms available, usable on all timeframes, ability to customize trends, colors, and time filter.
each asset needs its own specific supertrends, indicator has standard trends that can be used on M5

Indicator description: The Ratel Strength indicator is mainly used to determine the strength of long and short trends and give reference signals for buying and selling points. It is suitable for gold, foreign exchange, digital currencies, etc. Indicator parameters: Proid:14 B/S signal reversal deviation value: 1.00
Display B/S signal: TRUE Up trend signal color: clrLightSeaGreen Down trend signal color: clrRed Indicator usage:
Above the 0 axis of the column, long position are relatively strong
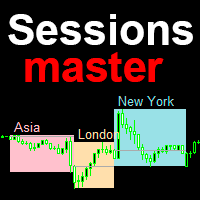
Session master - индикатор торговых сессий с расширенными возможностями. По умолчанию отображает Азиатскую, Лондонскую и Нью Йоркскую сессии, с возможностью самостоятельно настроить каждую сессию индикатора под свою торговлю. Описание Отображает прямоугольной областью заданный период в часах дня Максимум и минимум сессии соответствуют максимам и минимумам прямоугольных областей сессий Индивидуальная настройка для каждой сессии, имя, цвет, период в часах Автоматически переводит время сессий зада

Detailed post explained:
https://www.mql5.com/en/blogs/post/759269
This is a slope indicator for Bollinger Bands indicator. It provides slopes for BB top band, center band (main) and Lower Band. You can also set a threshold value for Center line to control Red/Green slope histogram lines. Settings:
You can choose which line you need the slope and Threshold Alerts for in Drop down.
Slope Thresholds: for Alerts. Please note that Alerts only happen when Threshold is crossed. e.g.: If Threshold
FREE

TitanVision indicator is a versatile technical analysis tool that helps traders identify market trends and potential entry and exit points. It features a dynamic Trend Catcher Strategy, adapting to market conditions for a clear visual representation of trend direction and various trend reversal points. Traders can customize the parameters according to their preferences. The indicator helps in identifying trends, signals possible reversals, acts as a trailing stop mechanism and provides real-tim
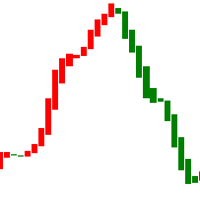
This is an indicator that tracks price trends and can alert traders when the market exhibits abnormalities. The indicator chart is marked with red and green colors. The background color of the chart is white and cannot be modified to other background colors. When the indicator color changes from red to green, it means that the market price has paused or even reversed. This is a reminder to traders of the possibility of short orders. When the indicator color changes from green to red, it means t
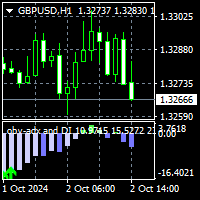
To get access to MT5 version please click here . This is the exact conversion from TradingView: "OBV ADX and DI" by " kocurekc ". This is a light-load processing and non-repaint indicator. All input options are available. Buffers are available for processing in EAs. You can message in private chat for further changes you need. I removed the background coloring option to best fit into MT platform graphics.
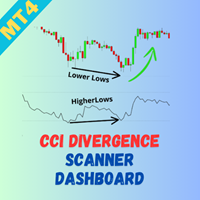
Welcome to the CCI Divergence Multicurrency Scanner Dashboard , an advanced tool designed to help traders efficiently detect CCI (Commodity Channel Index) divergence patterns across multiple currency pairs. This scanner enables quick identification of potential reversal opportunities, giving you a significant edge in your trading strategy. Key Features: Effortless Multicurrency Scanning Monitor multiple currency pairs in real-time and receive instant alerts when significant CCI divergence patter

Bank Levels Institutional MT4 Indicator Overview The Bank Levels Institutional MT4 Indicator is a powerful trading tool designed to enhance your trading strategy by identifying key bank levels in the financial markets. This indicator helps traders to visualize significant price levels that institutional players are likely to monitor, providing valuable insights for making informed trading decisions. Key Features Dynamic Bank Levels : Automatically plots critical bank levels based on historical p

Want to create an Expert Advisor (EA) using an indicator that doesn’t store the required data in a buffer (visible in the Data Window) and only draws objects on the chart? This solution captures chart objects and places them into buffers, allowing you to create an EA—whether you're using EA Builder Pro or writing code with iCustom—by selecting the correct values using those buffers (modes). It works with any object visible in the Object List that has a unique Name or Description, such as: Trend
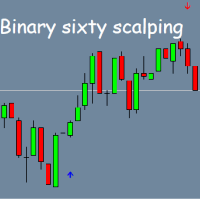
Binary Sixty Scalping – Indicateur pour options binaires sur MT4 Binary Sixty Scalping est un indicateur pour la plateforme MT4, conçu spécifiquement pour le trading d'options binaires. Il fonctionne sur toutes les unités de temps, mais pour plus de précision, il est recommandé d'utiliser M5 ou plus. Cet indicateur est compatible avec toutes les paires de devises, ce qui le rend adaptable à divers marchés. Caractéristiques principales : Expiration par défaut – 1 bougie , modifiable dans les par
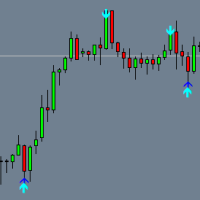
Binary DUNKS est un outil conçu pour le trading d'options binaires, optimisé pour des unités de temps de M5 et plus . Cet indicateur fonctionne avec toutes les paires de devises et aide à identifier des points d'entrée potentiels sur le marché. Caractéristiques Principales Expiration :
Paramètre par défaut de 1 bougie , ajustable dans les paramètres de l'indicateur. Signaux :
L'indicateur génère des flèches : Flèche rouge — Signal de vente. Flèche bleue — Signal d'achat.
Les signaux sont
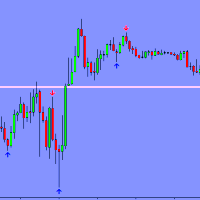
Le cratère binaire est un indicateur puissant et polyvalent pour MetaTrader 4, conçu spécifiquement pour le trading d'options binaires. Il fonctionne efficacement sur n'importe quelle période et avec n'importe quelle paire de devises, ce qui en fait un outil extrêmement flexible pour les traders.
Principales caractéristiques :
Analyse des tendances : l'indicateur détermine automatiquement la tendance actuelle du marché, ce qui aide les traders à effectuer des transactions dans le sens de la t

The Fast flat indicator can recognize and notify you of short flats after the price rises or falls. Where the price can rush further or reverse. ++ The indicator is open to arbitrary flat settings. You will probably have to conduct quite a few tests, approaching the best results. I will be very grateful if you share in the comments your tests, parameters and advice to other users, who may also be able to improve your results. Should I use it for entry signals, order stops, hedging...? - The indi
Attention, for the indicator to work correctly, you need to put the "MQL5" folder in your terminal folder, you can download it from the link below: https://disk.yandex.ru/d/DPyo0ntaevi_2A
Binary Scalper 7 is a powerful tool designed to identify and predict the next candle, allowing traders to make informed decisions when trading binary options. This indicator works on any time frame and with any expiration, making it a versatile and reliable tool for traders of all levels.
How it works:
The

Trend Oscillator - est un indicateur Crypto_Forex personnalisé avancé, un outil de trading efficace !
- Une nouvelle méthode de calcul avancée est utilisée - 20 options pour le paramètre « Prix pour le calcul ». - L'oscillateur le plus fluide jamais développé. - Couleur verte pour les tendances à la hausse, couleur rouge pour les tendances à la baisse. - Valeurs de survente : inférieures à 5, Valeurs de surachat : supérieures à 95. - Il existe de nombreuses possibilités de mettre à niveau même

L'indicateur Gann Box est un outil puissant et polyvalent conçu pour aider les traders à identifier et exploiter les niveaux clés du marché. Cet indicateur permet de dessiner un rectangle sur le graphique, qui est automatiquement divisé en plusieurs zones avec des niveaux stratégiques 0, 0.25, 0.50, 075, 1 . Lorsque le prix touche un de ces niveaux, des alertes se déclenchent, offrant ainsi une aide précieuse pour les décisions de trading. Vous savez instantanément l'évolution du marché par ra

Indicateur Forex Scalper – Votre Outil de Précision pour Gagner sur les Marchés Financiers
L'Indicateur Forex Scalper pour MT4 est l'allié parfait pour tous les traders souhaitant scalper les marchés avec une précision maximale. Grâce à son analyse basée sur des données précises, cet indicateur vous offre des signaux opportuns et précis, idéaux pour prendre des décisions rapides dans vos trades.
Précision Sur Mesure Chaque flèche affichée sur les graphiques est basée sur des calculs méticuleux

Découvrez des opportunités de trading avancées sur le marché NASDAQ 100 avec l’indicateur intelligent NASDAQ L’indicateur intelligent NASDAQ est l’un des outils puissants et efficaces pour trader sur le marché NASDAQ 100. Conçu spécialement pour les intervalles de temps de 1 minute et 5 minutes, cet indicateur fonctionne avec une grande précision et expertise. Vous pouvez facilement l’activer et profiter de ses avantages. Caractéristiques principales : Performance optimale sur des intervalles de

The Bullish and Bearish Engulfing Pattern Screener for MetaTrader 4 is a powerful tool designed for traders looking to identify key reversal patterns in the financial markets. This indicator scans price charts for bullish and bearish engulfing patterns, which signal potential trend reversals. Key Features: Real-time Scanning : Continuously analyzes price data to provide instant alerts when engulfing patterns are detected. Customizable Settings : Allows users to adjust parameters to fit their tra
FREE
Le MetaTrader Market offre un lieu pratique et sécurisé pour acheter des applications pour la plateforme MetaTrader. Téléchargez des versions démo gratuites de Expert Advisors et des indicateurs directement depuis votre terminal pour les tester dans le testeur de stratégie.
Testez les applications dans différents modes pour surveiller les performances et effectuez un paiement pour le produit que vous souhaitez en utilisant le système de paiement MQL5.community.
Vous manquez des opportunités de trading :
- Applications de trading gratuites
- Plus de 8 000 signaux à copier
- Actualités économiques pour explorer les marchés financiers
Inscription
Se connecter
Si vous n'avez pas de compte, veuillez vous inscrire
Autorisez l'utilisation de cookies pour vous connecter au site Web MQL5.com.
Veuillez activer les paramètres nécessaires dans votre navigateur, sinon vous ne pourrez pas vous connecter.