Regardez les tutoriels vidéo de Market sur YouTube
Comment acheter un robot de trading ou un indicateur
Exécutez votre EA sur
hébergement virtuel
hébergement virtuel
Test un indicateur/robot de trading avant d'acheter
Vous voulez gagner de l'argent sur Market ?
Comment présenter un produit pour qu'il se vende bien
Nouveaux indicateurs techniques pour MetaTrader 4

4.8(25 reviews) Rating on gogojungle
【 TrendLinePro2 】 Indicateur d'aide au trading de ligne MT4 (MetaTrader 4). Il s'agit d'une spécification très basique qui est recommandée à tout le monde, en supposant qu'elle soit fidèle à la théorie de Dow. Il reconnaît les tendances basées sur la théorie de Dow et trace en outre automatiquement des lignes de support, de résistance et de tendance en temps réel. La précision est très élevée.
【 Vérification du comportement 】 Sur Youtube, une vid

Reversal Zones Pro is an indicator specifically designed to accurately identify key trend reversal zones. It calculates the average true range of price movement from the lower to upper boundaries and visually displays potential zones directly on the chart, helping traders effectively identify important trend reversal points.
Key Features:
Reversal Zone Identification: The indicator visually displays potential reversal zones directly on the chart. This helps traders effectively identify impo
L'outil ultime pour affiner les moyennes mobiles Cet outil avancé est conçu pour simplifier et optimiser votre configuration de moyenne mobile. Avec MA Tuner, vous pouvez ajuster facilement les paramètres clés (Période, Décalage, Méthode et Prix) via un panneau convivial et accéder instantanément à des statistiques détaillées sur la fréquence à laquelle les bougies croisent la ligne de la MA, ainsi que leurs positions d'ouverture et de clôture par rapport à celle-ci. Pourquoi est-il meilleur que
FREE
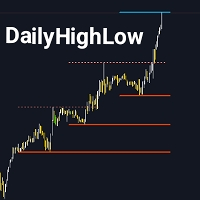
L'indicateur DailyHighLow pour MetaTrader 4 (MT4) est un outil sophistiqué pour suivre les mouvements de prix quotidiens. Conçu pour les traders ayant besoin d'informations claires et exploitables sur les plus hauts et les plus bas du marché, cet indicateur trace automatiquement des lignes de tendance basées sur les prix les plus élevés et les plus bas sur une période personnalisable. Principales Caractéristiques : Personnalisation des Lignes de Tendance : Définissez les couleurs, les styles de
FREE

Smart Fibo Zones are powerful, auto-generated Fibonacci Retracements that are anchored to key market structure shifts . These zones serve as critical Supply and Demand levels, guiding you to identify potential price reactions and confirm market direction. Fibonacci calculations, widely used by professional traders, can be complex when it comes to identifying highs and lows. However, Smart Fibo Zones simplify this process by automatically highlighting order blocks and key zones, complete with St
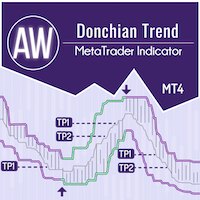
AW Donchian Trend est un indicateur de tendance basé sur le canal Donchian. L'indicateur peut calculer les niveaux TakeProfit et StopLoss, dispose de statistiques avancées sur le succès des signaux, ainsi que de trois types de notifications sur le signal reçu. Guide d'installation et instructions - Ici / Version MT5 - Ici Comment trader avec l'indicateur : Trader avec AW Donchian Trend ne nécessite que trois étapes simples : Étape 1 – Ouverture d’une position Un signal d'achat est reçu

Volume Break Oscillator est un indicateur qui fait correspondre le mouvement des prix aux tendances des volumes sous la forme d'un oscillateur.
Je souhaitais intégrer l'analyse des volumes dans mes stratégies mais j'ai toujours été déçu par la plupart des indicateurs de volume, tels que l'OBV, le Money Flow Index, l'A/D mais aussi le Volume Weighted Macd et bien d'autres. J'ai donc écrit cet indicateur pour moi-même, je suis satisfait de son utilité, et j'ai donc décidé de le publier sur le m
Qu'est-ce que "Real Time MultiIndicator"? "Real Time MultiIndicator" est un outil de trading avancé conçu pour simplifier et optimiser votre analyse technique. Cet indicateur révolutionnaire recueille des signaux provenant de plusieurs timeframes et indicateurs techniques, les affichant dans un tableau unique, clair et facile à lire. Si vous souhaitez une vision complète et détaillée du marché sans avoir à changer constamment de graphique ou à analyser manuellement chaque indicateur, "Real Time
REMIS DE 77,90 USD À 37,90 USD VALABLE JUSQU'AU DIMANCHE 1ER SEPTEMBRE Qu'est-ce que "Forex Scanner"? "Forex Scanner" est un outil de trading puissant conçu pour vous fournir une vue d'ensemble complète du marché des changes en temps réel. Cet indicateur avancé recueille des données clés à partir de multiples indicateurs techniques et horizons temporels, vous permettant d'identifier rapidement les opportunités de trading. Si vous souhaitez surveiller de nombreux actifs et paramètres sans avoir à
RSI Amélioré : Un Indicateur Hybride pour une Analyse Technique Plus Approfondie Le RSI Amélioré est un indicateur technique polyvalent et personnalisable, conçu pour fournir aux traders une analyse du marché plus complète et précise. En combinant les meilleures caractéristiques des moyennes mobiles, du RSI et du MACD, cet indicateur offre une vision multidimensionnelle du momentum et de la force d'une tendance. Caractéristiques Principales : Hybridation Parfaite : Le RSI Amélioré fusionne les c
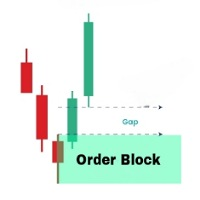
L'OrderBlock Analyzer est un indicateur personnalisé pour MetaTrader 4 (MT4) conçu pour détecter et mettre en évidence automatiquement les Order Blocks sur les graphiques de prix. Cet outil est idéal pour les traders qui utilisent les Order Blocks dans leur stratégie de trading, offrant une visualisation claire et précise de ces zones cruciales. Fonctionnalités principales : Détection des Order Blocks : Identifie automatiquement les Order Blocks haussiers et baissiers basés sur les configuration
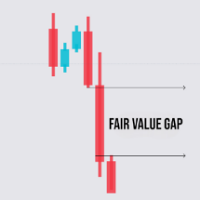
Le FVG Analyzer est un indicateur personnalisé pour MetaTrader 4, conçu pour détecter et mettre en évidence les Fair Value Gaps (FVG) sur les graphiques de prix. Cet outil permet aux traders d'identifier facilement les zones où des lacunes de valeur ont été créées, offrant ainsi des opportunités potentielles pour des stratégies de trading basées sur ces gaps. Fonctionnalités : Détection des FVG : FVG Haussier : Identifie les gaps haussiers lorsque le plus haut de la bougie suivante est inférieur
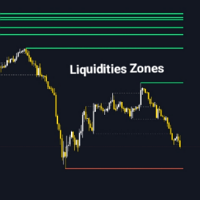
Le Liquidity Zone Detector est un indicateur technique avancé conçu pour identifier et tracer les zones de liquidité clés sur le marché en se basant sur l'indicateur ZigZag. Cet outil met en évidence les niveaux de prix où des liquidités importantes sont susceptibles d'être présentes, en dessinant des lignes de tendance sur les points hauts et bas capturés par le ZigZag. Le Liquidity Zone Detector aide les traders à repérer les zones potentielles de retournement ou de continuation des tendances
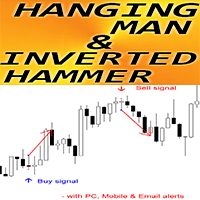
Forex Indicator " Hanging Man and Inverted Hammer pattern" for MT4 Indicator " Hanging Man and Inverted Hammer pattern " is very powerful indicator for Price Action trading : No repaint, No delays; Indicator detects bullish Inverted Hammer and bearish Hanging Man patterns on chart: Bullish Inverted Hammer - Blue arrow signal on chart (see pictures) Bearish Hanging Man - Red arrow signal on chart (see pictures) P C, Mobile & Email alerts are included Indicator " Hanging Man
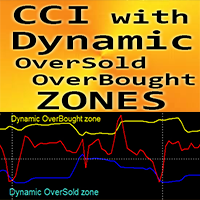
Forex Indicator " CCI with Dynamic OverSold/OverBought zones " for MT4. C ommodity Channel Index (CCI) is excellent for Momentum trading into the trend direction. It is great to take Sell entries from dynamic OverBought zone and Buy entries from dynamic OverSold zone into the direction of main trend T his indicator is excellent to combine with Price Action entries as well . D ynamic OverBought zone - above yellow line
Dynamic OverSold zone - below blue line
CCI oscill
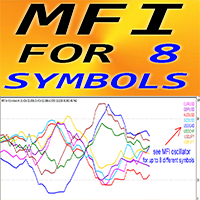
Forex Indicator "MFI for 8 Symbols" for MT4. M oney Flow Index (MFI) is a technical oscillator which uses price and volume data for identifying oversold and o verbought zones It is great to take Sell entries from Overbought when the MFI is above 80 and Buy entries from Oversold when it is below 2 0 MFI is very useful for divergence detection and it is great to combine with Price Action as well "MFI for 8 Symbols" gives opportunity to control MF I values of up to 8 diff
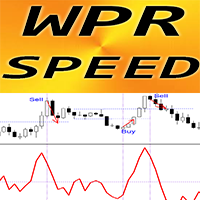
Forex Indicator "WPR SPEED" for MT4 - great predictive tool! The calculation of this indicator is based on equations from physics . WPR SPEED is the 1st derivative of WPR oscillator itself WPR SPEED is good for scalping entries on sideways and flat markets WPR SPEED indicator shows how fast WPR itself changes its direction - it is very sensitive It is recommended to use WPR SPEED indicator for momentum scalping trading strategies: find big size peaks of indicator - open scalping t
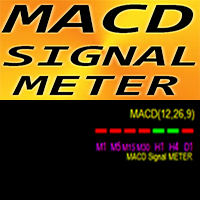
Forex Indicator MACD Signal METER for MT4 Very useful MACD Signal METER indicator is showing current MACD value (above/below Signal) for 7 time frames simultaneously Green box - MACD is above Signal Red box - MACD is below Signal Forex Indicator MACD Signal METER can be used as trade entry filter for Multi Time Frame trading
// More great Expert Advisors and Indicators are available here: https://www.mql5.com/en/users/def1380/seller It is original product which is offered only on t
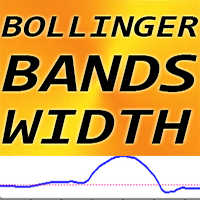
Forex Indicator Bollinger Bands Width for MT4, No Repaint. -BB Width indicator is applicable for using together with standard Bollinger Bands indicator. -This software is must have for every Bollinger Bands indicator fan, because their combination is very efficient to trade Breakouts -BB Width indicator shows the distance (span) between Bollinger Bands. HOW TO USE BB Width (See the example on the picture): 1) Find the lowest value of BB Width of the last 6 months and add 25% to this value
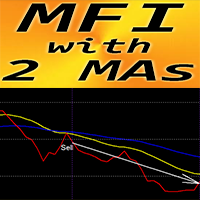
Forex Indicator "MFI and 2 Moving Averages" for MT4 M oney Flow Index (MFI) is a technical oscillator which uses price and volume data for identifying oversold and o verbought zones " MFI and 2 Moving Averages" Indicator allows you to see Fast and Slow Moving Averages of MFI oscillator Indicator gives opportunities to see the trend change very early It is very easy to set up this indicator via parameters, it can be used on any time-frame You can see Buy and Sell entry cond
Triple SD Osc (Triple synthetic digital oscillator) is a tool that allows you to combine into one whole the readings of three popular indicators simultaneously for a comprehensive analysis of price behavior. The user can select three different oscillators from the list of classic oscillators built into the MT4 trading platform and configure each of them separately. The indicator combines the values of user-selected oscillators and builds a synthetic oscillator based on them. To cut off false s
The Period Breakout Indicator is a versatile tool designed for traders seeking to identify breakout opportunities based on customizable time periods. This indicator automatically determines the highest and lowest prices within a user-defined period, allowing you to tailor it precisely to your trading strategy. Key Features: Customizable Time Periods: Define the start and end times based on your preferred trading hours or any specific period. The indicator will then calculate the highest and low
FREE
A Full Concept of BUY/SELL Scalping Strategy Trend detection is one of the basic challenges of every trader. Finding a way to tell when to enter a trade is very important, timing is a game changer, not too early and not too late. Sometimes, due to not knowing the market conditions, the trader closes his positions with a small profit or allows the losses to grow, these are the mistakes that novice traders make. Indicator Trend Whipper is a complete trading strategy and can improve the trader's tr

!!!Version free ne fonctionne que sur "EURUSD"!!! WaPreviousCandleLevelsMT4 affiche les niveaux de bougies précédents, il affiche les niveaux d'ouverture (Open), du prix le plus haut (High), du prix le plus bas (Low) et du prix de clôture (Close) de la bougie précédente sur différentes périodes. Ces niveaux sont souvent appelés OHLC. Il est conçu pour aider le trader à analyser le marché et à faire attention aux niveaux OHLC de la bougie précédente sur différentes unités de temps. Nous savons
FREE
Author's implementation of the classic technical analysis indicator Heiken Ashi. This indicator makes it easier to identify a trend and is the basis of many strategies. At its core, the Heiken Ashi (HA) indicator is just a way to construct a price candlestick chart. In the classic version of the indicator, the opening point of the HA candle is the average value between the opening and closing prices of the previous HA candle, and the closing point of the HA candle is the average value between th

Divergence Divergence refers to when the price of a currency pair moves in one direction while the trend indicator is moving in the opposite direction. With divergence, there can be positive and negative signals. Divergences in Forex trading are quite common signals of technical analysis. These are basic early Forex signals indicating the trend reversal and filter false signals. Application of this indicator It is usually not easy to detect divergences by the trader and it may be time-consuming

he "Super Trampoline" is an innovative trading indicator designed to simplify decision-making in financial markets. It analyzes chart data and provides clear and timely signals on when to buy or sell an asset, based on a proven strategy of candlestick pattern analysis. Product Advantages: Intuitive Interface : "Super Trampoline" integrates directly into your trading terminal, displaying signals as simple arrows on the chart. This means you don't need deep technical analysis knowledge to start us

Introducing "Super Transplant with Filter" — a game-changing tool for traders who value precision, reliability, and simplicity. This indicator combines advanced trend analysis techniques with intelligent signal filtering, allowing you to make decisions based on the most relevant data. Benefits of "Super Transplant with Filter": Accuracy in Every Trade : The indicator meticulously analyzes market data, identifying key trends while filtering out false signals. This enables you to make more informe
MACD Indicator The Moving Average Convergence and Divergence (MACD) is a trend following momentum indicator which shows the relationship between two moving averages that we chose and configure them on the indicator. The MACD is calculated by subtracting the 26-period exponential moving average and the 12 period D.A.M. These are the default parameters when you put the MACD indicator on the charts, and the period is usually 9 which means the last 9 candles. DT-Oscillator This is Robert C. Miner's

WaPreviousCandleLevelsMT4 affiche les niveaux de bougies précédents, il affiche les niveaux d'ouverture (Open), du prix le plus haut (High), du prix le plus bas (Low) et du prix de clôture (Close) de la bougie précédente sur différentes périodes. Ces niveaux sont souvent appelés OHLC. Il est conçu pour aider le trader à analyser le marché et à faire attention aux niveaux OHLC de la bougie précédente sur différentes unités de temps. Nous savons tous que les niveaux OHLC mensuels (MN), hebdomad
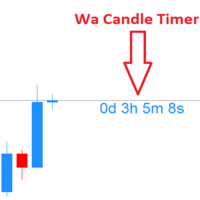
Wa Candle Timer MT4 est un indicateur qui montre à l'utilisateur combien de temps il reste jusqu'à ce que la prochaine bougie se forme. Quand il reste moins de 5% jusqu'à ce que la bougie actuelle soit fermée, la couleur du temps change. Voici les paramètres: 1 - couleur de la minuterie de la bougie, quand il reste PLUS de 5% avant la fermeture de la barre actuelle; 2 - couleur de la minuterie de la bougie, quand il reste MOINS de 5% avant la fermeture de la barre actuelle; 3 - taille de la p
FREE
Scalping Strategy BUY SELL
Having a strategy in the market is one of the main conditions for trading. The presence of various and complicated indicators and tools sometimes makes trading difficult, and the user gets confused after trying various methods and gets stuck in a loss cycle, the result of which is usually clear. This indicator is a simple strategy based on the detection of pivots and short-term trends, which helps you to easily trade in trends. Sometimes a simple but efficient st

The indicator monitors price movements in relation to a dynamic trailing stop line derived from the Average True Range (ATR). The trailing stop line adjusts based on market volatility, with the ATR determining the distance of the stop from the current price. This allows the stop to widen during periods of high volatility and tighten during calmer market conditions. The indicator tracks how the price interacts with this trailing stop line, marking potential reversal points when the price crosses
FREE

The indicator defines the buy and sell arrows with high performance and consistent results. Suitable for trend trading or following the trend. Automatic analysis of market opportunities ; Help traders earn more from their investments;
Never repaints, recalculates or backpaints signals; This is FREE demo version of the indicator and works only on "GBP USD M5" . The demo version does not work on SUFFIX OR PREFIX brokers ! Forex Trend Commander All details about the indicator here :
FREE

This indicator/dashboard , is place on a single symbol. It shows the percentage of movement withing all time frames from M1 to W1.The text will change green if all % are in the positive for a buy signal.The text will change red if all % are below zero and in negative for a sell signal. There are audible notifications, as well as on screen notifications along with push notifications that can be turned on and ON/OFF in the settings.
This is a sure way to Find trends quickly and efficiently, with
Доброго времени суток.
Вашему вниманию простой, но крайне удобный продукт для любителей индикатора Parabolic SAR . Он представляет собой окно осциллятора, на который выводится несколько тайм-фреймов в режими реального времени вместе с индикатором.
Настройки интуитивно понятные, что бы включать и отключать количество выбранных таймов - необходимо применять PERIOD_CURRENT, в таком случае дополнительный тайм не откроется.
Пишите в комментариях к продукту, что бы вы хотели увидеть в новых вер
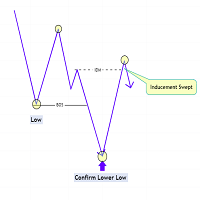
The Market Structure with Inducements & Sweeps indicator is a unique take on Smart Money Concepts related market structure labels that aims to give traders a more precise interpretation considering various factors.
Compared to traditional market structure scripts that include Change of Character (CHoCH) & Break of Structures (BOS) -- this script also includes the detection of Inducements (IDM) & Sweeps which are major components of determining other structures labeled on the chart.
SMC &
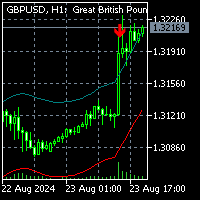
To get access to MT5 version click here . This is the exact conversion from "Nadaraya-Watson Envelope" by " LuxAlgo ". (with non-repaint input option) This is not a light-load processing indicator if repaint input is set to true . All input options are available. Buffers are available for processing in EAs. I changed default input setup to non-repaint mode for better performance required for mql market validation procedure . Here is the source code of a simple Expert Advisor operating

MT4 is a Histogram version of MT5: https://www.mql5.com/en/market/product/122151 Introducing Trade Sniper: Your Edge in the Markets. Tired of missing profitable trades or getting caught on the wrong side of the market? Meet Trade Sniper, the cutting-edge indicator that harnesses the power of trends to give you a razor-sharp advantage in your trading. Trend Sniper is not just another run-of-the-mill indicator. It's a sophisticated tool that combines advanced algorithms with time-tested trading

Session Standard Deviation Date Range Analyzer: Evaluate the standard deviation of each bar's price (high, low, close, open, weighted, median, and typical) within defined trading sessions and date ranges, providing detailed insights into price volatility and market behavior. **Note:** When the trading platform is closed, the indicator may not load correctly. To ensure it works, you may need to load the indicator, unload it, and then load it again. **Note:** This indicator can only be used with
FREE
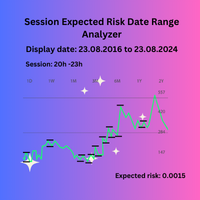
Session Expected Risk Date Range Analyzer: Analyzes price data across specified date ranges to provide detailed insights into financial risk and volatility, using each bar's price metrics for accurate risk assessment.
The Session Expected Risk Date Range Analyzer is a sophisticated tool designed to offer traders and analysts detailed insights into the expected financial risk across specific date ranges. Unlike traditional session-based analysis, this indicator focuses on calculating risk met
FREE
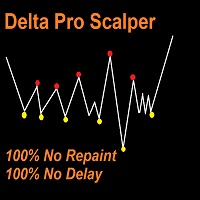
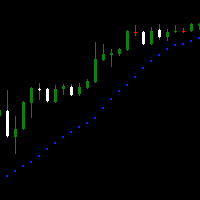
Delta Pro Scalper - Your Ultimate Trend Trading Solution, Delta Pro Scalper is a TREND indicator that automatically analyzes the market and provides information about the trend without redrawing or delay.
The indicator uses candlestick OHLC data and analyzing them to determine up trend or down trend, You MUST wait till closing candle, once the dot appear the next open candle you can open buy or sell position. Red Dot = Bearish Trend (Open SELL)
Yellow Dot = Bullish Trend (Open BUY) Here's th

Выпадающее меню для трендовых линий и прямоугольника. Позволяет редактировать цвет, стиль и толщину. При выделении линии появляется меню, каждая функция разделена. Можно сразу нажать и поменять на нужное. Толщина меняется по другому, нужно нажать на цифру, она станет в синем цвете, нажать нужную цифру от 1 до 4, в зависимости от нужной толщины, нажать интер.

Le MACD est l'un des indicateurs de momentum et de tendance les plus populaires. Currency Strength Meter est également un indicateur de tendance basé sur plusieurs devises. MACD Currency Strength Meter est un indicateur à un graphique qui a l'algorithme de MACD et Currency Strength Meter. Il a également une fonction en un clic, dans laquelle 28 paires majeures et mineures sont affichées sur votre tableau de bord, en cliquant sur une certaine paire, votre graphique passera automatiquement au gra

Indicator Waiting Volatility - un indicateur pour déterminer les zones de volatilité et les conditions plates.
Au fil du temps, le prix sur le graphique évolue dans différentes tendances, diminue, augmente ou reste le même. L'indicateur aide le trader à déterminer dans quelle tendance se situe le prix.
Dans son travail, il utilise plusieurs outils d'analyse technique : d'abord, la direction de la tendance est déterminée, puis, dans cette direction, l'indicateur surveille l'évolution de la vola

SENSE est un système automatisé qui combine des méthodes GANN sélectionnées avec des calculs fractals. Le système nous indique où ouvrir et fermer les transactions. Plus besoin de perdre du temps avec des calculs complexes - SENSE fait tout pour vous. Il suffit d'installer l'indicateur.
Principes de base :
Le marché est haussier lorsque le prix se situe au-dessus des lignes blanches.
Acheter au-dessus des lignes blanches, s'arrêter en dessous Les lignes vertes sont des objectifs de haus

Maîtrisez la puissance du trading de tendance
Cet indicateur est conçu pour les traders débutants, intermédiaires et professionnels. Il simplifie le processus de trading en détectant avec précision la tendance réelle sur n'importe quelle paire de devises.
Pourquoi choisir cet indicateur ?
- Trading simplifié : Plus besoin d'analyses complexes. Chargez l'indicateur sur le graphique, attendez les signaux d'achat ou de vente, et vous n'avez plus besoin de surveiller le graphique toute la jou
L'indicateur Follow Line est un outil essentiel pour les traders qui souhaitent identifier et suivre les tendances du marché avec précision. Cet indicateur s'adapte dynamiquement aux variations de prix, en traçant une ligne qui suit le mouvement des prix de manière fluide et continue. Grâce à sa simplicité visuelle et à son efficacité à signaler les changements de tendance, Follow Line est un excellent ajout à la stratégie de tout trader. Caractéristiques principales : Suivi des tendances : Foll
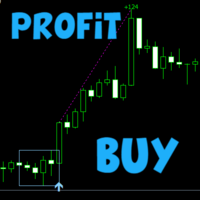
Scalper Box MT4
Fully ready strategy for trading on all markets (Stocks, Futures, Forex and Cryptocurrencies).
Indicator signals are not repaint!!!
Discounted price - 50$ (2 copies only) The next price is 99$
How to trade?
Wait for a signal from the indicator Scalper Box MT4 (blue arrow - buy, red arrow - sell).
After the signal we immediately enter the market, SL set behind the formed box.
Using trend filter indicator and template
Recommended timeframe:
M5 - Ideal for Sca
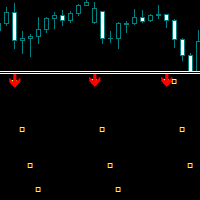
Un indicateur technique conçu spécifiquement pour le scalping qui peut identifier les impulsions de volatilité et montrer leur durée.
Il dispose de paramètres flexibles pour les réglages manuels, vous permettant d'appliquer la fonctionnalité de l'indicateur à n'importe quel instrument de trading.
Les délais recommandés à utiliser sont M5, M15, M30, H1 et H4.
Il existe plusieurs types d'alertes.
Tous les signaux ne changent ni ne se recolorent jamais à la fermeture de la bougie.
L'indicate

Signal Bomb Bank : votre indicateur de confiance dans MetaTrader 4
Bomb Bank Signal est un indicateur puissant pour MetaTrader 4, conçu pour identifier les tendances les plus pertinentes du marché financier. Si vous recherchez un outil qui anticipe avec précision les mouvements, la Bomb Bank est l’alliée qu’il vous faut.
Comment ça marche :
Cet indicateur combine trois méthodes distinctes – analyse de volume, clôture de bougie et tendance symétrique – pour détecter et signaler les opportu

This indicator is not a guarantee of profitability but is designed to provide valuable insights and reduce the time spent analyzing charts, allowing you to focus on what matters most—your time.
The "Candle Info" indicator is designed to analyze and display specific candle formations directly on the chart within MetaTrader 4 (MT4). The indicator provides traders with visual cues about market sentiment by identifying various candle formations, such as Higher Highs, Lower Lows, Higher Lows, and
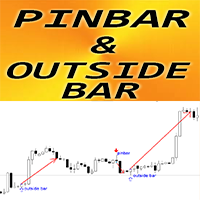
Forex Indicator " Pin Bar & Outside bar Patterns" for MT4 Indicator " Pin Bar & Outside Bar Patterns " is very powerful for Price Action trading Indicator detects Pin Bar and Outside bar Patterns on chart: Bullish pattern - Blue arrow signal on chart (see pictures) Bearish pattern - Red arrow signal on chart (see pictures) No repaint; No delays; with PC, Mobile & Email alerts Indicator "Pin Bar & Outside Bar Patterns " is excellent to combine with Support/Resistance Levels //
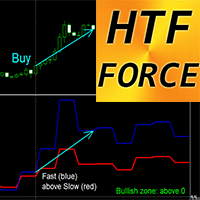
Forex Indicator HTF Force Oscillator for MT4 HTF Force is powerful indicator for Multi-Time Frame trading . HTF means - H igher Time Frame Force index is one of the top indicators that combines price and volume data into a single value Values from High time frame can show you the trend direction (downtrend - below 0; uptrend - above 0) Fast Force - Blue line, Slow Force - Red line Buy signal - Fast line crosses Slow line upward and both - above 0 (see picture) Sell signal - Fast line cr
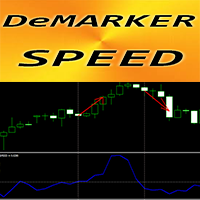
Forex Indicator " DeMarker Speed" for MT4 The calculation of this indicator is based on equations from physics. DeMarker Speed is the 1st derivative of DeMarker itself DeMarker oscillator curve indicates the current price position relative to previous highs and lows during the indicator calculation period
DeMarker Speed is good for scalping entries when standard DeMarker oscillator is in OverSold/OverBought zone (as on pictures) DeMarker Speed indicator shows how fast DeMarker itsel
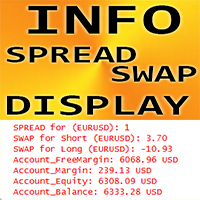
Forex Indicator "INFO Spread Swap Display" for MT4, Trading Support tool. INFO Spread Swap Display indicator shows current S pread and Swaps of forex pair where it is attached. It also indicates account Balance, Equity and Margins It is possible to locate indicator values in any corner of the chart: 0 - for top-left corner, 1 - top-right, 2 - bottom-left, 3 - bottom-right It is possible to set up color and font size as well // More great Expert Advisors and Indica
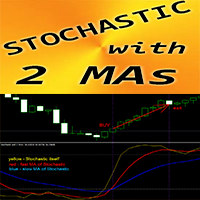
Forex Indicator " Stochastic and 2 Moving Averages" for MT4 Stochastic oscillator is one of the best indicators on the market - perfect tool for many traders. "S tochastic and 2 Moving Averages" Indicator allows you to see Fast and Slow Moving Averages of S tochastic oscillator OverBought zone - above 80; OverSold one - below 20 It is great to take Sell entries from above 80 zone and Buy entries from below 20 You can see Buy and Sell entry conditions on the pictures

Forex Indicator "Support Resistance Levels" for MT4 Indicator " Support Resistance Levels" is very useful auxiliary indicator for trading 'Support' and 'Resistance' are important zones on chart respected by price
Support level is where the price regularly stops falling and bounces back up
Resistance level is where the price normally stops rising and dips back down I ndicator " Support Resistance Levels" shows the recent levels: Resistance levels - red lines. S upport levels - blue lines

YOU CAN NOW DOWNLOAD FREE VERSIONS OF OUR PAID INDICATORS . IT'S OUR WAY OF GIVING BACK TO THE COMMUNITY ! >>> GO HERE TO DOWNLOAD
V1 Scalper is an easy to use tool designed for trend scalping. It tries to spot good entry points in a major trend by using swing high and lows formed along the trend . This tool can be used on Fx Pairs , Indices , Commodities and stocks. Not often but in some signals , the arrow might repaint on the current candle so extra confirmation tools are advised for t
FREE
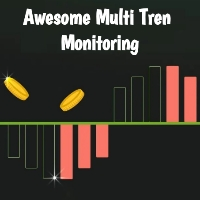
This indicator was created based on a multi-time trend monitoring system by combining several trend signals into 1 signal in the panel. This indicator is also equipped with an alert feature. Try to master how to reveal Fibo Weasel Candle Break Reetes to make it easier to use this indicator. for entry we only monitor the signal in the top left corner for the ongoing trend as a trading reference For the risk reward reference, we use the Fibo Weasel withdrawal reference which is in the same direct
FREE

Platone Breakout SMC - Advanced Trading Indicator Overview The Platone Breakout SMC is an innovative and powerful MetaTrader 4 (MT4) indicator designed for traders who seek to capitalize on smart money concepts (SMC) and breakout trading strategies. This indicator provides precision in identifying breakout levels, session times, and profit targets, ensuring that traders can execute well-informed trades with confidence. Trading Logic The core of the Platone Breakout SMC is its ability to identif
FREE
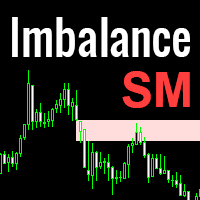
Imbalance is one of the important zones on the chart, to which the price will always strive to cover it. It is from the imbalance zone that the market most often makes significant reversals, rollbacks and gives entry points that you can successfully trade. In the Smart Money concept, the imbalance zone is used to find an entry point, as well as a place for take profit at the level of imbalance overlap by the price. Until the imbalance is overlapped, it is the closest target for the price. Ho
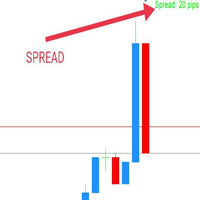
L'indicateur WaSpread MT4 montre le spread en pips avec les couleurs. Avec cet indicateur, vous pouvez:
* Configurer le seuil de spread avec les couleurs pour identifier quand le spread dépasse le seuil.
* Configurer les axes X et Y tout en choisissant les angles et le point d'ancrage pour afficher le spread.
* Ecrire la police et la taille de la police pour plus de confort.
* Activer l'alerte si le spread dépasse le seuil de spread défini.
* Pour plus de précision, vous pouvez aussi
FREE
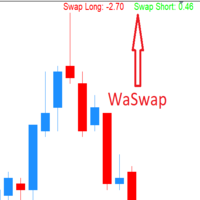
L'indicateur WaSwap MT4 montre le Swap d'achat et le Swap de vente avec des couleurs. Avec cet indicateur, vous pouvez:
* Configurer le seuil de swap avec les couleurs de votre choix pour identifier quand le swap en dessous de votre seuil.
* Configurer les axes X et Y tout en choisissant les angles et le point d'ancrage pour afficher les swaps.
* Ecrire la police et la taille de la police pour plus de confort.
* Activer l'alerte si le Swap d'achat et/ou le Swap de vente sont/est en dess
FREE
This indicator is designed for effective short-term trading and the most aggressive reinvestment of potential profits into new positions. The philosophy of its use involves entering based on the indicator signal and fixing profit/loss as quickly as possible when receiving an opposite indicator signal on an even shorter time period of the chart.
Thus, the algorithm for effectively using the presented indicator is as follows: 1. Wait for a buy/sell signal to appear. The signal appears at the mom

Aristotle Market Profile SMC Indicator: Overview: The Aristotle Market Profile SMC Indicator, is a comprehensive and highly customizable tool designed for traders seeking to integrate Market Profile analysis into their trading strategies. This advanced indicator is built to display the Market Profile across various trading sessions, including intraday, daily, weekly, and monthly periods, offering deep insights into market behavior and price levels over different timeframes. Key Features: Multip
FREE

This indicator works on MT4 and is very easy to use. When you receive a signal from it, you wait for that candle with the signal to close and you enter your trade at the beginning of the next new candle . A red arrow means sell and a green arrow means buy. All arrows comes with Alert like for easy identification of trade signal. Are you okay with that?
1 minute candle
1 minute expire

Adjustable Consecutive Fractals looks for 2 or more fractals in one direction and sends out a on screen alert, sound alert and push notification, for strong reversal points .
Adjustable Consecutive Fractals, shows the fractals on chart along with a color changing text for buy and sell signals when one or more fractals appear on one side of price.
Adjustable Consecutive Fractals is based Bill Williams Fractals . The standard Bill Williams fractals are set at a non adjustable 5 bars, BUT withe

The Binary Profit Maker,
This indicator works on MT4 and is very easy to use. When you receive a signal from it, you wait for that candle with the signal to close and you enter your trade at the beginning of the next new candle . A Up Purple arrow means Buy and a Down Purple arrow means Sell. All arrows comes with Alert like for easy identification of trade signal. Are you okay with that?
How To Enter Trade?
1 minute candle
1 minute expire

Average Session Range MT4: Calculate and Average the Sessions High-Low Range of Specific Time Sessions Over Multiple Days. The Session Average Range is a sophisticated and precise tool designed to calculate the volatility of specific time sessions within the trading day. By meticulously analyzing the range between the high and low prices of a defined trading session over multiple days, this tool provides traders with a clear and actionable average range. **Note:** When the trading platform is cl
FREE
123456789101112131415161718192021222324252627282930313233343536373839404142434445464748495051525354555657585960616263646566676869707172737475767778798081828384858687888990919293949596979899100101102103104105106107108109110111112113114115116117118119120121122123124125126127128129130131132133134135136137138139140
Le MetaTrader Market est la seule boutique où vous pouvez télécharger un robot de trading de démonstration gratuit pour le tester et l'optimiser à l'aide de données historiques.
Lisez l’aperçu de l'application et les avis d'autres clients, téléchargez-la directement sur votre terminal et testez un robot de trading avant de l'acheter. Seul MetaTrader Market vous permet de tester gratuitement une application.
Vous manquez des opportunités de trading :
- Applications de trading gratuites
- Plus de 8 000 signaux à copier
- Actualités économiques pour explorer les marchés financiers
Inscription
Se connecter
Si vous n'avez pas de compte, veuillez vous inscrire
Autorisez l'utilisation de cookies pour vous connecter au site Web MQL5.com.
Veuillez activer les paramètres nécessaires dans votre navigateur, sinon vous ne pourrez pas vous connecter.