Regardez les tutoriels vidéo de Market sur YouTube
Comment acheter un robot de trading ou un indicateur
Exécutez votre EA sur
hébergement virtuel
hébergement virtuel
Test un indicateur/robot de trading avant d'acheter
Vous voulez gagner de l'argent sur Market ?
Comment présenter un produit pour qu'il se vende bien
Nouveaux indicateurs techniques pour MetaTrader 4 - 61
Binary Options Assistant (BOA) COLD Signals Indicator provides signals based on Amalia Trader Binary Options Strategy. Indicators: Keltner & Stochastic
Stop missing trades, stop jumping from chart to chart looking for trade set-ups and get all the signals on 1 chart! U se any of the BOA Signals Indicator with the Binary Options Assistant (BOA) Multi Currency Dashboard . All BOA Signal Indicator settings are adjustable to give you more strategy combinations. The signals can be seen visually
Binary Options Assistant (BOA) BURN Signals Indicator provides signals based on Ana Trader Binary Options Strategy. Indicators: MACD & Stochastic
Stop missing trades, stop jumping from chart to chart looking for trade set-ups and get all the signals on 1 chart! U se any of the BOA Signals Indicator with the Binary Options Assistant (BOA) Multi Currency Dashboard . All BOA Signal Indicator settings are adjustable to give you more strategy combinations. The signals can be seen visually and h
Binary Options Assistant (BOA) CHILL Signals Indicator provides signals based on Katie Tutorials Binary Options Strategy. Indicators: 3 Moving Averages & RSI Stop missing trades, stop jumping from chart to chart looking for trade set-ups and get all the signals on 1 chart! U se any of the BOA Signals Indicator with the Binary Options Assistant (BOA) Multi Currency Dashboard . All BOA Signal Indicator settings are adjustable to give you more strategy combinations. The signals can be seen visual

Pivot Pro with Alert Pivot points offer very good brands that are often run over by price. At these brands, reactions of the price arise. They can be used excellently as target zones, or as entrances.
The alarm function allows several charts to be opened and it is very easy to find profitable entries.
No missed entries through notification on the mobile phone. You can watch the market with Alerts.
These settings can be changed:
Width of the alarm zone Colors of all pivot lines Colors of
This indicator is a professional Trend identifier, it measures the angle or slope of moving averages with different methods. As this indicator calculate angles you can identify the strength of trend by magnitude of angle. It also shows if angle is increasing or decreasing which gives you the opportunity to make more information about current trend. You can combine this indicator with your strategy as a filter or you can use it alone to make your trading system. This is not a repainting indicator
FREE

Alerts you on new trends, with ENTRY and EXIT points. INSTRUCTIONS Select asset of choice, activate the indicator on the chart and just follow the signals from the arrows. ITS FREE, GIVE ME A GOOD RATING!
Platform : Metatrader4 Asset : All Currencies, Gold, BTCUSD, NASDAQ PS : F or newbie and pro traders. Used by more 3,000 traders around the world.
Send a mail for further help and information...........

Broomby Indicator is a trading tool that can be used both independently and in addition to other systems.
It is recommended to use in conjunction with instruments by trading levels. It can be a great filter for opening deals.
Broomby gives 2 types of signals: preliminary and basic. The main one is more filtered, but it depends on you which one suits you best.
It can be used in both trading and options.
Number of last bars - Latest Bars to Analyze Minimum Pips Distance - Pips filter. T
YOU ARE PUCHASING A FOREX INDICATOR THAT WAS CUSTOM BUILT IN 2021 THIS INDICATOR WILL HELP YOU FIND PRECISE ENTRIES FOR TRADES. SO HOW DOES IT WORK? 1) It looks for engulfing candlestick pattern. (It can tell if there is a bullish or bearish engulfing pattern which is a typically a reversal signal) 2) It will also look to see if price is near a short term extreme by using Bollinger Bands. 3) It combines the engulfing candle stick pattern along with Bollinger Bands to give signal 4) If price has
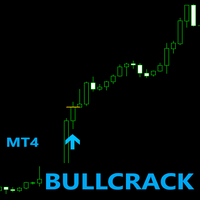
BULLCRACK MT4
*Non-Repainting Indicator/Analyzer Pick trades when it 20-30 confirmed a bull trend. No need to filter trades as every single signal has gone through multiple levels of confirmations. Strictly on buy trades . STRICKTLY FOR THE 15MINS TIMEFRAME!! Trades any pairs . *Push notifications to phone or computer * For Scalping * For Swing Trading *Arrow Appears at The "Close Of The Candle" *popup alerts* No much trades cause no random trades!
**very perfect for Expert and New Trader

Binary Options Assistant (BOA) Multi Currency Dashboard for Binary Options (MT4) .
You can use any of the BOA Signals Indicators with the dashboard. Just change the BOA Signals Indicator Name in the dashboard settings to the indicator you want to get signals from. For example: CHILL.
BOA_BURN_Indicator_v1 Strategy : Ana Trader Binary Options Strategy (MACD & Stochastic)
BOA_COLD_Indicator_v1 Strategy : Amalia Trader Binary Options Strategy (Keltner & Stochastic)
BOA_CHILL_Indicator_

Using the indicator you can 1 Identify the trend and follow the large and small trends by drawing lines. When the price leaves the corridor of the lines, then with a high probability the price will go to the next line and reverse on it. 2 Long-line - Lay lines along the centers of fractals, the indicator can detect the fractal of the second point (Number bars analysis). Often the price can approach the line even after a week or a month and you can open a reversal trade. If the wave has passed w
FREE
Diverses fonctions de fenêtre peuvent être utilisées pour lisser les séries chronologiques. Les fonctions de fenêtre peuvent être très différentes les unes des autres dans leurs caractéristiques - le niveau de lissage, la suppression du bruit, etc. Cet indicateur permet d'implémenter les fonctions de la fenêtre principale et d'évaluer leurs performances sur des séries temporelles financières. Paramètres de l'indicateur : iPeriod – période de l'indicateur. iPériode >= 2 iCenter est l'index d

Scalping indicator. It takes into account volatility, price movement in the local interval and the direction of the current trend. Recommended timeframe - M5. Advantages: Low volatility when a signal appears ensures minimal movement against an open position. The indicator does not redraw its signals. There are alert signals. It is a great tool for day trading.
Settings: Name Description Period Indicator period Range of each bar in the period (pp.) The maximum size of each candle in the indicat
FREE

The indicator is based on the classic CCI indicator. I recommend watching my advisor - Night Zen EA Doesn't redraw its signals. There are alerts for the incoming signal. It contains 2 strategies: Entry of the CCI line into the overbought zone (for buy trades ) / into the oversold zone (for sell trades ) Exit of the CCI line from the overbought area (for sell trades) / from the oversold area (for buy trades)
Settings: Name Setting Description Period Period of the classic CCI indicator Price C
FREE

This tool scans the market looking for the correct entry. You can see and evaluate it yourself, perhaps it will suit you for a number of tasks related to forecasting price movements. It uses only price data and analytics to calculate entry points. Does not use auxiliary indicators. It has two parameters for customization.
Setting the indicator. Interval - price analysis interval. Subterfuge - analysis correction interval.
The Mockingbird indicator is more interesting on long trends. A filter is required to work in flat. The border of the trend / flat value is dynamic and depends on the indicator parameters. You yourself are able to adjust it. The indicator is easy to configure. Works on all timeframes and on all instruments.
Segment - Segment of the market for analysis. Length - The number of bars to be recalculated.

Catch is a reversal indicator and is part of a special category of instruments. it not only analyzes the price movement, but also indicates the points of possible reversals. This facilitates fast and optimal opening of buy or sell orders (depending on the current situation). In this case, the historical data of the analyzed asset must be taken into account. It is the correct execution of such actions that largely helps traders to make the right decision in time and get a profit.

Technical - First of all, this is a trend indicator. Classic signal indicator. Fundamental analysis is based on data from the Economic Calendar, while technical analysis is based on indicators. It should be understood that any indicator is an algorithm that is displayed on the chart as icons. Inside it is a certain formula that calculates the information a trader needs based on past data.
Please note: the indicator does not predict the future! Even the best algorithms only summarize everythin

The Story indicator predicts the most likely short-term price movement based on complex mathematical calculations. The indicator is interactive and easily customizable. This is a universal indicator, the values of which are calculated based on complex mathematical calculations. The indicator generates arrows that characterize the current price dynamics. The product can be used as a trend indicator or oscillator.
Peculiarities Estimation of the current price movement; Calculation of the curr

Matrix is a Forex arrow indicator. Displays signals simply and clearly! The arrows show the direction of the transaction, and are colored accordingly, which can be seen in the screenshots. As you can see, trading with such an indicator is easy. I waited for an arrow to appear in the desired direction - I opened a deal. An arrow formed in the opposite direction - closed the deal. The indicator also displays the lines with the help of which the arrow signals are formed, taking into account the int

Platoon is an indicator designed to be able to detect a bottom or top similar to the Fractals indicator, but of course a different algorithm is used. In other words, you should not enter into a buy deal if the fractal is below. And you should not enter into a sell deal if the fractal is higher.
The indicator only denotes fractals on the chart without performing any additional calculations, therefore, theoretically, any trader can find these patterns by himself. But what is a fractal, how exac

Angry is a trend indicator, it indicates well the points of the beginning of the trend and its completion or reversal. This tool scans the market looking for the correct entry. Against the background of insignificant fluctuations, it is possible to identify a trend and indicate its direction. It uses only price data and analytics to calculate entry points. Does not use auxiliary indicators.
Angry captures moments of stable price movement direction. There are only three types of trend: Bullish

The Matios indicator visually unloads the price chart and saves analysis time: no signal - no deal, if an opposite signal appears, then the current deal should be closed. This is an arrow indicator for determining the trend.
According to the wave theory, Matios displays the course of the wave, while the oscillator can specify the entry point, that is, catch the price movement inside it, i.e. small “subwaves”. By correctly understanding the wave nature of price movements and using the Matios i

The Schindler indicator implements a trend trading strategy, filtering and all the necessary functions built into one tool! The principle of operation of the indicator is to automatically determine the current state of the market when placed on a chart, analyze historical data based on historical data and display instructions for further actions on the trader's screen. You need to understand that any arrow indicator is only a visual form of a signal. As a rule, such Forex indicators contain a wh

I present to your attention my new Bacheha indicator. Which generates signals based on the calculation of a complex algorithm. This indicator displays signals in the form of arrows on the price chart. Signals are displayed only on a fully formed candlestick. After being displayed, the signal is not redrawn.
Volatility is taken into account when calculating values. It can be used to identify overbought or oversold zones in the market. Reaching such levels indicates that the market may soon rev
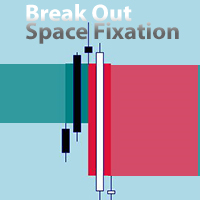
An EA version is being prepared. You can send a private message "notify about EA version".
EA will be versatile with many settings for trading on various indicators. The new EA will also allow trading on this indicator. For example, allowing signals after X signals/bars to X signals/bars in one direction, before changing direction. If Break Out happened before/after the signal of another indicator. Collect profit on each next signal above/below the previous one.
Send a private message "noti
FREE

Description:
The Wall of Worry indicator allows you to assess market sentiment and possible reversals. The indicator represents three lines that are displayed in a separate window.
Black line (trend) - the amount of volumes in the candle body.
Red line (bears) - the amount of volumes in the upper shadow of the candlestick.
Blue line (bulls) - the amount of volumes in the lower shadow of the candle.
The idea is based on "Wall of Worry" - this is the periodic tendency of financial marke
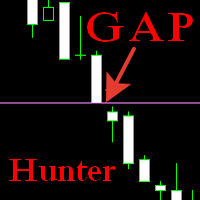
The indicator displays closed and unclosed gaps on a given timeframe and time range. By default, the display of closed gaps is disabled, the search timeframe is the current one. In the flat, it helps to track the direction of the position set by large market participants. In the trend, it shows the points of completion of the position by large market participants. Filters out false pivot points. Another point I wanted to explain, if the parameter Timeframe_for_Search is set to Current in the in
GannRS Trend Scalper GannRS is an advanced trading tool based on Gann Law and Supports and Resistances. designed to have an active trading at any time not lagging Indications are given at the beginning of a new candle
Please watch the full tutorial video.
How to use GannRS Very easy to set up... Put it on your chart Adjust inputs
Inputs Show Resistance and support : [bool] true = Shows R/S on chart false = does not show Show Levels :[bool] true = Shows levels on the chart false = doe

Fully featured Pivots and Levels indicator Pivots: Floor (normal), Woody, Camarilla, Fibonacci Levels: ATR, Historical Volatility with standard deviations, Close Price Volatility with standard deviations
Features: 4 +/- levels MTF, pivots/levels based on Daily, Weekly, 4hr or even 15min Hour and minute time offset
Texts with prices and pip distances to central pivot/level Inputs for Camarilla/Fibonacci/ATR/Volatility levels
Alerts, popup, push, email, sound, live or completed candles on leve

YOU CAN NOW DOWNLOAD FREE VERSIONS OF OUR PAID INDICATORS . IT'S OUR WAY OF GIVING BACK TO THE COMMUNITY ! >>> GO HERE TO DOWNLOAD
Momentum channel is a simple momentum based system yet with a great degree of accuracy in detecting turning points. The market momentum are defined by Average True Range Channels . When price breaks these channels most times , it is an indication of a shift in market momentum and thus a possible new trend formation. The system can be traded on any time frame an
FREE

This support and resistance indicator gives u a)support level b)resistance level c)direction(trend) all in one.The indicator is based on the top 3 best levels there are!Red dots are sell direction and green dots are buy direction,if candles dont break these levels u get in after the 3rd dot,always use higher time frames from h1 up so its more clear where direction is going,also u can set the indicator to your time frame that u are lookin at.
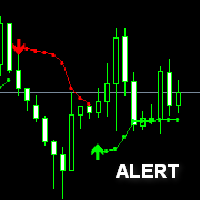
bollinger Stop Alert Indicator is one of the simplest trend-following indicators you may have ever experienced. Besides defining the market trends it also determines possible trend reversal points which are interpreted as trade signals. The bollinger stop can be applied to trade all kinds of forex currency pairs. bollinger Stop Alert Indicator suits all sorts of timeframe charts available within your forex MT4 trading platform thus supports both scalping and day trading. You can also easily cu
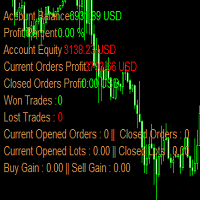
account_info_horizontal is a mt4 (MetaTrader 4) indicator and it can be used with any forex trading systems / strategies for additional confirmation of trading entries or exits.
Indicators add account information to chart. Profit, Balance, Equity, Free Margin, Margin and Margin Level %.
AccountInfo indicator can reveal all advanced features of MetaTrader 4 (above build 600). This indicator can clearly symbolize the main data of the current account (balance, equity, free margin, current Pro

Real Trend Zigzag shows the real trend of a market, u nlike the default Zigzag indicator. It calculates the trend in real time and shows green lines for upwards trends, red lines for downward trends and blue lines for no trends. Regarding the old slogan "the trend is your friend" it helps you to decide if should open a buy or sell position. MT5 Version can be found here: https://www.mql5.com/en/market/product/72065 If you are looking for a multi timeframe zigzag, take a look at the PRO vers

Real Trend Zigzag PRO shows the real trend of a market, u nlike the default Zigzag indicator. It calculates the trend in real time and shows green lines for upwards trends, red lines for downward trends and blue lines for no trends. Regarding the old slogan "the trend is your friend" it helps you to decide if should open a buy or sell position. The PRO version is a multi timeframe zigzag (MTF). Means, it shows the trend of the current timeframe as well as the trend of a higher or lower time.

What Is a Pivot Point? A pivot point is a technical analysis indicator, or calculations, used to determine the overall trend of the market over different time frames. The pivot point itself is simply the average of the intraday high and low, and the closing price from the previous trading day. On the subsequent day, trading above the pivot point is thought to indicate ongoing bullish sentiment, while trading below the pivot point indicates bearish sentimen
How to Use Pivot Points The very e

Super Trend Button Super Trend is a trading strategy according to which one should trade Forex or Stocks when its price trend goes up, and trend goes down, expecting price movements to continue. “The trend is your friend” agree? Features - Special Button : Quick hide/show Super Trend chart. ( Make your Chart more clean and clear easily) - Color : You have the option of customising your favourite colour of Up Trend or Down Trend . - Super Trend Periods : You have the option to c
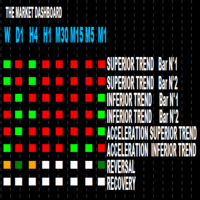
1. Access to all market in the same graphic You know exactly what happens in the market from the shortest timeframe(M1) to the biggest one (MONTH). You will see wether there is a reversal, recovery,acceleration, deceleration of the market. Therefore your decisions become more easy to take and as you are far from usual stress that traders are facing because of numerous analysis they have to do in order to enter or exit the market.
2. Features Every timeframe shows: SUPERIOR TREND B

Si vous aimez ce projet, laissez un examen 5 étoiles. Suivre l'instagram: borelatech Le prix moyen pondéré en volume est le ratio de la valeur échangée au volume
total
traded over a particular time horizon. C'est une mesure du prix moyen à
qu'un stock est échangé sur l'horizon commercial. VWAP est souvent utilisé comme
un
référence commerciale des investisseurs qui visent à être le plus passif
possible dans leur
exécution. Avec cet indicateur, vous pourrez dessiner le VWAP pour : La jo
FREE

Si vous aimez ce projet, laissez un examen 5 étoiles. Suivre l'instagram: borelatech Cet indicateur tire les prix ouverts, élevés, bas et de fermeture pour les prix
spécifiés
période et il peut être ajusté pour un fuseau horaire spécifique. Il s ' agit là d ' un niveau important qui s ' intéresse à de
nombreux domaines institutionnels et professionnels.
traders et peut être utile pour vous de connaître les endroits où ils pourraient
être plus
active. Les périodes disponibles sont les su
FREE

The indicator analyzes the price structure of fractals and identifies possible reversal points of market dynamics. Perfect when used in combination with other types of indicators.
Advantages:
Works on all instruments and timeseries, Doesn't redraw its results, Customizable colors of indicator elements, Works well with any trending strategy, Adjusting the strength of fractals.
MT5 version -> HERE / Our news -> HERE
Strategy:
AW Flexible Fractals is an indicator that indicates si
FREE
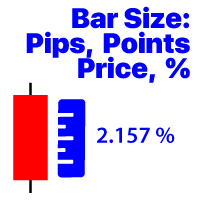
Affiche le changement de prix de la barre sur la période sélectionnée Méthodes de calcul disponibles: Valeur du prix; Valeur en pourcentage (%); PIP; Points de marché; Mon utilitaire #1: comprend plus de 36 fonctions | Contactez-moi si vous avez des questions Le fichier programme doit être placé dans le répertoire "Indicators". Dans les paramètres de l'indicateur, vous pouvez configurer: Taille de la police; Couleur du texte; Positionnement sur le graphique: dans le coin inférieur gauche ou inf

Description Better version of MACD indicator which offer a complete visual trading strategy and realize an auto-optimization
KEY LINKS: How to Install – Frequent Questions - All Products How is this indicator useful? NEVER repaints. Detect best parameters of MACD indicator, based on profit factor during the specified period. This indicator can be used as a visual strategy, following the recommendations of entry, stop, and targets. Indicator features It can be used as a complete trading s
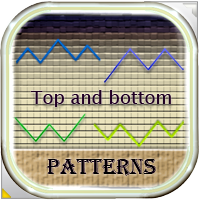
This indicator finds technical analysis reversal patterns such as Double Bottom, Triple Bottom, Head & Shoulders and their opposite counterparts. The indicator shows them on the chart of a currency pair and can signal a trader if a pattern has been formed recently. This allows you to quickly detect a possible trend reversal or correction, it is enough to add an indicator to the chart, after that, you can change different timeframes to quickly find such patterns, if the patterns are not located

"BUYUK SAVDOGAR" TM has developed this strategy to support anyone who trades binary options.
The "monoBAR" trading system is based on mathematical probability and consists of algorithms that can analyze the market situation with high accuracy.
This trading system consists of mathematical probability, which helps to determine the most accurate state of the price movement. The strategy algorithm helps to detect small impulse movements in a timely manner.
You can simultaneously analyze and r
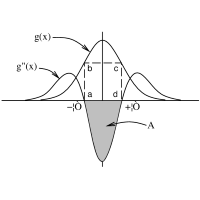
Trend Second Derivative RSI is a forex indicator based on the usual RSI, based on the second derivative of the price function. On the chart itself, trend signals will be displayed by arrows, they are filtered by the algorithm and always alternate buy / sell. It also shows the number of profitable pips that the indicator can give at the specified interval (LimitCalcHistory). The indicator has a parameter (Spread), which deducts a part of the profit per spread for each signal.
Immediately notic

O melhor indicador para o mercado forex, binárias, commodities! Não repinta ( não alterna o sinal, ocultando as percas) 100% transparente e muito eficaz. Ótimo indicador mesmo no período de notícias! Sempre aprimorando para ser o indicador mais poderoso do mercado! Com atualizações mensais... próxima atualização dia 30 de setembro de 2021 CONFIRA!!!!

The Wave Splash technical indicator measures the deviation of the price of an instrument from the average values over a specified period of time. It forms divergence patterns with the price chart and generates leading signals that make it possible to timely detect signs of an upcoming correction in the price of an instrument or a reversal with a trend change even at the moment the price updates extreme values. The Wave Splash indicator is effective in an active market.
Settings:
S
FREE

This is an original, agile, and excellent trending system. Whether you are a beginner trading novice or a professional trader, this set of indicators can help you quickly and timely track the latest changes in market trends. It has the following characteristics: The method of use is extremely simple, plug and play, and the display of all trend analysis results is clear at a glance; There is no need to configure any functional parameters, the trend tracking indicator will automatically analyze th

The General indicator helps to analyze the market on a selected time frame. He defines the mainstream. The Forex General trend indicator provides an opportunity to classify the direction of price movement by determining its strength. Solving this problem helps investors enter the market on time and make good profits.
It does not provide real-time signals, signals arrive late. But nevertheless, it is very effective. You need to read its signals as if it were a zigzag, the principle of receivin

The SPV Volatility indicator is one of the most effective filters. Volatility filter. Shows three volatility options. The so-called limit, real, and the last most effective filter for the filter is the percentage filter. Percentage display of folatility shows the ratio of limit to real volatility. And thus, if we trade in the middle of the channel, then it is necessary to set a condition that the percentage is less than a certain indicator value. If we trade on the channel breakout - following t
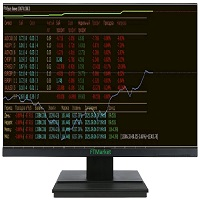
Are you looking for monitoring services to watch trading in the terminal?? You don't need it anymore!! Full monitoring is right in your terminal. There are a couple of strokes left and you can buy it both for real and for a demo test Параметры Parameters:
Max///Statistics Month///Statistics A week///Statistics Day///Statistics
For an open pair:
Symbol Number of orders To buy In villages Density separation Buy profit Sell profit Weekly profit Total profit Drawdown
There is also a built-i

Индикатор предназначен для переключения ТФ. Если у вас стоит советник который зависит от текущего ТФ, тогда это вещица вам необходима. Выставление ТФ происходит по количеству ордеров или по набранной лотности. К примеру, для ясности, если ваш советник начинает просаживаться, набирая сетку, то индикатор переключает ТФ автоматически, на увеличение ТФ и не даёт набирать лотность. Как только он закрыл сетку, происходит автопереключение на М1 и по новой. Так ваш советник торгует как скальпер и далее

Its free now till Frebruary 15th GIVE ME A GOOD RATING! Helio indicator is a advance version of RSI indicator with more features .
It provides technical information about bullish and bearish price momentum , and is often plotted in “Existed pane below”. An asset is usually considered overbought when the Helio is above 70 and oversold when it is below 30. Add your additional chart analysis to filter the signals further . ITS FREE, GIVE ME A GOOD RATING!
Traders of all experience levels ca
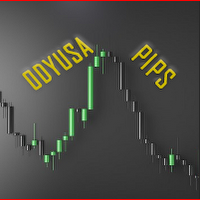
Odyusa Pips is designed to visualize the direction of the trend. This indicator is deprived of delay and therefore very effective. Odyusa Pips determines the direction of the current trend using a cluster digital filter . ITS FREE, GIVE ME A GOOD RATING! Characteristics of the ODYUSA PIPS INDICATOR · Platform: Metatrader4 · Asset: Any available trading assets · Trading Time: Around the clock · Timeframe: Any · Recommended broker: InstaForex , XM , , Rules of trad

I just made it free till 14th February, GIVE ME A GOOD RATING! Pro Blaster is an advanced trading system based on two indicators, each of which in turn is based on the MACD indicator. The system provides signals to enter in the market, which will be understood even by novice traders. ITS FREE, GIVE ME A GOOD RATING! The strategy algorithm has a double trend confirmation and is capable of generating signals. Characteristics of the PRO BLASTER · Platform: Metatrader4 · Currency pair

You don't know what to trade? This is the one for you. Currency Strength (ROC Base) is the easiest way to identify strong and weak currencies. This indicator is a custom-made indicator you can use to determine the currency pairs that are currently trading strongly and the ones that are trading weakly.
This indicator shows the relative strength of 8 major currencies such as AUD, CAD, CHF, EUR, GBP, JPY, NZD, USD. I used a method call " Rate Of Change (ROC) " for calculate all currency in percen

Questo indicatore fractal ti invierà un messaggio telefonico (tramite app mt4) non è necessaria la configurazione dell'indicatore, basta impostare l'ID del tuo smartphone e potrai ricevere il messaggio BUY o SELL in tempo reale (affidabilità 80%)
per qualsiasi domanda o dubbio non esitate a contattarmi su mql5.com o telegram (link al gruppo disponibile in bio)
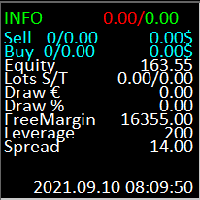
Индикатор информационная панель. 1 строка отображает текущий профит по счету(по всем валютным парам) весь заработанный профит по текущей валютной паре(где стоит индикатор). 2 строка отображает позиции на SELL ордера кол-во открытых ордеров/лотность открытых ордеров и текущий профит по ордерам SELL. 3 строка отображает позиции на BUY ордера кол-во открытых ордеров/лотность открытых ордеров и текущий профит по ордерам BUY/ 4 строка отображает EQUITY. 5 строка отображает лотность закрытых ордеров п
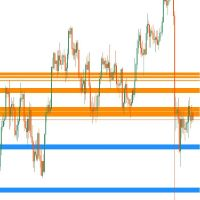
This MT4 indicator can show you Dynamic Support and Resistance Zone in current stage based on Current MA Price in 9 Timeframes, Price Lines or Price Zones for Multi (9) Timeframes according to the setting options as you need which you can set such as MA Period, MA Method, MA Shift, MA Price and you will see price lines all 9 timeframes or you can show Price Zones and also you can hide Minutes timeframes and several setting as you want and You can add several MA Periods in your chart such as 50,

This indicator call "ATR Trend" will display 2 lines on chart, make it easy to trade buy/sell. and also Stop Loss. This Indicator's formula base on standard ATR (Average True Range) function. and I combined it with "Dow Theory" concept. It has 4 parameters. - ATR : Period of ATR it self. - ATR Multiple : Multiple value to display on chart. - Price Mode : Used this price option for check on change to uptrend or downtrend [Open, High, Low, Close, High/Low, (High+Low) / 2, (High+Low+Close) / 3 ,

*Non-Repainting Indicator "Mercy" is an arrow indicator that shows possible bounce set ups. It's best to Use The M5 and M1 charts for indices. M15 and M5 for forex pairs. I recommend turnkeyforex.com as a great broker and the one I personally use Live signal based on this indicator: Hurican TK -Push notifications to phone or computer -Great For Scalping -Great For Swing Trading -Arrow Appears at The "Close Of The Candle" -Works On Any Timeframe -Works On Any Mt4 Pair -Perfect For New Trader

Forex Signal Generator is a cutting edge technology for Trend Trading, and filtering all inbuilt in one tool. The Signal Generator analysis the market like a Pro by using its smart algorithms to detect the trend, filter out market noise and display on your chart with the : ENTRY, STOPLOSS AND TARGET PROFIT
Advantages You Get
Access to the proven reliable trend indicator based
Easy and effective trend detection.
Gives you the ability to filter out 'NOISE' from the ma

L'indicateur ADX est utilisé pour déterminer la tendance et sa force. La direction du prix est indiquée par les valeurs +DI et -DI, et la valeur ADX montre la force de la tendance. Si +DI est supérieur à -DI, alors le marché est dans une tendance haussière, si au contraire, c'est une tendance baissière. Si l’ADX est inférieur à 20, il n’y a pas de direction définie. Dès que l'indicateur dépasse ce niveau, une tendance de force moyenne commence. Les valeurs supérieures à 40 indiquent une ten

L'indicateur construit un sémaphore à trois périodes et une figure de renversement 123 à partir de l'extremum. Le signal est donné à l'ouverture de la deuxième bougie. Cette figure peut être négociée de différentes manières (point de test 3, cassure et autres). La sortie du canal ou la rupture de la ligne de tendance est le principal déclencheur pour trouver un point d'entrée. Les icônes sont colorées en fonction des niveaux de Fibonacci. Les icônes jaunes indiquent le test d'un niveau à partir
Cet indicateur crée un canal par rapport à un autre indicateur graphique : indicateur + ATR et indicateur - ATR . Utile pour savoir si le prix a trop augmenté par rapport à votre niveau de référence. Les niveaux d'ATR peuvent être ajustés avec un multiplicateur. Cette version est plus complexe que son homologue MT5 pour éviter certaines des limitations de MT4 : vous devez introduire le nom de votre ligne de base, les paramètres (dans une chaîne séparée par des virgules) et le tampo
FREE
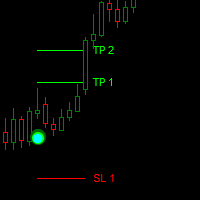
Dark Point is an Indicator for intraday trading. This Indicator is based on Trend Following strategy, also adopting the use of the atr to determine the right volatility. We can enter in good price with this Indicator, in order to follow the strong trend on the current instrument. If you love Dark Point, consider adding some power: Dark Power
Key benefits
Easily visible take profit/stop loss lines Intuitive directional points/arrows by colors Useful statistics , which indicate the win
FREE

Specifically speaking about this indicator (Truman), its signals are very accurate and there is no redrawing. At least this is not an unimportant factor. First of all, I want to note that this indicator is universal and is perfect for almost all underlying assets.
Let's talk in more detail about this indicator and see how to apply it in practice. Before us is a rather simple and unpretentious indicator-switchman. The indicator displays both a line of different colors and arrows to which you c
Second Derivative RSI is a forex indicator based on all familiar RSI, based on the second derivative of the price function.
Just a note on the use of the indicator. The indicator requires selection of settings not only for each currency pair but also for each timeframe. If there is no setting, then as a last resort, the indicator may not show signals! In order to pick up the settings, just use a bot that will help you do it.
The indicator combines the functionality of an oscillator and a tr
Le MetaTrader Market est la seule boutique où vous pouvez télécharger un robot de trading de démonstration gratuit pour le tester et l'optimiser à l'aide de données historiques.
Lisez l’aperçu de l'application et les avis d'autres clients, téléchargez-la directement sur votre terminal et testez un robot de trading avant de l'acheter. Seul MetaTrader Market vous permet de tester gratuitement une application.
Vous manquez des opportunités de trading :
- Applications de trading gratuites
- Plus de 8 000 signaux à copier
- Actualités économiques pour explorer les marchés financiers
Inscription
Se connecter
Si vous n'avez pas de compte, veuillez vous inscrire
Autorisez l'utilisation de cookies pour vous connecter au site Web MQL5.com.
Veuillez activer les paramètres nécessaires dans votre navigateur, sinon vous ne pourrez pas vous connecter.