Regardez les tutoriels vidéo de Market sur YouTube
Comment acheter un robot de trading ou un indicateur
Exécutez votre EA sur
hébergement virtuel
hébergement virtuel
Test un indicateur/robot de trading avant d'acheter
Vous voulez gagner de l'argent sur Market ?
Comment présenter un produit pour qu'il se vende bien
Nouveaux indicateurs techniques pour MetaTrader 4 - 4
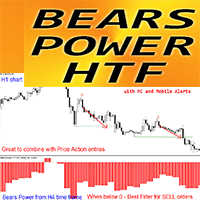
Forex Indicator Bears Power HTF for MT4 Bears Power HTF oscillator is perfect filter for "sell" entries . H TF means - H igher Time Frame Bulls and Bears Power indicators are used in trading to measure the strength of corresponding trends in trading Bears Power measures the strength of sellers' position Bears Power HTF indicator is excellent for Multi-Time Frame trading systems with Price Action entries or in combination with other indicators. This Indicator allows you to
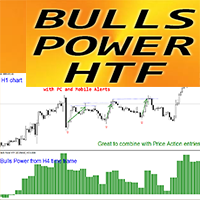
Forex Indicator Bulls Power HTF for MT4 Bulls Power HTF oscillator is perfect filter for "buy" entries . H TF means - H igher Time Frame Bulls and Bears Power indicators are used in trading to measure the strength of corresponding trends in trading Bulls Power measures the strength of buyers' position.
Bulls Power HTF indicator is excellent for Multi-Time Frame trading systems with Price Action entries or in combination with other indicators. This Indicator allows you to
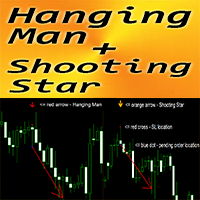
Forex Indicator " Hanging Man and Shooting Star pattern" for MT4 Indicator " Hanging Man and Shooting Star pattern " is very powerful indicator for Price Action trading: No repaint, No delays; Indicator detects bearish Hanging Man and Shooting Star patterns on chart: Bearish Hanging Man - Red arrow signal on chart (see pictures) Bearish Shooting Star - Orange arrow signal on chart (see pictures) P C, Mobile & Email alerts are included Indicator " Hanging Man and Shooting Star" is
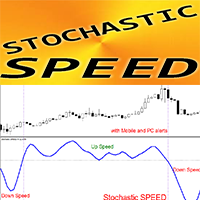
Forex Indicator "Stochastic Speed" for MT4 - great predictive tool! The calculation of this indicator is based on equations from physics . Stochastic Speed is the 1st derivative of Stochastic itself Stochastic Speed is great for scalping entries when stochastic is in Oversold/Overbought zone and Speed is making rebound hook (see pictures) It is recommended to use S tochastic Speed indicator for momentum trading strategies:
If S tochastic Speed is above 0 - this is positive sp
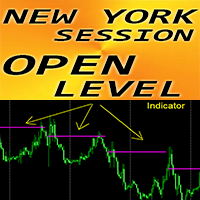
Forex Indicator "New York Session Open Level" for MT4 Indicator "New York Session Open Level" is very useful auxiliary indicator for intraday trading Session open price level is so important because very often price returns back to that area during the day. Indicator shows you NY session open price level daily for each day Also indicator shows week open level on Mondays It is useful for intraday traders to set up targets or use as support/resistance area. // More great Expert Advisors and In

FREE UNLIMITED PM : https://linktr.ee/ARFXAUTOTRADE?utm_source=linktree_admin_share
Trend Line is very useful for trader friends, both for mapping following trends and counter trends, here I am sharing an auto trend line indicator I made that you can use to make it easier for you to see the market.
How to use trend line:
01. Follow our trend, wait for the trend line to return and touch our trend line and form a continuation pattern on the candle stick 02. Counter Trend We wait for 1 ca
FREE
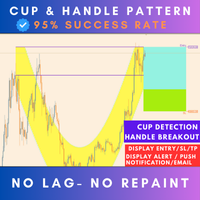
Live Trading Results MT5 Version Contact for Manual Guide Next Price $125 Free Scanner Dashboard (Contact me) Strategy - Breakout / Retest / Aggressive Hello Everyone, We are excited to introduce one of the most reliable and high win rate patterns in trading: the Cup and Handle . This is the first time we are releasing this meticulously crafted indicator, boasting an impressive 95% success rate . It is versatile and effective across all types of pairs, stocks, indices,

FREE UNLIMITED PM : https://linktr.ee/ARFXAUTOTRADE?utm_source=linktree_admin_share
Fibo Musang Break ReeTes is used as confirmation and mapping when making an entry, and generally this indicator will form when the candle makes a breakout (Mother candle or Snr). To make this indicator easier, I created an auto draw Fibo and I added a multi time frame function to the awesome oscillator indicator to make it easier to read trend verification using multi time monitoring.
The following are the
FREE
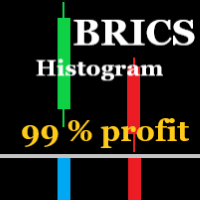
BRICS HISTOGRAMĂ Bun venit ! Cumpăra din bara albă a histogramei. Vindeți la bara galbenă a histogramei. Acest indicator este indicatorul săgeților BRICS transformat într-un indicator histogramă. Pe AUDCHF, GBPUSD, AUDJPY, NZDUSD, USDJPY funcționează foarte bine. Eu recomand – GBPUSD, M15, SL = 0 sâmburi, TP = 10 sâmburi minim. El funcționează în mod constant cu rezultate foarte bune. Alt Perechile pot da semnale mai rare sau pot avea unele pierderi sau nu funcționează. Indicatoare

"Trend Finder" is a trend trading strategy that combines market noise filtration and all necessary functions in one tool! The system automatically displays entry and exit points using arrows. Only one parameter is sufficient for configuration. It offers simple, intuitively understandable, and effective trend detection. The intelligent algorithm of the "Trend Finder" indicator identifies potential market reversal points. Often, a good trend can be visually observed on the price chart. However, a

The Tin indicator is designed to visually display the current trend in the market. One of the key aspects of foreign exchange market analysis is to determine the trend, which is the sustainable direction of price movement. To do this, the Tin indicator uses algorithms that smooth out sharp fluctuations that do not have a significant impact on the overall trend.
A trend can be either upward (bullish) or downward (bearish). Typically, a trend persists for a long time before abruptly changing di

Liquidity Pro The Liquidity Pro pin points liquidity zones in any financial instrument, including currency pairs, cryptocurrencies, commodities, equities and indices. The Liquidity Pro shows previous and current liquidity zones, down to the present minute, providing essential information about your chosen trading pair, when conducting chart analysis or initiating trades. Remember each trading pair requires a different price separation value for M5, M15 and M30 Tally, to provide accurate data. Y
L'indicateur calcule le delta, la différence de volumes de ticks entre les acheteurs et les vendeurs.
Affiche le déséquilibre des achats et des ventes sur le marché.
Le déséquilibre delta est un style de présentation spécial basé sur le rapport entre les volumes de l'offre et de la demande.
En utilisant l'indicateur en mode de trading réel, vous pouvez observer le comportement de l'humeur des principaux acteurs du marché, vous pouvez ainsi voir visuellement qui contrôle actuellement le p

Chart Clarity Dashboard The Chart Clarity Dashboard provides clear insights into price movements for various financial instruments like currency pairs, cryptocurrencies, equities, commodities, and indices. This dashboard displays detailed price information in real-time, making it easier for traders to make decisions quickly. It shows price movements down to the second, giving you essential data before you trade or analyze charts. Chart Clarity Dashboard allows you to monitor price changes acros

Backtest with good trend detection results from January 2023
EURUSD Time frame: m15, m30, H1
AUDUSD Time frame: m15, m30 NASDAQ Time frame: m15 S&P 500 Time frame: m15, m30 XAUUSD Time frame: m30 BTCUSD Time frame: H4
These are just some of the assets tested (Please note that past results are no guarantee of future results). Note that this is not a complete strategy, you can use this indicator as an entry trigger after your analysis by setting stop loss and take profit values that you d
Cumpără Vinde semnal M15
Bine ați revenit pe pagina noastră.
Cumpărați semnalul de vânzare Indicatorul M15 funcționează cel mai bine pe M15. Pe intervale mai lungi de timp, semnalele sunt mai rare.
Este un indicator de tip oscilator.
Aș recomanda o țintă de profit de 10 sâmburi sau la primul nivel de suport sau rezistență etc.
Poate fi folosit cu succes pe M5.
Feriți-vă de stop-loss. Ar trebui plasat astfel încât să nu fie lovit de mișcări aleatorii ale prețurilor.
Noroc!

Volume Clarity Pro The Volume Clarity Pro provides clarity in the movement of price for any financial instrument, including currency pairs, cryptocurrencies, equities, commodities and indices. The Volume Clarity Pro maps out where price is consolidating, retracing, resisting or settled in areas of support. The Volume Clarity Pro accurately displays the month's price action, offering crucial data about your selected trading pair for chart analysis and trade initiation. The Volume Clarity Pro is

The Your Honor trend indicator is based on price divergence and is designed to analyze and determine market entry points. It can also be used as a filter in trading. The indicator has only two parameters: Period and Level. The Level parameter helps eliminate unnecessary signals. For example, for EURUSD the Level can be set, for example, to 0.0001. Your Honor can be used to both identify entry points and filter signals. The indicator displays information in a clear manner. It is important to reme
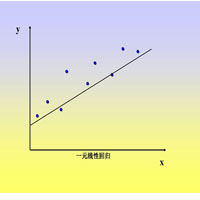
This index is used to calculate the linear regression slope of the K line in a period of time. The algorithm adopts the least square method.
1. Suitable for each cycle chart.
2. Can be used to calculate opening price, closing price, high price, low price, middle price.
3. Specify the start time and end time in the parameters.
Note that the start time and end time cannot be weekends, select the calculated price, pay attention to capital letters.
FREE
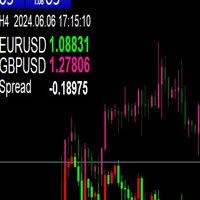
This indicator can be used to add a candle chart of another variety to the chart of the current variety.
1. The chart height will be adjusted automatically
2. If you switch the current icon period, the K of another variety will also switch to the corresponding period
3. In the upper left corner of the chart, the current cycle, the current time, and the current price and spread of the two targets will be displayed.
4. When switching cycle, due to a large number of data retrieval, it wi
FREE

The indicator is a set of parameters for setting three moving averages (fast, medium and slow), which can be used to analyze the market.
This indicator provides the ability to analyze market trends and make trading decisions based on the intersections of various moving averages. It also supports audio alerts for timely notification of trading signals.
LengthFaster: Sets the number of candles used to calculate the faster moving average. A value of 5 means using price data from the last 5 can
This indicator implements the following idea: if the current closing price (or the current average price) overcomes the smoothed value of the minimum/maximum prices for the selected period, this indicates a change in trend. The indicator effectively follows price movements in trending areas of the market and clearly demonstrates areas of sideways price movement. The product can be useful for both beginners and experienced traders as it is easy to use and intuitive. The indicator allows you to se

RSI With Alert
Relative strength index (RSI) indicator is a popular technical indicator in the family of oscillators.
RSI oscillates between 0 and 100 and traders use it to spot overbought and oversold states in the market.
Typically, a value above 70 means that the instrument is overbought and due to a retracement. A value below 30 means that the trading instrument is oversold.
RSI indicator strategies
This indicator allows you to get notifications when some conditions trigger. You c
FREE
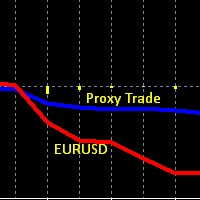
This is an obscure Hedge Fund like strategy, based one of our early indicators on EURUSD originally intended for day trading, while developing and testing the indicator we found out that the data used in this indicator (set of 4 currency pairs) follows EURUSD in a very peculiar way. On one hand these two are correlated, but the 4 currency proxy set tends to lag behind EURUSD, it lags on a day to day basis, and then catches up eventually after several days. And therefore can be used as a proxy

YK-Fibo Pivot Indicator: Trade Smarter with Fibonacci Pivot Points The YK-Fibo Pivot Indicator is a powerful technical analysis tool that combines the precision of Fibonacci retracements with the insights of Pivot Points. Whether you're a novice or seasoned trader, this indicator empowers you to spot profitable opportunities in the market with ease. Why Choose YK-Fibo Pivot? Pinpoint Support & Resistance: By calculating Fibonacci levels based on the previous day's high, low, and close prices, y

Introducing Smart Gold Pro, a versatile trading indicator suitable for all experience levels. It provides precise buy and sell signals for the gold market, adaptable to any timeframe. Powered by advanced algorithms, Smart Gold Pro accurately analyzes price movements and volume dynamics. What sets Smart Gold Pro apart is its reliability—it doesn't repaint past signals, ensuring dependable insights into potential market reversals. Its user-friendly visual interface on the chart, along with audible
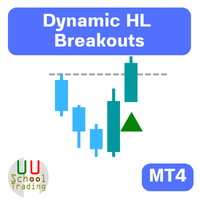
Description of Using the Dynamic HL Breakouts Indicator The Dynamic HL Breakouts indicator is a technical tool designed for trading trend-following assets. Its main purpose is to help traders identify key entry and exit points during strong trending periods of an asset. Components of the Dynamic HL Breakouts Indicator Highs and Lows This indicator calculates and displays the High and Low values for a specified period (e.g., the past 20 days) to create a price movement range for the asset. These

* Pivot Points Magic : Effortlessly Plot Pivot Levels on Any Chart**
Pivot Points Magic simplifies the process of identifying critical pivot levels on any chart, across all timeframes. With just a few clicks, traders can instantly visualize pivot points, enabling them to make more informed trading decisions.
We value your feedback! Share your experience with Pivot Points Magic and help us improve. Your reviews and suggestions are essential for shaping future updates and enhancements to the

The RPO (Relative Price Oscillator) is a technical analysis indicator used in Forex trading to measure the momentum and trend strength of a currency pair. It is derived from the Relative Strength Index (RSI) but focuses on the difference between two moving averages of price, usually the closing price, over different periods. The RPO is similar to the MACD (Moving Average Convergence Divergence) but uses relative price levels instead of absolute price levels. Key Components: Short-Term Moving Ave

Description of Fibonacci Levels for Support and Resistance (SNR) with a Statistical Model Fibonacci levels are widely used in technical analysis to identify potential support and resistance levels in financial markets. These levels are derived from the Fibonacci sequence, a mathematical sequence where each number is the sum of the two preceding ones. The key Fibonacci retracement levels are 23.6%, 38.2%, 50%, 61.8%, and 100%.
Cet outil puissant identifie automatiquement les lignes de tendance, vous aidant à rationaliser votre stratégie de trading et à prendre des décisions plus éclairées. Version MT5
Fonctionnalités clés Détection automatique des lignes de tendance : L'indicateur "Basic Trendline" scanne le marché des lignes de tendance potentielles et les affiche instantanément sur votre graphique.Cela vous fait gagner un temps précieux et vous assure de ne jamais manquer une tendance importante. Panneau convivial
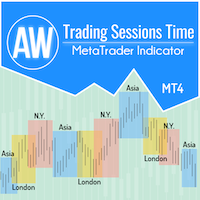
Pour permettre aux traders d'obtenir des données sur les performances des marchés et de mieux formuler des stratégies de trading, nous avons développé un indicateur de séance de trading. Les heures d'ouverture des différentes bourses affectent les transactions car elles affectent l'activité du marché et les volumes de transactions. Ces facteurs déterminent la volatilité et les opportunités de trading des différents instruments. L'indicateur AW Trading Sessions Time affiche les heures de négocia
FREE
WONNFX iN M5 - Arrow indicator for Forex and Binary Options. Reliable signal algorithm. Indicator not repaint. Indicator working hours: 21:55-23:00. GMT+2. Average winrate = 60-70%.
Recommendations: Timeframe: M5. Expiration: 2-3 candles (1 candle = 5 minutes) Symbol: EURUSD, USDJPY, EURAUD, GBPAUD, EURJPY, AUDUSD, USDCAD, NZDUSD, AUDCAD, AUDCHF, AUDJPY, AUDNZD, CADJPY, EURCAD, EURGBP, GBPUSD, GBPCAD, NZDJPY, CADJPY, XAUUSD
FREE

Indicateur BRICS
Bienvenue sur notre page !
Achetez à la flèche blanche. Vendez à la flèche jaune.
C'est très simplu.
Je n'entrerai pas dans les détails.
Je suis sûr que vous avez suffisamment d'expérience et de connaissances.
Je pense que les images ci-jointes montrent très clairement la puissance de cet indicateur.
Sur AUDCHF, GBPUSD, AUDJPY, NZDUSD, cela fonctionne très bien.
Il se peut que sur d'autres paires cela donne des signaux plus rares ou qu'il y ait une certaine pert

Introducing our exciting new Price Retest indicator! Get instant alerts when the price retests, giving you a powerful edge in your trading strategy. Remember to do your own analysis before making any moves in the market. MT5 Version - https://www.mql5.com/en/market/product/118159/ Here’s a detailed explanation of how the Price Retest indicator works, its components, and how you can incorporate it into your trading strategy: The Price Retest indicator is designed to notify traders when the pric
FREE

Renko Masterx est un indicateur de type flèche mt4 conçu pour échanger des graphiques renko, cet indicateur dispose d'un tableau de bord de backtesting qui indique au trader des informations utiles telles que le taux de victoire et les points gagnés, il donne également tp et sl dans la multiplication atr x, cet indicateur donne son signal sur barre ouverte ou intra barre, et il a un marqueur blanc qui marquera le prix exact où le signal a été donné, la façon d'utiliser cet indicateur est d'ouvr

Spider renko arrow est un indicateur de flèche basé sur le renko qui donne un signal sur la barre ouverte/intra et utilise 2 stratégies pour tracer le signal. Cet indicateur peut être utilisé pour scalper une barre TP ou pour balancer des transactions s'il est utilisé avec des périodes plus élevées dans ses paramètres. Cet indicateur ne repeint jamais et ne peint jamais. =================================================== ======= Paramètres : Période d'entrée : période du signal principal Pério

Binary atm est un indicateur de signaux d’options binaires basé sur 2 pièces, la première est sous la forme d’une ligne colorée qui indique la direction de la tendance et dicte les ventes sur les achats uniquement, la seconde est un signal d’entrée en forme de point qui vient sur BAR OPEN et ne se repeint jamais et n’est pas retardé.
MODE D’EMPLOI :
Attendez qu’un point de vente apparaisse sur la barre ouverte Si la barre précédente avait une couleur de ligne de vente que d’ouvrir une vente

We have combined all of our beloved indicators the likes of: Key level order block , Key level supply and demand , Key level liquidity grab and Key level wedge into one single indicator and dashboard.
Whats new Dashboard : There is an easy access dashboard for all your needs. Multi-timeframe button : There is now a multi-timeframe option for Order Blocks and Supply and demand zones, making it easy to see higher timeframe zones easily on the current timeframe by just clicking the desired timefr
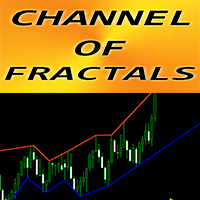
Forex Indicator "CHANNEL of FRACTALS" for MT4 This indicator is showing actual local Trend lines based on Highs/Lows of Fractals Great for traders who use Graphical Analysis Resistance local trend lines - Red color Support l ocal trend lines - Blue color It has few parameters responsible for number of fractals, trend line colors and width // More great Expert Advisors and Indicators are available here: https://www.mql5.com/en/users/def1380/seller // Also you are welcome to join to pro

Forex Indicator " Hanging Man pattern" for MT4 Indicator " Hanging Man pattern " is very powerful indicator for Price Action trading: No repaint, No delays; Indicator detects bearish Hanging Man patterns on chart: Red arrow signal on chart (see pictures) PC, Mobile & Email alerts are included Indicator "Hanging Man pattern" is excellent to combine with Support/Resistance Levels : https://www.mql5.com/en/market/product/100903 // More great Expert Advisors and Indicators are available he
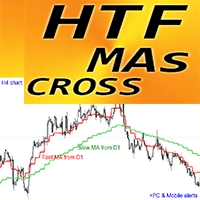
Forex Indicator "HTF Moving Averages Cross" for MT4 Upgrade your trading methods with the powerful HTF Moving Averages Cross indicator for MT4. H TF means - H igher Time Frame This indicator is excellent for Trend Traders with Price Action entries. It allows you to attach Fast and Slow Moving Averages from Higher time frame to your current chart --> this is professional method. HTF MAs CROSS has built-in Mobile and PC alerts
This indicator gives opportunity to get decent pro
Engulfing Candle Signal Alert: Elevate Your Trading Strategy Unlock the full potential of your trading with the Engulfing Candle Signal Alert, the ultimate tool for identifying market reversals and enhancing your trading precision. Designed specifically for traders who value accuracy and timely alerts, this powerful indicator detects engulfing candle patterns, a key signal in technical analysis that often indicates a potential shift in market direction. What is an Engulfing Candle? An engu
FREE

Advantages of the Tick Volume Indicator: Identifying Market Sentiment : A predominance of green bars on the histogram may indicate an uptrend or strong buying pressure, useful for determining entry points for long positions. A predominance of red bars indicates a downtrend or strong selling pressure, useful for determining entry points for short positions. Analyzing Market Activity : The indicator helps identify periods of high activity, when significant changes are occurring in the market, and
FREE UNLIMITED PM : https://linktr.ee/ARFXAUTOTRADE?utm_source=linktree_admin_share
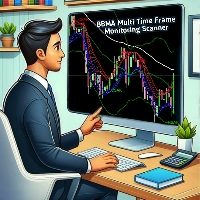
This BBMA FULL SETUP Scanner indicator is based on Multi Time Frame Monitoring and can be used for direct entry when a signal appears. Rules for Using Indicators: 1. Wait for Full Setup BBMA / EMA 50 Cross Mid BB 20 2. Wait for Reentry / Reetes CANDLE when CSAK / CSM occurs 3. Stop Loss Candle CSAK / CSM is formed 4. Take Profit = 2-5 x Stop Loss Distance If you want to use this indicator for free and unlimit
FREE
Elegant RSI indicator can generate RSI divergence with the availability of user defined filters. It can generate voice alerts for RSI oversold and RSI Overbought situations. Moreover it can also generate voice alerts for RSI Divergneces as well as when price breaks above or breaks below the support and resistances created upon divergence ouccurence. The voice alerts are generated in a way that you will know which market has reached the oversold and overbought conditions as well as the rsi Dive
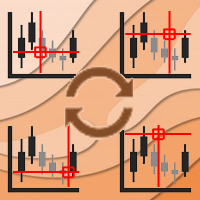
Async Charts is an indicator to synchronize charts and display a customized crosshair (cursor) on all selected charts. This is a useful utility for traders using multiple timeframes of analyzing multiple symbols for trade entry or exit.
Main Features : Real time Crosshair Synchronization on All Selected Charts
Supports Multiple Timeframes and Multiple Symbols at the same time
Auto Scroll Option
Graphical Adjustment of Color, Font, Size, ...
Locking All or Locking Specific Charts
More and

FREE UNLIMITED PM : https://linktr.ee/ARFXAUTOTRADE?utm_source=linktree_admin_share
Bagaimana Cara membaca market melalui FMCBR-W - Didalam dunia trading ini pelbagai cara digunakan oleh trader dan penganalisa market membaca dan memahami trend. - Dari sudut FMCBR permulaan trend atau permulaan pullback dikenali melalui CB1. Apa pun dari sudut FMCBR-W trend didefinasikan melalui 3 combinasi yang saya akan kupas di muka surat seterusnya nanti. - Saya amat berharap agar pengunaan FMCBR-W nanti
FREE
Sync Cursor MT4 Sync Cursor MT5 https://www.mql5.com/en/market/product/118259 MT4 Tool will It make the Horizontal Line + Vertical Line in the Screen That it is always present on the screen and that it moves along with the candle (with the price). I am sure that something so simple will be a Treasure in the hands of many people. Some of my personal trades are posted voluntary and free of charge in this Public channel https://t.me/FXScalpingPro Contact: https://t.me/TuanNguyenTrader
FREE

The Awesome ATR Indicator is a technical analysis tool developed for the MetaTrader 4 (MT4) platform. This indicator is designed to assist traders in determining stop loss and take profit levels based on the average value of the Average True Range (ATR). By leveraging the market volatility data provided by ATR, this indicator offers more accurate and dynamic guidance in setting these crucial trading levels. Key Features: Dynamic Stop Loss Determination: Calculates stop loss levels based on the A
FREE
ダイバージェンス はオシレーター系のテクニカル指標が、実際の相場とは逆方向に向かって動いている状態のことを指し、その後のトレンド転換の可能性を示す戦略として有効です。
このインディケータは特に有効性の高いMACDのダイバージェンスを利用した 裁量トレード用サインツールです。
高頻度かつ高い 勝率で サインを発信しますが、各種の強力なフィルターにより、さらに精度の高いサインに絞ることが出来ます。また、通常のダイバージェンスに加えリバーサル( 隠れダイバージェンス) によるサイン発信も可能です。
全通貨ペア、全タイムフレームで利用できます。勝敗判定機能により、このインディケータの直近の相場環境に対する有効性を確認できます。
設定項目は以下の通りです。 Enable Divergence...MACDのDivergenceによるサインの発信を有効にします。ピンクの矢印が表示されます Enable Reversal...MACDのReversal(Hidden Divergence)によるサインの発信を有効にします 。ブルーの矢印が表示されます Fast EMA Pe

Using this indicator, you can see the moving average of 7 time frames in (one time frame) the same time frame you are.
You can also set orders to enter buy or sell positions automatically when the price hits Moving.
You can also set orders to risk free or close existing positions when the price hits Moving.
Also, receive a notification on your mobile phone when the price hits Moving.or position will be risk free or close .

PTW NON REPAINT TRADING SYSTEM + HISTOGRAM Non-Repainting , Non-Redrawing and Non-Lagging Trading System.
Does the following: - Gives Accurate Entry and Exit Points - Scalping, Day and Swing Trading - 95% Accuracy - Targets, where to take profits. - Shows Trends, Support and resistance levels - Works on All Brokers - Works on All Currencies, CFDs and Stocks - It does not place trades for you, it only shows you what trades to place. - It works on All Timeframes - It is for Trend or ra

POWER TO GET WEALTHY TRADING SYSTEMS.
NON REPAINT REVERSAL ARROW AND CHANNEL Intra-Day trading and Scalping Strategy: Designed for fast and accurate day trading and short-term trades.
Day and Swing Trading Strategy: Can be used as a reliable tool for day and swing traders who aim for the big moves of the price.
Multi Currencies and Markets: Works on different instruments and markets with its reliable precision.
Multi Timeframes: Can be used on multiple timeframes with good perfor

Trading Dashboard is a useful tool for your multiple trades. It contain information such as : - Breakeven point(price) of your multiple trades, - Loss point(price) of your trades, - Current Trading Day and Session, - Current Time and time left of candles, - Total Lot Buy & Sell, and sum of it - Spread and ATR of current time frame and symbol - Profit-Loss in percentage of your open trade

Manual guide: Click here WEEK SALE PROMO: $59 ONLY! -- Next price is $120 .
This indicator is unstoppable when combined with our other indicator called Support & Resistance . After purchase, send us a message and you will get it for FREE as a BONUS! I like to use Trend Punch on XAUUSD on the M1 timeframe & higher ones! Introducing Trend Punch , the revolutionary forex trend indicator that will transform the way you trade! Trend Punch is uniquely designed to provide pre

Fractals Dynamic Fractals Dynamic – est un indicateur fractal gratuit modifié par Bill Williams, dans lequel vous pouvez définir manuellement le nombre de barres à gauche et à droite, créant ainsi des modèles uniques sur le graphique. Désormais, toutes les stratégies de trading basées sur ou basées sur l'indicateur Fractals Dynamic auront un signal supplémentaire.
De plus, les fractales peuvent agir comme niveaux de support et de résistance. Et dans certaines stratégies de trading, affichez
FREE
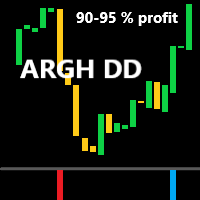
ARGH DD indicateur d'achat et de vente
Cet indicateur est un indicateur d'histogramme.
C’est un indicateur puissant et précis avec très peu de faux positifs.
Les transactions qu'ils déclenchent durent des jours ou des semaines.
Mais ce sont des transactions très stables.
Bien entendu, les règles d’entrée sont très simples :
️ la barre bleue de l'histogramme indique l'ouverture d'une position d'achat ;
️ la barre d'histogramme rouge indique l'ouverture d'une position de vente.

Market Noise Le bruit du marché est un indicateur qui détermine les phases du marché sur un graphique de prix et distingue également les mouvements de tendance clairs et fluides des mouvements plats et bruyants lorsqu'une phase d'accumulation ou de distribution se produit. Chaque phase est bonne pour son propre type de trading : tendance pour les systèmes qui suivent les tendances et plate pour les systèmes agressifs. Lorsque le bruit du marché commence, vous pouvez décider de quitter les trans

L'indicateur LEVELSS montre :
- Les zones haussières et baissières quotidiennes. Elle est visible tous les jours de 00h00 à 23h59. - La zone haussière et baissière hebdomadaire. Elle est visible du lundi 0:00 au vendredi 23:59 chaque semaine. - Canal spécialement calculé à partir d'un timeframe spécifique qui est affiché sur tous les autres timeframes. Par défaut, il s'agit de l'échelle de temps de 4 heures que vous pouvez changer pour l'échelle de temps de votre choix. Il est calculé en con

Notre indicateur Basic Support and Resistance est la solution dont vous avez besoin pour augmenter votre analyse technique.Cet indicateur vous permet de projeter les niveaux de support et de résistance sur le graphique / Version MT5
Caractéristiques
Intégration des niveaux de Fibonacci: avec la possibilité d'afficher les niveaux de Fibonacci aux côtés des niveaux de support et de résistance, notre indicateur vous donne un aperçu encore plus profond du comportement du marché et des zones d'in
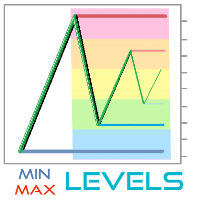
MinMax Levels MinMax Levels – est un indicateur des niveaux de prix maximum, minimum et d'ouverture pour les périodes de négociation importantes : jour, semaine et mois.
Chaque acteur du marché Forex utilise des niveaux dans son système commercial. Ils peuvent être soit le signal principal pour effectuer des transactions, soit un signal supplémentaire, agissant comme un outil analytique. Dans cet indicateur, les jours, les semaines et les mois ont été sélectionnés comme périodes importante

Le BMW M5 est un indicateur à haute vitesse conçu pour le scalping, offrant des signaux extrêmement précis et rapides pour les changements de direction des prix sur n'importe quelle unité de temps, y compris les plus petites : M1 et M5. Il fonctionne avec toutes les paires de devises, permettant aux traders d'analyser le marché en utilisant un système de trading scalping intraday. En opérant sur les unités de temps M1 et M5, il fournit aux traders des dizaines de signaux d'entrée chaque jour. Re
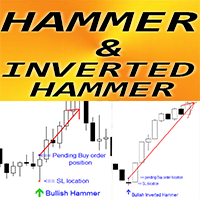
Forex Indicator " Hammer and Inverted Hammer pattern" for MT4 Indicator " Hammer and Inverted Hammer pattern " is very powerful indicator for Price Action trading : No repaint, No delays; Indicator detects bullish Inverted Hammer and Hammer patterns on chart: Bullish Inverted Hammer - Blue arrow signal on chart (see pictures) Bullish Hammer - Green arrow signal on chart (see pictures) P C, Mobile & Email alerts are included Indicator " Hammer and Inverted Hammer pattern
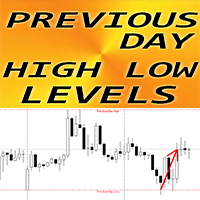
Forex Indicator "Previous Day High Low levels" for MT4 Indicator "Previous Day High Low levels" is very useful auxiliary indicator Yesterday High and Low levels are so important because price very often rebounds from them These levels can be considered as reliable Support and Resistance - price respects them very much It is useful indicator for intraday traders to who use Reversal trading methods and scalping Very good to combine with Price Action as well // More great Expert Advisors and I

Forex Indicator " ATR Trailing Stop" for MT4 Upgrade your trading methods with great auxiliary ATR Trailing Stop indicator for MT4. This indicator is perfect for Trailing Stop purpose ATR Trailing Stop is automatically adaptive to market volatility No delays and easy set up This indicator is excellent to combine with price action entries into the direction of main trend // More great Expert Advisors and Indicators are available here: https://www.mql5.com/en/users/def1380/seller //
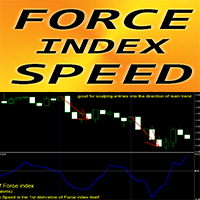
Forex Indicator " Force index Speed" for MT4 The calculation of this indicator is based on equations from physics. Force index Speed is the 1st derivative of Force index itself F orce index is one of the top indicators that combines price and volume data into a single value Force index Speed is good for scalping entries into the direction of main trend: u se it in combination with any suitable trend indicator Force index Speed indicator shows how fast Force index itself changes its d

The Channel Scalper Pro Indicator is a highly efficient tool for market analysis based on price channels and signal arrows. This indicator is designed for the MetaTrader 4 (MT4) platform. It utilizes a combination of channels and visual signals to provide fairly accurate entry and exit points in the market. Below is a detailed description of the indicator, its functionalities, and usage strategies. Technical Description Channels: The channels presented by the indicator display the upper and lowe

Interceptor - an arrow indicator shows potential market entry points in the form of arrows of the corresponding color: up arrows (blue) suggest opening a buy, down arrows (red) suggest selling. The appearance of arrows may be accompanied by sound signals if the sound option is enabled. It is assumed to enter on the next bar after the indicator, but there may be non-standard recommendations for each strategy. Interceptor visually “unloads” the price chart and saves analysis time: no signal - no d

GAP DETECTOR
FVG in trading refers to "Fair Value Gap", . It is a concept used in technical analysis to identify areas on a price chart where there is a discrepancy or gap between supply and demand. These gaps can occur due to rapid movements in price, usually as a result of important news or economic events, and are usually filled later as the market stabilizes. The GAP DETECTOR indicator is designed to identify fair value gaps (FVG) on the price chart and filter them using volatility to det
FREE
Le MetaTrader Market offre un lieu pratique et sécurisé pour acheter des applications pour la plateforme MetaTrader. Téléchargez des versions démo gratuites de Expert Advisors et des indicateurs directement depuis votre terminal pour les tester dans le testeur de stratégie.
Testez les applications dans différents modes pour surveiller les performances et effectuez un paiement pour le produit que vous souhaitez en utilisant le système de paiement MQL5.community.
Vous manquez des opportunités de trading :
- Applications de trading gratuites
- Plus de 8 000 signaux à copier
- Actualités économiques pour explorer les marchés financiers
Inscription
Se connecter
Si vous n'avez pas de compte, veuillez vous inscrire
Autorisez l'utilisation de cookies pour vous connecter au site Web MQL5.com.
Veuillez activer les paramètres nécessaires dans votre navigateur, sinon vous ne pourrez pas vous connecter.