
Decoding Opening Range Breakout Intraday Trading Strategies
Introduction
Opening Range Breakout (ORB) strategies are built on the idea that the initial trading range established shortly after the market opens reflects significant price levels where buyers and sellers agree on value. By identifying breakouts above or below a certain range, traders can capitalize on the momentum that often follows as the market direction becomes clearer.
In this article, we will explore three ORB strategies adapted from the Concretum Group papers. First, we will cover the research background, including key concepts and the methodology used. Then, for each strategy, we will explain how they work, list their signal rules, and analyze their performance statistically. Finally, we will examine them from a portfolio perspective, focusing on the topic of diversification.
This article will not dive deep into programming but instead concentrates on the research process, including recreating, analyzing, and testing the strategies from these three papers. This will be suitable for readers looking for potential trading edges or who are curious about how these strategies were studied and replicated. Nevertheless, all the MQL5 code for the EAs will be disclosed. Readers are welcome to build upon the framework by themselves.
Research Background
This section covers the research methodology we will use to analyze the strategies, along with key concepts that will come up later in the article.
The Concretum Group is one of the few academic research teams developing intraday trading strategies. In the studies we are adapting, they focus on strategies that trade between market open and close (9:30 AM to 4:00 PM Eastern Time). Since our broker uses UTC+2/3, this translates to 18:30-24:00 server time—make sure to adjust for your own broker's time zone when testing.
The original research trades QQQ, an ETF tracking the Nasdaq-100 index. It is important to note that the Nasdaq-100 represents the performance of 100 large tech-focused companies on the Nasdaq exchange. The index itself is actually not tradable, only its derivatives are. QQQ lets investors gain exposure to these companies through a single share. For our tests, we will trade USTEC (a CFD on the Nasdaq-100), which allows speculation on price movements without owning the underlying assets, often using leverage to magnify gains or losses.
We will introduce two key metrics in this article: alpha and beta. In trading, alpha represents the excess return an investment generates compared to a benchmark like a market index. It shows whether the investment outperforms expectations and essentially reflects edge. Beta measures an investment's sensitivity to market movements. A beta of 1 means it mirrors the market’s fluctuations. A value above 1 indicates greater volatility while a value below 1 suggests less volatility. These metrics are essential for understanding how much your strategy relies on market trends versus its unique edge. This knowledge helps you assess potential directional bias in trending assets such as indices or cryptocurrencies.
Alpha and beta are calculated as follows:

Ri is the investment return, Rf is the risk-free rate often based on treasury yield or ignored, and Rm is the market return. Covariance and variance are typically calculated using daily period returns.
A key indicator that will be used later in this article is Volume Weighted Average Price(VWAP). It is calculated as :

The intuition behind VWAP is to measure the average price a security trades at, weighted by volume, reflecting the "true" cost of trading over a period. Unlike a simple average, it gives more weight to prices with higher trading activity, making it a fairer benchmark.
Its common uses in algorithmic trading include:
- Using it to as a trend filter.
- Using it as a trailing stop.
- Using it as a signal generator (e.g. enter upon price crossing VWAP).
We usually begin calculating VWAP from the first candle at market open. In the equation above, Pi represents the ith candle's price, typically the close, and Vi is the ith candle's trading volume. Trading volume can vary between CFD brokers due to different liquidity providers, but the relative weighting should generally be consistent across brokers.
This article implements the leverage space risk model. This method risks a set percentage of our balance per trade, triggered when the stop loss is hit. The stop loss range will be a fixed percentage of the asset price to align with its changing value and volatility. The risk per trade will be set using round numbers to target a maximum drawdown of about 20% for simplicity. We will test each strategy over a five-year period from January 1, 2020, to January 1, 2025, to collect enough recent data to evaluate current profitability. Thorough statistical analysis will include comparisons with buy-and-hold based on cumulative percentage gains and individual performance metrics.
Strategy One: Opening Candle Direction
The first strategy we will look at is a classic opening breakout strategy introduced in the paper Can Day Trading Really Be Profitable? by the Concretum Group. The motivation behind the strategy signal rules is rooted in capturing short-term price momentum while balancing practicality and risk management for day traders. The authors chose the ORB approach to exploit the heightened volatility and directional momentum often observed at the market open. This period is seen as a critical window where institutional activity is often exposed, and retail traders can use the price direction of this period as an indication for determining the trend for the whole day.
After reviewing the paper, we identified several ways to enhance the original strategy. The original approach used the first five-minute candle's high or low as the stop loss and a 10R take profit. While profitable, this method was impractical for retail traders in live trading. The tight stop loss from the first five-minute candle increased relative trading costs. Additionally, the 10R take profit was unnecessary since we close all trades by the end of the day, and it was rarely reached. Finally, the original strategy lacked a regime filter, so adding a moving average could improve it by serving as a regime filter.
Our modified signal rules are as followed:
- Five minutes after market open, buy if the opening five-minute candle is bullish and its close is above the 350-period moving average.
- Five minutes after market open, sell if the opening five-minute candle is bearish and its close is below the 350-period moving average.
- Five minutes before market close, exit existing positions.
- Stop loss set at 1% of price from the entry level.
- 2% risk per trade.
Full MQL5 code for the EA:
//USTEC-M5 #include <Trade/Trade.mqh> CTrade trade; input int startHour = 18; input int startMinute = 35; input int endHour = 23; input int endMinute = 55; input double risk = 2.0; input double slp = 0.01; input int MaPeriods = 350; input int Magic = 0; int barsTotal = 0; int handleMa; double lastClose=0; double lastOpen = 0; double lot = 0.1; //+------------------------------------------------------------------+ //|Initialization function | //+------------------------------------------------------------------+ int OnInit() { trade.SetExpertMagicNumber(Magic); handleMa = iMA(_Symbol,PERIOD_CURRENT,MaPeriods,0,MODE_SMA,PRICE_CLOSE); return(INIT_SUCCEEDED); } //+------------------------------------------------------------------+ //|Deinitialization function | //+------------------------------------------------------------------+ void OnDeinit(const int reason) { } //+------------------------------------------------------------------+ //|On tick function | //+------------------------------------------------------------------+ void OnTick() { int bars = iBars(_Symbol, PERIOD_CURRENT); if(barsTotal != bars){ barsTotal=bars; double ma[]; CopyBuffer(handleMa,0,1,1,ma); if(MarketOpen()){ lastClose = iClose(_Symbol,PERIOD_CURRENT,1); lastOpen = iOpen(_Symbol,PERIOD_CURRENT,1); if(lastClose<lastOpen&&lastClose<ma[0])executeSell(); if (lastClose>lastOpen&&lastClose>ma[0]) executeBuy(); } if(MarketClose()){ for(int i = PositionsTotal()-1; i>=0; i--){ ulong pos = PositionGetTicket(i); string symboll = PositionGetSymbol(i); if(PositionGetInteger(POSITION_MAGIC) == Magic&&symboll== _Symbol)trade.PositionClose(pos); } } } } //+------------------------------------------------------------------+ //| Detect if market is opened | //+------------------------------------------------------------------+ bool MarketOpen() { datetime currentTime = TimeTradeServer(); MqlDateTime timeStruct; TimeToStruct(currentTime, timeStruct); int currentHour = timeStruct.hour; int currentMinute = timeStruct.min; if (currentHour == startHour &¤tMinute==startMinute)return true; else return false; } //+------------------------------------------------------------------+ //| Detect if market is closed | //+------------------------------------------------------------------+ bool MarketClose() { datetime currentTime = TimeTradeServer(); MqlDateTime timeStruct; TimeToStruct(currentTime, timeStruct); int currentHour = timeStruct.hour; int currentMinute = timeStruct.min; if (currentHour == endHour && currentMinute == endMinute)return true; else return false; } //+------------------------------------------------------------------+ //| Sell execution function | //+------------------------------------------------------------------+ void executeSell() { double bid = SymbolInfoDouble(_Symbol, SYMBOL_BID); bid = NormalizeDouble(bid,_Digits); double sl = bid*(1+slp); sl = NormalizeDouble(sl, _Digits); lot = calclots(bid*slp); trade.Sell(lot,_Symbol,bid,sl); } //+------------------------------------------------------------------+ //| Buy execution function | //+------------------------------------------------------------------+ void executeBuy() { double ask = SymbolInfoDouble(_Symbol, SYMBOL_ASK); ask = NormalizeDouble(ask,_Digits); double sl = ask*(1-slp); sl = NormalizeDouble(sl, _Digits); lot = calclots(ask*slp); trade.Buy(lot,_Symbol,ask,sl); } //+------------------------------------------------------------------+ //| Calculate lot size based on risk and stop loss range | //+------------------------------------------------------------------+ double calclots(double slpoints) { double riskAmount = AccountInfoDouble(ACCOUNT_BALANCE) * risk / 100; double ticksize = SymbolInfoDouble(_Symbol, SYMBOL_TRADE_TICK_SIZE); double tickvalue = SymbolInfoDouble(_Symbol, SYMBOL_TRADE_TICK_VALUE); double lotstep = SymbolInfoDouble(_Symbol, SYMBOL_VOLUME_STEP); double moneyperlotstep = slpoints / ticksize * tickvalue * lotstep; double lots = MathFloor(riskAmount / moneyperlotstep) * lotstep; lots = MathMin(lots, SymbolInfoDouble(_Symbol, SYMBOL_VOLUME_MAX)); lots = MathMax(lots, SymbolInfoDouble(_Symbol, SYMBOL_VOLUME_MIN)); return lots; }
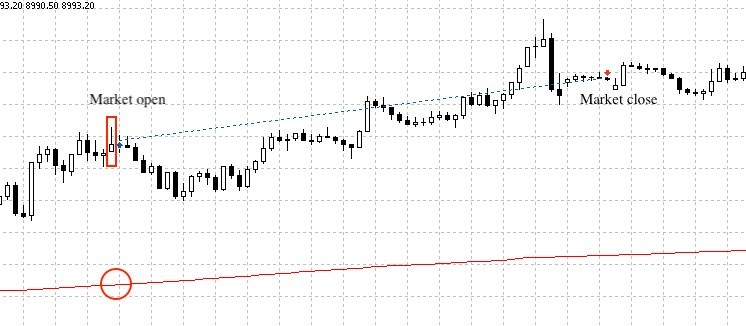
A typical trade would look like this:
Backtest Results:
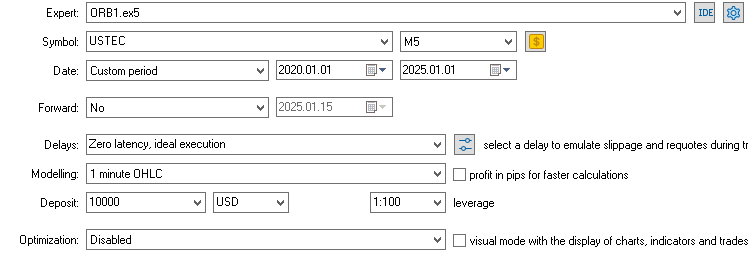

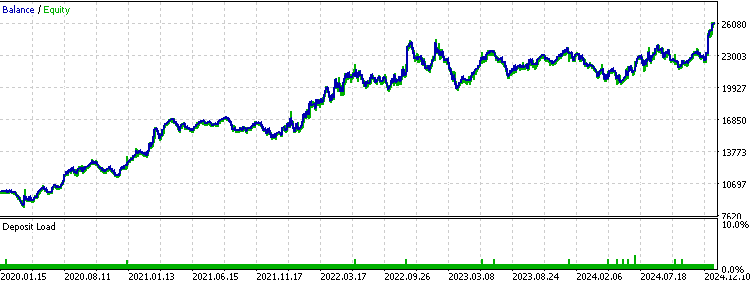
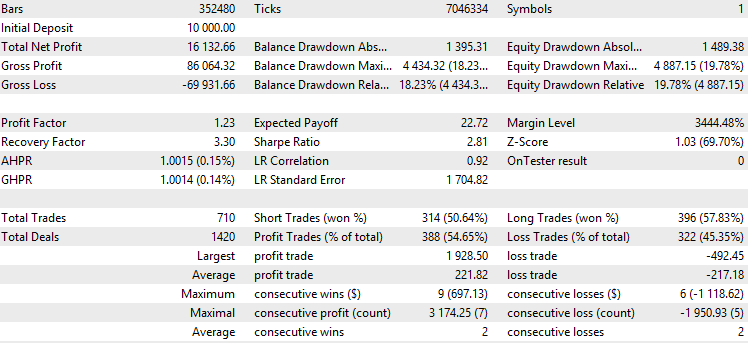
Without the moving average filter, the original strategy rules would generate one trade every trading day. The filter reduced the trades by half. Since the average holding period spans the entire trading session, the results somewhat reflect the macro trend, with long trades occurring more frequently and having a higher win rate. Overall, the strategy achieves a 1.23 profit factor and a Sharpe ratio of 2.81, reflecting strong performance. These simple rules are less prone to overfitting, suggesting that solid backtest results are likely to hold in live trading.
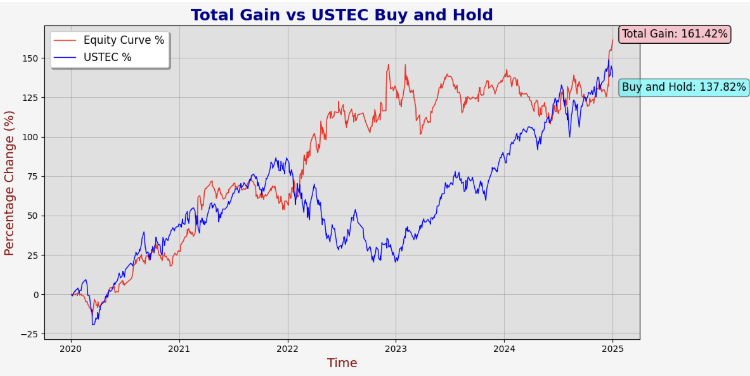
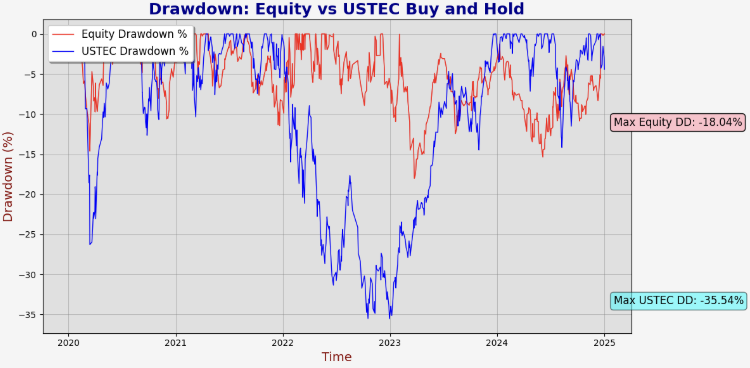
The EA impressively outperforms the buy-and-hold approach for USTEC over this five-year period while keeping the maximum drawdown at 18%, half that of the benchmark. The equity curve remains smooth, with only a brief stagnation from late 2022 to early 2023, a time when USTEC faced a larger drawdown.


Alpha: 1.6017
Beta: 0.0090
A beta of 0.9% shows the daily return has just a 0.9% correlation with the underlying asset, indicating the strategy’s edge comes primarily from its rules rather than market trends. Drawdowns and returns stay consistent, suggesting resilience against extreme regime periods like the 2020 COVID crash. Most months are profitable, and drawdown months are mild, with the worst at 10.2%. Overall, this is a tradable and profitable strategy.
Strategy Two: VWAP Trend Following
The second strategy we will look at is more of a market-open trend-following strategy introduced in the paper Volume Weighted Average Price (VWAP) The Holy Grail for Day Trading Systems. The motivation behind the signal rules in is to leverage VWAP as a clear, volume-weighted benchmark for identifying intraday trends. A long position is triggered when the price closes above VWAP, and a short position when it closes below, aiming to capture confirmed momentum while filtering out noise. This simplicity ensures actionable, reproducible signals for day traders. This classic trend-following approach performs best in high-volatility conditions, capturing long-moving trends and yielding high reward-to-risk profits. During the five hours the stock market is open, the index experiences significant movement, providing excellent time-based liquidity for the strategy to succeed.
The original paper traded on a one-minute timeframe, claiming it was the most effective among various timeframes. However, my personal testing revealed that a 15-minute timeframe works better for this strategy, likely due to the higher trading costs of CFDs compared to ETFs, which make frequent trading less viable. The paper also omitted a stop loss. In our approach, we will include one since we’re using a higher timeframe. This addition serves as accident protection and provides a reference range for calculating risks. Lastly, we added a moving average trend filter like what we did before.
Our modified signal rules are as followed:
- After the market opens, buy if no current position is opened and the last 15-minute close is above VWAP and 300-period moving average.
- After the market opens, sell if no current position is opened and the last 15-minute close is below VWAP and 300-period moving average.
- Stop loss set at 0.8% of price from the entry level.
- 2% risk per trade.
The full MQL5 code for the EA:
//USTEC-M15 #include <Trade/Trade.mqh> CTrade trade; input int startHour = 18; input int startMinute = 35; input int endHour = 23; input int endMinute = 45; input double risk = 2.0; input double slp = 0.008; input int MaPeriods = 300; input int Magic = 0; int barsTotal = 0; int handleMa; double lastClose=0; double lot = 0.1; //+------------------------------------------------------------------+ //|Initialization function | //+------------------------------------------------------------------+ int OnInit() { trade.SetExpertMagicNumber(Magic); handleMa = iMA(_Symbol,PERIOD_CURRENT,MaPeriods,0,MODE_SMA,PRICE_CLOSE); return(INIT_SUCCEEDED); } //+------------------------------------------------------------------+ //|Deinitialization function | //+------------------------------------------------------------------+ void OnDeinit(const int reason) { } //+------------------------------------------------------------------+ //|On tick function | //+------------------------------------------------------------------+ void OnTick() { int bars = iBars(_Symbol, PERIOD_CURRENT); if(barsTotal != bars){ barsTotal=bars; bool NotInPosition = true; double ma[]; CopyBuffer(handleMa,0,1,1,ma); if(MarketOpened()&&!MarketClosed()){ lastClose = iClose(_Symbol,PERIOD_CURRENT,1); int startIndex = getSessionStartIndex(); double vwap = getVWAP(startIndex); for(int i = PositionsTotal()-1; i>=0; i--){ ulong pos = PositionGetTicket(i); string symboll = PositionGetSymbol(i); if(PositionGetInteger(POSITION_MAGIC) == Magic&&symboll== _Symbol){ if((PositionGetInteger(POSITION_TYPE) == POSITION_TYPE_BUY&&lastClose<vwap)||(PositionGetInteger(POSITION_TYPE) == POSITION_TYPE_SELL&&lastClose>vwap))trade.PositionClose(pos); else NotInPosition=false; } } if(lastClose<vwap&&NotInPosition&&lastClose<ma[0])executeSell(); if(lastClose>vwap&&NotInPosition&&lastClose>ma[0]) executeBuy(); } if(MarketClosed()){ for(int i = PositionsTotal()-1; i>=0; i--){ ulong pos = PositionGetTicket(i); string symboll = PositionGetSymbol(i); if(PositionGetInteger(POSITION_MAGIC) == Magic&&symboll== _Symbol)trade.PositionClose(pos); } } } } //+------------------------------------------------------------------+ //| Detect if market is opened | //+------------------------------------------------------------------+ bool MarketOpened() { datetime currentTime = TimeTradeServer(); MqlDateTime timeStruct; TimeToStruct(currentTime, timeStruct); int currentHour = timeStruct.hour; int currentMinute = timeStruct.min; if (currentHour >= startHour &¤tMinute>=startMinute)return true; else return false; } //+------------------------------------------------------------------+ //| Detect if market is closed | //+------------------------------------------------------------------+ bool MarketClosed() { datetime currentTime = TimeTradeServer(); MqlDateTime timeStruct; TimeToStruct(currentTime, timeStruct); int currentHour = timeStruct.hour; int currentMinute = timeStruct.min; if (currentHour >= endHour && currentMinute >= endMinute)return true; else return false; } //+------------------------------------------------------------------+ //| Sell execution function | //+------------------------------------------------------------------+ void executeSell() { double bid = SymbolInfoDouble(_Symbol, SYMBOL_BID); bid = NormalizeDouble(bid,_Digits); double sl = bid*(1+slp); sl = NormalizeDouble(sl, _Digits); lot = calclots(bid*slp); trade.Sell(lot,_Symbol,bid,sl); } //+------------------------------------------------------------------+ //| Buy execution function | //+------------------------------------------------------------------+ void executeBuy() { double ask = SymbolInfoDouble(_Symbol, SYMBOL_ASK); ask = NormalizeDouble(ask,_Digits); double sl = ask*(1-slp); sl = NormalizeDouble(sl, _Digits); lot = calclots(ask*slp); trade.Buy(lot,_Symbol,ask,sl); } //+------------------------------------------------------------------+ //| Get VWAP function | //+------------------------------------------------------------------+ double getVWAP(int startCandle) { double sumPV = 0.0; // Sum of (price * volume) long sumV = 0.0; // Sum of volume // Loop from the starting candle index down to 1 (excluding current candle) for(int i = startCandle; i >= 1; i--) { // Calculate typical price: (High + Low + Close) / 3 double high = iHigh(_Symbol, PERIOD_CURRENT, i); double low = iLow(_Symbol, PERIOD_CURRENT, i); double close = iClose(_Symbol, PERIOD_CURRENT, i); double typicalPrice = (high + low + close) / 3.0; // Get volume and update sums long volume = iVolume(_Symbol, PERIOD_CURRENT, i); sumPV += typicalPrice * volume; sumV += volume; } // Calculate VWAP or return 0 if no volume if(sumV == 0) return 0.0; double vwap = sumPV / sumV; // Plot the dot datetime currentBarTime = iTime(_Symbol, PERIOD_CURRENT, 0); string objName = "VWAP" + TimeToString(currentBarTime, TIME_MINUTES); ObjectCreate(0, objName, OBJ_ARROW, 0, currentBarTime, vwap); ObjectSetInteger(0, objName, OBJPROP_COLOR, clrGreen); // Green dot ObjectSetInteger(0, objName, OBJPROP_STYLE, STYLE_DOT); // Dot style ObjectSetInteger(0, objName, OBJPROP_WIDTH, 1); // Size of the dot return vwap; } //+------------------------------------------------------------------+ //| Find the index of the candle corresponding to the session open | //+------------------------------------------------------------------+ int getSessionStartIndex() { int sessionIndex = 1; // Loop over bars until we find the session open for(int i = 1; i <=1000; i++) { datetime barTime = iTime(_Symbol, PERIOD_CURRENT, i); MqlDateTime dt; TimeToStruct(barTime, dt); if(dt.hour == startHour && dt.min == startMinute-5) { sessionIndex = i; break; } } return sessionIndex; } //+------------------------------------------------------------------+ //| Calculate lot size based on risk and stop loss range | //+------------------------------------------------------------------+ double calclots(double slpoints) { double riskAmount = AccountInfoDouble(ACCOUNT_BALANCE) * risk / 100; double ticksize = SymbolInfoDouble(_Symbol, SYMBOL_TRADE_TICK_SIZE); double tickvalue = SymbolInfoDouble(_Symbol, SYMBOL_TRADE_TICK_VALUE); double lotstep = SymbolInfoDouble(_Symbol, SYMBOL_VOLUME_STEP); double moneyperlotstep = slpoints / ticksize * tickvalue * lotstep; double lots = MathFloor(riskAmount / moneyperlotstep) * lotstep; lots = MathMin(lots, SymbolInfoDouble(_Symbol, SYMBOL_VOLUME_MAX)); lots = MathMax(lots, SymbolInfoDouble(_Symbol, SYMBOL_VOLUME_MIN)); return lots; }
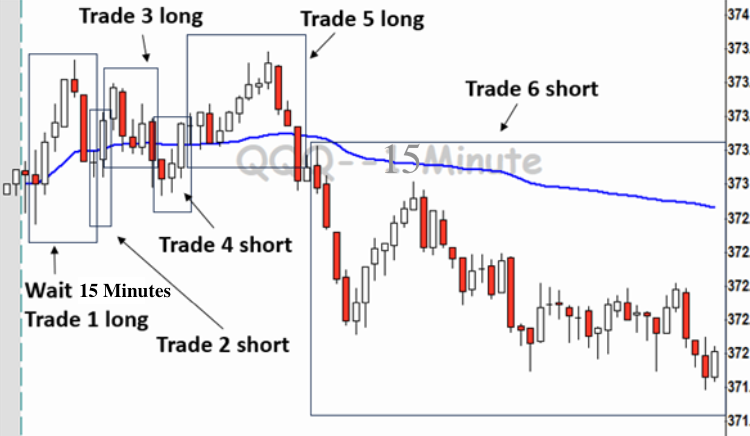
A typical trade would look like this:
Backtest Results:
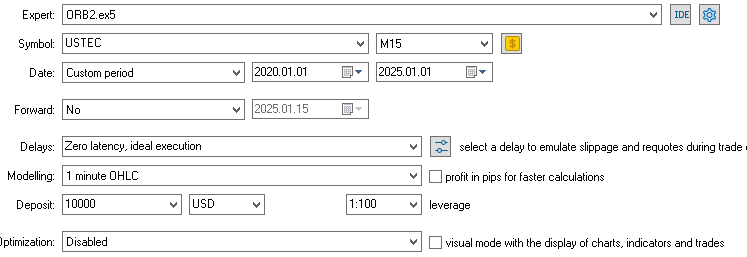

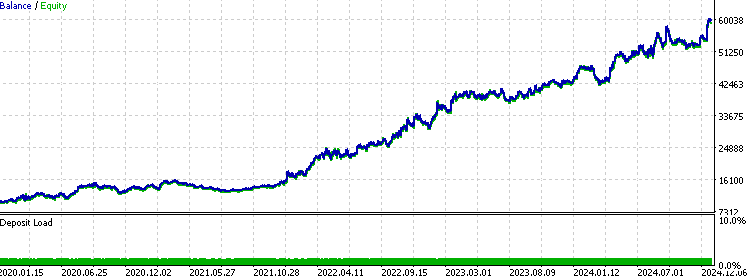
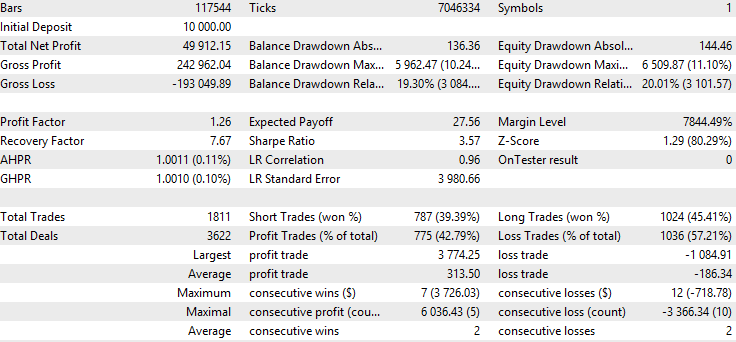
Compared to the first opening breakout strategy, this one trades more often, averaging over one trade per day. This increase stems from allowing reentry whenever the price crosses the VWAP again during market hours. The win rate is lower at 42%, below 50%, which is typical for a trend-following approach with a dynamic trailing stop. This setup favors higher reward-to-risk trades but increases the chance of being stopped out. The Sharpe ratio and profit factor are exceptionally high at 3.57 and 1.26, respectively.
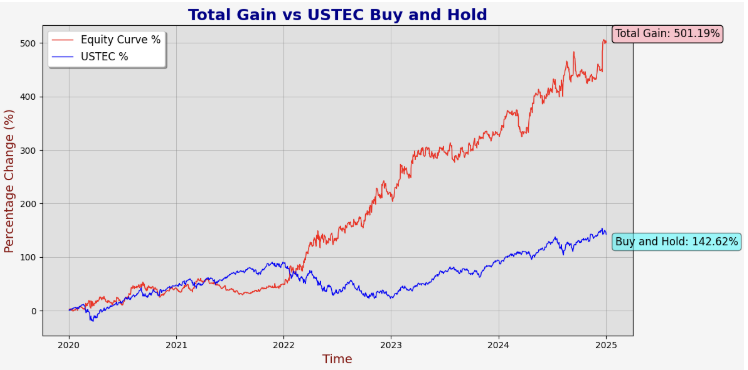
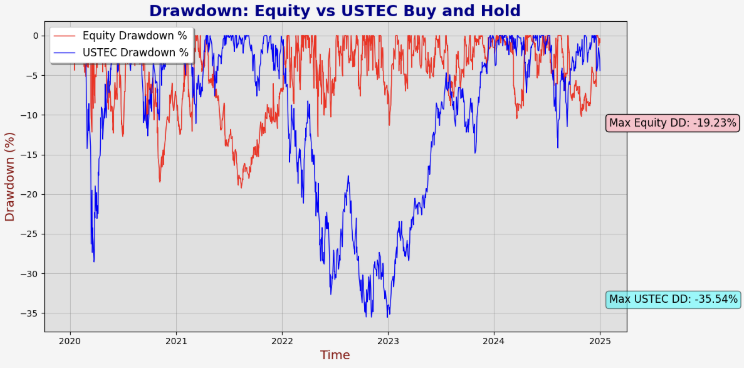
The strategy significantly outperforms buy-and-hold, achieving a 501% return over five years. It does so with a maximum drawdown of 16%, with its worst period in late 2021, differing from USTEC’s worst phase, hinting at uncorrelated performance.


Alpha: 4.8714
Beta: 0.0985
The beta matches the first strategy’s, also indicating low correlation with the underlying asset. Notably, this strategy’s alpha is three times higher than the first while keeping a similar maximum drawdown. This edge likely comes from more frequent trading, shorter holding periods, and greater internal diversification through both long and short opportunities within the same day. The monthly table confirms robust performance, with drawdowns and returns evenly distributed and consistent across months.
Strategy Three: Concretum Bands Breakout
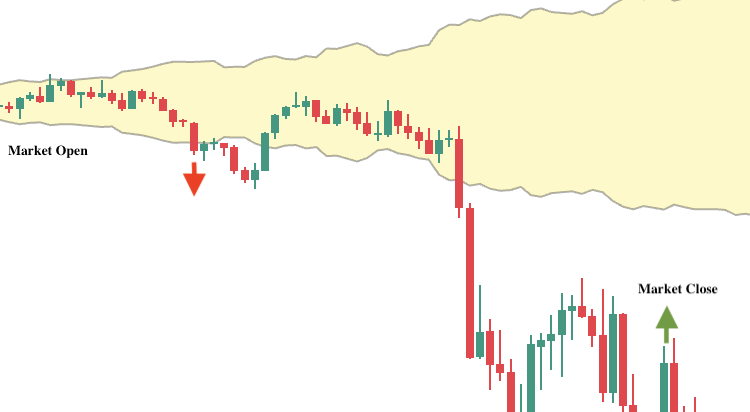
The third strategy is a noise range breakout strategy traded during market open time. It was first introduced in Beat the Market An Effective Intraday Momentum Strategy for S&P500 ETF (SPY), and later went viral over X/Twitter. The motivations behind the signal rules of the Concretum Bands breakout strategy stem from the goal of identifying significant price movements driven by supply and demand imbalances in intraday trading. The strategy uses volatility-based bands, calculated from the previous day’s close or current day’s open and adjusted by a volatility multiplier, to define a "Noise Area" where random price fluctuations occur. The rules aim to filter out market noise, capitalize on high-probability momentum shifts, and adapt to varying volatility, ensuring trades align with genuine trend beginnings rather than fleeting fluctuations.
Here are the calculations of the bands.

Because the signal rules from the original paper are well-thought, we are not going to change much in this article. We will keep the same trading asset (USTEC) and the same risk management approach for simplicity, which may yield different results from the paper's approach. The signal rules are as followed:
- After the market opens, buy when the 1-minute bar crosses above the upper band.
- After the market opens, sell when the 1-minute bar crosses below the lower band.
- Exit all positions when market is closed.
- Stop loss set at 1% of price from the entry position, along with VWAP as trailing stop.
- 4% risk per trade.
Full MQL5 code of the EA:
//USTEC-M1 #include <Trade/Trade.mqh> CTrade trade; input int startHour = 18; input int startMinute = 35; input int endHour = 23; input int endMinute = 55; input double risk = 4.0; input double slp = 0.01; input int Magic = 0; input int maPeriod = 400; int barsTotal = 0; int handleMa; double lastClose=0; double lastOpen = 0; double lot = 0.1; //+------------------------------------------------------------------+ //|Initialization function | //+------------------------------------------------------------------+ int OnInit() { trade.SetExpertMagicNumber(Magic); handleMa = iMA(_Symbol,PERIOD_CURRENT,maPeriod,0,MODE_SMA,PRICE_CLOSE); return(INIT_SUCCEEDED); } //+------------------------------------------------------------------+ //|Deinitialization function | //+------------------------------------------------------------------+ void OnDeinit(const int reason) { } //+------------------------------------------------------------------+ //|On tick function | //+------------------------------------------------------------------+ void OnTick() { int bars = iBars(_Symbol, PERIOD_CURRENT); if(barsTotal != bars){ barsTotal=bars; bool NotInPosition = true; double ma[]; CopyBuffer(handleMa,0,1,1,ma); if(MarketOpened()&&!MarketClosed()){ lastClose = iClose(_Symbol,PERIOD_CURRENT,1); lastOpen = iOpen(_Symbol,PERIOD_CURRENT,1); int startIndex = getSessionStartIndex(); double vwap = getVWAP(startIndex); for(int i = PositionsTotal()-1; i>=0; i--){ ulong pos = PositionGetTicket(i); string symboll = PositionGetSymbol(i); if(PositionGetInteger(POSITION_MAGIC) == Magic&&symboll== _Symbol){ if((PositionGetInteger(POSITION_TYPE) == POSITION_TYPE_BUY&&lastClose<vwap)||(PositionGetInteger(POSITION_TYPE) == POSITION_TYPE_SELL&&lastClose>vwap))trade.PositionClose(pos); else NotInPosition=false; } } double lower = getLowerBand(); double upper = getUpperBand(); if(NotInPosition&&lastOpen>lower&&lastClose<lower&&lastClose<ma[0])executeSell(); if(NotInPosition&&lastOpen<upper&&lastClose>upper&&lastClose>ma[0]) executeBuy(); } if(MarketClosed()){ for(int i = PositionsTotal()-1; i>=0; i--){ ulong pos = PositionGetTicket(i); string symboll = PositionGetSymbol(i); if(PositionGetInteger(POSITION_MAGIC) == Magic&&symboll== _Symbol)trade.PositionClose(pos); } } } } //+------------------------------------------------------------------+ //| Detect if market is opened | //+------------------------------------------------------------------+ bool MarketOpened() { datetime currentTime = TimeTradeServer(); MqlDateTime timeStruct; TimeToStruct(currentTime, timeStruct); int currentHour = timeStruct.hour; int currentMinute = timeStruct.min; if (currentHour >= startHour &¤tMinute>=startMinute)return true; else return false; } //+------------------------------------------------------------------+ //| Detect if market is closed | //+------------------------------------------------------------------+ bool MarketClosed() { datetime currentTime = TimeTradeServer(); MqlDateTime timeStruct; TimeToStruct(currentTime, timeStruct); int currentHour = timeStruct.hour; int currentMinute = timeStruct.min; if (currentHour >= endHour && currentMinute >= endMinute)return true; else return false; } //+------------------------------------------------------------------+ //| Sell execution function | //+------------------------------------------------------------------+ void executeSell() { double bid = SymbolInfoDouble(_Symbol, SYMBOL_BID); bid = NormalizeDouble(bid,_Digits); double sl = bid*(1+slp); sl = NormalizeDouble(sl, _Digits); lot = calclots(bid*slp); trade.Sell(lot,_Symbol,bid,sl); } //+------------------------------------------------------------------+ //| Buy execution function | //+------------------------------------------------------------------+ void executeBuy() { double ask = SymbolInfoDouble(_Symbol, SYMBOL_ASK); ask = NormalizeDouble(ask,_Digits); double sl = ask*(1-slp); sl = NormalizeDouble(sl, _Digits); lot = calclots(ask*slp); trade.Buy(lot,_Symbol,ask,sl); } //+------------------------------------------------------------------+ //| Get VWAP function | //+------------------------------------------------------------------+ double getVWAP(int startCandle) { double sumPV = 0.0; // Sum of (price * volume) long sumV = 0.0; // Sum of volume // Loop from the starting candle index down to 1 (excluding current candle) for(int i = startCandle; i >= 1; i--) { // Calculate typical price: (High + Low + Close) / 3 double high = iHigh(_Symbol, PERIOD_CURRENT, i); double low = iLow(_Symbol, PERIOD_CURRENT, i); double close = iClose(_Symbol, PERIOD_CURRENT, i); double typicalPrice = (high + low + close) / 3.0; // Get volume and update sums long volume = iVolume(_Symbol, PERIOD_CURRENT, i); sumPV += typicalPrice * volume; sumV += volume; } // Calculate VWAP or return 0 if no volume if(sumV == 0) return 0.0; double vwap = sumPV / sumV; // Plot the dot datetime currentBarTime = iTime(_Symbol, PERIOD_CURRENT, 0); string objName = "VWAP" + TimeToString(currentBarTime, TIME_MINUTES); ObjectCreate(0, objName, OBJ_ARROW, 0, currentBarTime, vwap); ObjectSetInteger(0, objName, OBJPROP_COLOR, clrGreen); // Green dot ObjectSetInteger(0, objName, OBJPROP_STYLE, STYLE_DOT); // Dot style ObjectSetInteger(0, objName, OBJPROP_WIDTH, 1); // Size of the dot return vwap; } //+------------------------------------------------------------------+ //| Find the index of the candle corresponding to the session open | //+------------------------------------------------------------------+ int getSessionStartIndex() { int sessionIndex = 1; // Loop over bars until we find the session open for(int i = 1; i <=1000; i++) { datetime barTime = iTime(_Symbol, PERIOD_CURRENT, i); MqlDateTime dt; TimeToStruct(barTime, dt); if(dt.hour == startHour && dt.min == 30) { sessionIndex = i; break; } } return sessionIndex; } //+------------------------------------------------------------------+ //| Get the number of bars from now to market open | //+------------------------------------------------------------------+ int getBarShiftForTime(datetime day_start, int hour, int minute) { MqlDateTime dt; TimeToStruct(day_start, dt); dt.hour = hour; dt.min = minute; dt.sec = 0; datetime target_time = StructToTime(dt); int shift = iBarShift(_Symbol, PERIOD_M1, target_time, true); return shift; } //+------------------------------------------------------------------+ //| Get the upper Concretum band value | //+------------------------------------------------------------------+ double getUpperBand() { // Get the time of the current bar datetime current_time = iTime(_Symbol, PERIOD_CURRENT, 0); MqlDateTime current_dt; TimeToStruct(current_time, current_dt); int current_hour = current_dt.hour; int current_min = current_dt.min; // Find today's opening price at 9:30 AM datetime today_start = iTime(_Symbol, PERIOD_D1, 0); int bar_at_930_today = getBarShiftForTime(today_start, 9, 30); if (bar_at_930_today < 0) return 0; // Return 0 if no 9:30 bar exists double open_930_today = iOpen(_Symbol, PERIOD_M1, bar_at_930_today); if (open_930_today == 0) return 0; // No valid price // Calculate sigma based on the past 14 days double sum_moves = 0; int valid_days = 0; for (int i = 1; i <= 14; i++) { datetime day_start = iTime(_Symbol, PERIOD_D1, i); int bar_at_930 = getBarShiftForTime(day_start, 9, 30); int bar_at_HHMM = getBarShiftForTime(day_start, current_hour, current_min); if (bar_at_930 < 0 || bar_at_HHMM < 0) continue; // Skip if bars don't exist double open_930 = iOpen(_Symbol, PERIOD_M1, bar_at_930); double close_HHMM = iClose(_Symbol, PERIOD_M1, bar_at_HHMM); if (open_930 == 0) continue; // Skip if no valid opening price double move = MathAbs(close_HHMM / open_930 - 1); sum_moves += move; valid_days++; } if (valid_days == 0) return 0; // Return 0 if no valid data double sigma = sum_moves / valid_days; // Calculate the upper band double upper_band = open_930_today * (1 + sigma); // Plot a blue dot at the upper band level string obj_name = "UpperBand_" + TimeToString(current_time, TIME_DATE|TIME_MINUTES|TIME_SECONDS); ObjectCreate(0, obj_name, OBJ_ARROW, 0, current_time, upper_band); ObjectSetInteger(0, obj_name, OBJPROP_ARROWCODE, 159); // Dot symbol ObjectSetInteger(0, obj_name, OBJPROP_COLOR, clrBlue); ObjectSetInteger(0, obj_name, OBJPROP_WIDTH, 2); return upper_band; } //+------------------------------------------------------------------+ //| Get the lower Concretum band value | //+------------------------------------------------------------------+ double getLowerBand() { // Get the time of the current bar datetime current_time = iTime(_Symbol, PERIOD_CURRENT, 0); MqlDateTime current_dt; TimeToStruct(current_time, current_dt); int current_hour = current_dt.hour; int current_min = current_dt.min; // Find today's opening price at 9:30 AM datetime today_start = iTime(_Symbol, PERIOD_D1, 0); int bar_at_930_today = getBarShiftForTime(today_start, 9, 30); if (bar_at_930_today < 0) return 0; // Return 0 if no 9:30 bar exists double open_930_today = iOpen(_Symbol, PERIOD_M1, bar_at_930_today); if (open_930_today == 0) return 0; // No valid price // Calculate sigma based on the past 14 days double sum_moves = 0; int valid_days = 0; for (int i = 1; i <= 14; i++) { datetime day_start = iTime(_Symbol, PERIOD_D1, i); int bar_at_930 = getBarShiftForTime(day_start, 9, 30); int bar_at_HHMM = getBarShiftForTime(day_start, current_hour, current_min); if (bar_at_930 < 0 || bar_at_HHMM < 0) continue; // Skip if bars don't exist double open_930 = iOpen(_Symbol, PERIOD_M1, bar_at_930); double close_HHMM = iClose(_Symbol, PERIOD_M1, bar_at_HHMM); if (open_930 == 0) continue; // Skip if no valid opening price double move = MathAbs(close_HHMM / open_930 - 1); sum_moves += move; valid_days++; } if (valid_days == 0) return 0; // Return 0 if no valid data double sigma = sum_moves / valid_days; // Calculate the lower band double lower_band = open_930_today * (1 - sigma); // Plot a red dot at the lower band level string obj_name = "LowerBand_" + TimeToString(current_time, TIME_DATE|TIME_MINUTES|TIME_SECONDS); ObjectCreate(0, obj_name, OBJ_ARROW, 0, current_time, lower_band); ObjectSetInteger(0, obj_name, OBJPROP_ARROWCODE, 159); // Dot symbol ObjectSetInteger(0, obj_name, OBJPROP_COLOR, clrRed); ObjectSetInteger(0, obj_name, OBJPROP_WIDTH, 2); return lower_band; } //+------------------------------------------------------------------+ //| Calculate lot size based on risk and stop loss range | //+------------------------------------------------------------------+ double calclots(double slpoints) { double riskAmount = AccountInfoDouble(ACCOUNT_BALANCE) * risk / 100; double ticksize = SymbolInfoDouble(_Symbol, SYMBOL_TRADE_TICK_SIZE); double tickvalue = SymbolInfoDouble(_Symbol, SYMBOL_TRADE_TICK_VALUE); double lotstep = SymbolInfoDouble(_Symbol, SYMBOL_VOLUME_STEP); double moneyperlotstep = slpoints / ticksize * tickvalue * lotstep; double lots = MathFloor(riskAmount / moneyperlotstep) * lotstep; lots = MathMin(lots, SymbolInfoDouble(_Symbol, SYMBOL_VOLUME_MAX)); lots = MathMax(lots, SymbolInfoDouble(_Symbol, SYMBOL_VOLUME_MIN)); return lots; }
A typical trade would look like this:
Backtest Results:
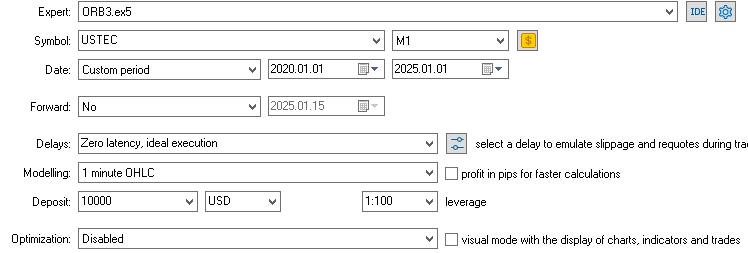

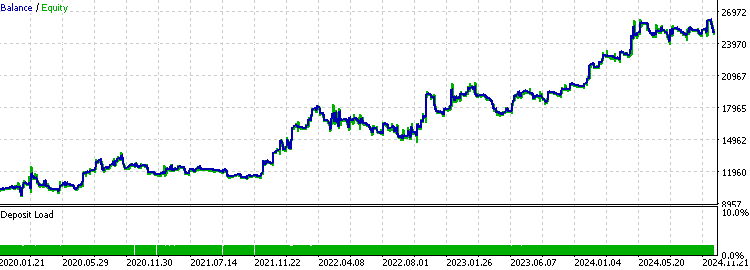
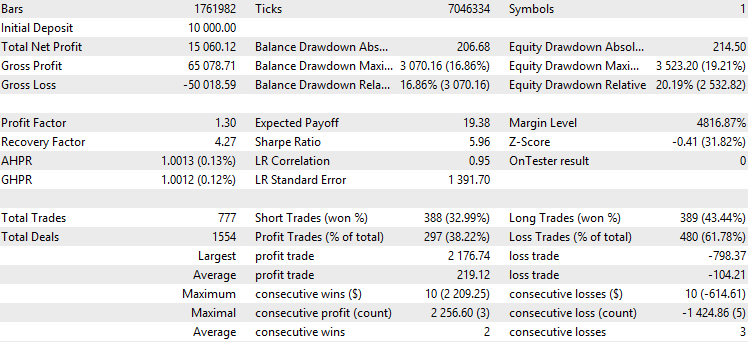
The strategy trades at a similar frequency to the first ORB strategy, averaging about one trade every two trading days. It doesn’t trade daily because price movements sometimes remain within a noise range, failing to break out of the bands. The win rate is below 50%, a result of using VWAP as a dynamic trailing stop. A profit factor of 1.3 and a Sharpe ratio of 5.9 indicate strong returns relative to drawdown.
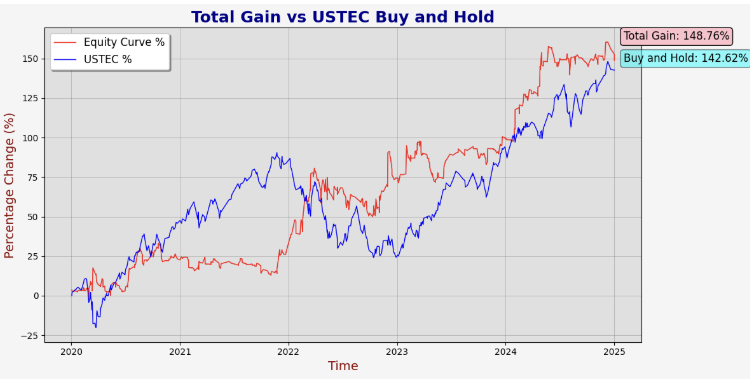
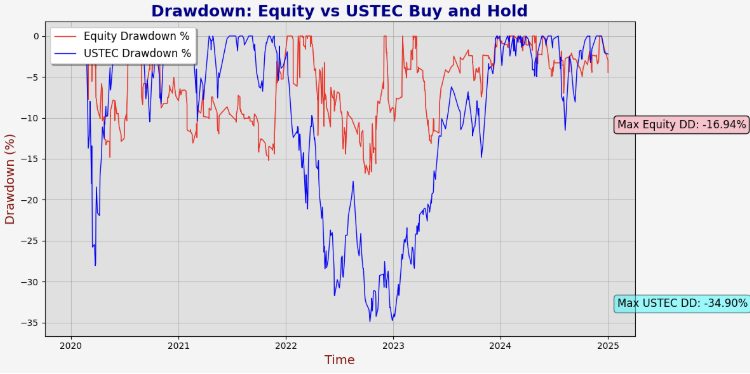
The strategy slightly outperforms buy-and-hold while maintaining half the maximum drawdown. However, it experiences significant drawdown periods more frequently than the previous strategy. This indicates that despite its superior performance, the strategy often endures extended drawdowns before reaching new equity highs.


Alpha: 1.6562
Beta: -0.1183
This strategy has a beta of -11%, indicating a slight negative correlation with the underlying asset. This is a favorable outcome for traders seeking an edge that moves opposite to market trends. Compared to the other two strategies, this one has more drawdown months, around 50%, but delivers higher returns during profitable months. This pattern suggests traders should brace for extended drawdown periods in live trading and patiently await the larger return phases. With a substantial sample size over a solid time frame, this strategy remains tradable.
Reflections
In our previous article, we explored building model systems instead of standalone strategies. We have applied the same concept in this article. All three strategies stem from stock market open time range breakouts, with variations that have proven profitable. We also shared insights on finding a strategy edge by adapting academic papers with our own knowledge and intuition. This approach is an excellent way to uncover robust trading concepts and expand our understanding.
With three profitable strategies in hand, we should now consider a portfolio perspective. We need to examine their combined results, correlations, and overall maximum drawdown before trading them simultaneously. In algorithmic trading, diversification is the true holy grail. It helps offset drawdowns from different strategies across various periods. To some extent, your maximum return is capped by the drawdown you’re willing to tolerate. Combining diverse strategies lets you increase exposure while maintaining a similar drawdown, boosting returns. However, risk can’t be scaled infinitely this way, as the minimal risk will always exceed that of individual trades.
Some common ways to reach diversification include:
- Trading the same strategy model and distributing it across different uncorrelated assets.
- Trading different strategy models on a single asset.
- Distribute capitals to different trading approaches such as options, arbitrage, and stock selections.
It is crucial to understand that more diversification isn’t always better; uncorrelated diversification is what matters. For example, applying the same strategy across all crypto markets isn’t ideal, since most crypto assets are highly correlated on a broader scale. What's more, relying solely on backtest diversification can be misleading as well because correlation depends on the time period, like daily or monthly returns. Moreover, in severe market regime shifts, strategy correlations can distort and skew unexpectedly. That’s why some traders prefer to use live trading result correlations relative to backtest result correlations to assess whether their strategies edge have decayed.
With the knowledge in mind, here are the backtest statistics of the combined performance of the three strategies.
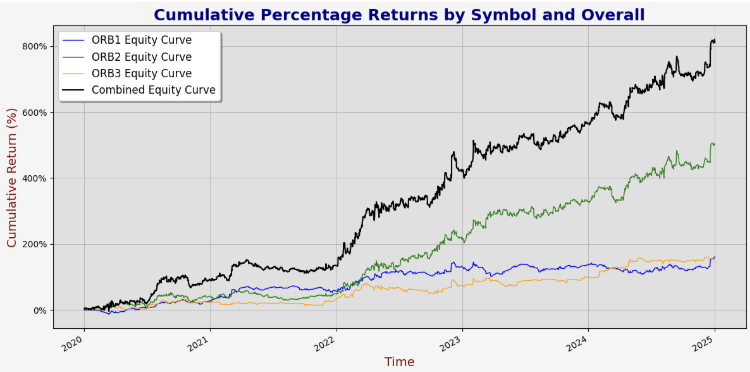
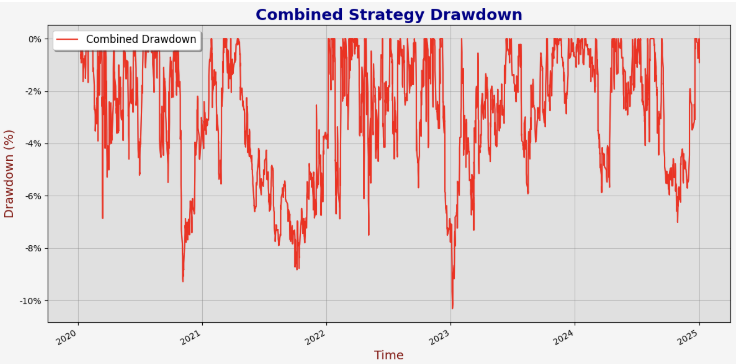
The equity and drawdown curves visually demonstrate how different strategies offset each other’s drawdowns across various periods. The maximum drawdown is now around 10%, notably lower than the individual strategies’ maximum drawdowns, all of which exceed 15%.


Drawdowns and returns appear evenly distributed across months, suggesting no extreme regime periods disproportionately affect the backtest performance. This makes sense with over 3000 samples and consistent risk allocation per trade.
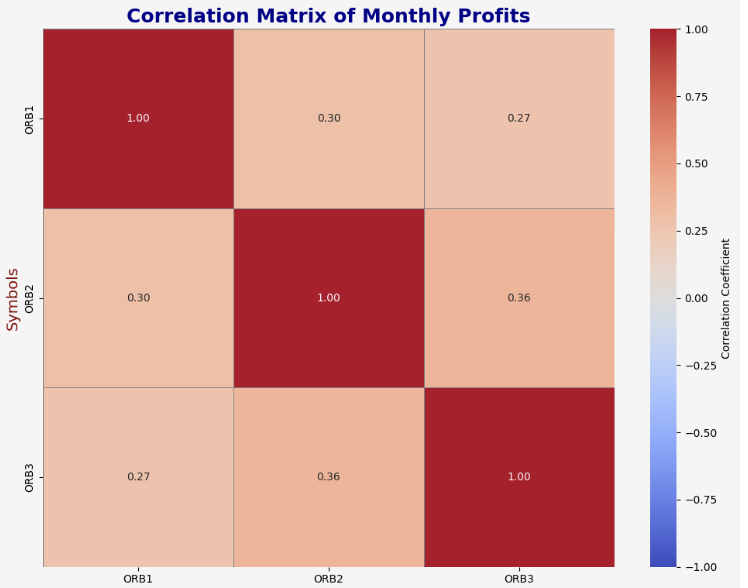
Correlation measures how similar each strategy’s backtest equity curves are, ranging from -1 for opposite behavior to 1 for identical behavior, typically comparing two subjects. We calculate it using x for the equity curve’s time axis and y for the return axis.

Conclusion
This article reviewed three intraday opening range breakout strategies from Concretum Group’s academic papers. We began by outlining the research background, explaining key concepts and methodologies used throughout. Then we explored the motivations behind the three strategies, identified areas for improvement, provided clear signal rules, MQL5 code, and backtest statistical analysis. Finally, we reflected on the process and introduced diversification, analyzing the combined results.
The article offers insights into the true robustness of strategy development. Deeper statistical analysis provides a broader view of a strategy’s performance and its role within a portfolio. All efforts aim to deepen understanding and build confidence before live trading. Readers are encouraged to replicate the research process and develop expert advisors using the framework presented.
File Table
| File Name | File Usage |
|---|---|
| ORB1.mq5. | The MQL5 EA script for the first strategy |
| ORB2.mq5 | The MQL5 EA script for the second strategy |
| ORB3.mq5 | The MQL5 EA script for the third strategy |
 Price Action Analysis Toolkit Development (Part 20): External Flow (IV) — Correlation Pathfinder
 Neural Networks in Trading: Transformer for the Point Cloud (Pointformer)
 Integrating AI model into already existing MQL5 trading strategy
 Formulating Dynamic Multi-Pair EA (Part 2): Portfolio Diversification and Optimization
- Free trading apps
- Over 8,000 signals for copying
- Economic news for exploring financial markets
You agree to website policy and terms of use
Indeed great article, appreciate the time and effort you have invested in writing the code and share it with the community.
Got a simple question around "In the studies we are adapting, they focus on strategies that trade between market open and close (9:30 AM to 4:00 PM Eastern Time). Since our broker uses UTC+2/3, this translates to 18:30-24:00 server time—make sure to adjust for your own broker's time zone when testing"
Are you able to walk me through your thought process on the time conversion? am clearly missing something here..
Using a generic time converter - my conversion of 09:30 Eastern Time ends up being 16:30 for when mt5 is in GMT+2 and 17:30 for when mt5 is in GMT+3. 18:30 feels like it is 1-2 hours post market open.
Appreciate the assistance & thanks again..
You are right, I wrongly converted the server time in the article for the New York stock market open time. It should be 17:30 instead of 18:30. With that being said, you can assume all my strategy rules in the article should be trading 1 hour after the market open. Thanks for pointing it out and sorry for the confusion.
Thanks for posting, very interesting!
A question about the code:
In your MarketOpened function you use:
"if (currentHour >= startHour && currentMinute>=startMinute)return true;" <- This looks like it will trade only part of the hour if the market is open, since it will return false if you're at the beginning of every hour, even when the market is open. It only works if minute is at 0, which is not the start of the market session.
OMG, can't believe I missed this. It should be:
I'm genuinely sorry for the careless mistake. Thanks for reading so carefully and pointing it out.
Ps. For ORB3, I hardcoded the time for the market open time to be 9:30. You can change it to these functions so that you can match the server time of New York market open time.
Changing the time of the calculation could be a way to optimize the strategy further. :)
OMG, can't believe I missed this. It should be:
I'm genuinely sorry for the careless mistake. Thanks for reading so carefully and pointing it out.
No worries, I already merged open and closed market into one function.
One more thing: You use broker OHLC data for backtesting, no delay. Those backtests seem a bit optimistic compared to backtests done on real tick data with random delay for slippage and requotes.
Thanks again for your efforts!