
Day Trading Larry Connors RSI2 Mean-Reversion Strategies
Introduction
Larry Connors is a renowned trader and author, best known for his work in quantitative trading and strategies like the 2-period RSI (RSI2), which helps identify short-term overbought and oversold market conditions. In this article, we’ll first explain the motivation behind our research, then recreate three of Connors’ most famous strategies in MQL5 and apply them to intraday trading of the S&P 500 index CFD. Next, we’ll analyze the results of each strategy and introduce the concept of building model systems in trading. Finally, we’ll provide suggestions for future improvements to these strategies.
Motivations
Larry Connors has developed numerous retail quantitative strategies throughout his career and documented his research on his website. Most of his strategies are tested and traded on the US stock market using daily timeframes, with extensive backtests proving their profitability. However, few traders have adapted his ideas to lower timeframes for intraday trading.
This article investigates this approach by coding three of Connors' most famous strategies in MQL5 and testing them on the US500 CFD using a 30-minute timeframe. The goal is to determine whether his mean-reversion concepts can provide value in higher-frequency trading, where noise increases but trading opportunities and sample sizes expand. We selected the US500 index CFD to mirror US stock market volatility, as Connors originally designed his strategies for stocks. The 30-minute timeframe strikes a balance—reducing excessive noise while providing sufficient trading activity. The backtest will cover the past year to ensure data recency.
The calculation of RSI is as follows:

The RSI measures the number of up bars and down bars over a given period and uses a smoothing method, such as a moving average, to indicate the relative strength of market movement. A shorter period makes the RSI more sensitive but also more prone to noise. Connor leverages this high sensitivity by using a 2-period RSI to identify short-term oversold or overbought conditions, which serve as signals for mean-reversion trades aligned with the overall trend.
Compared to traditional mean-reversion strategies like Bollinger Bands, this approach differs in several key ways:
- RSI2 is simpler and quicker, reacting faster to short-term reversals than Bollinger Bands’ multistep calculation.
- RSI2 offers clear overbought (above 90) and oversold (below 10) levels, unlike Bollinger Bands’ less precise band-touch signals.
- RSI2 ignores price range and trend context, while Bollinger Bands visually capture trend and volatility shifts.
Overall, this approach focuses more on capturing instant pullbacks rather than extreme price deviations.
Strategy one - Connors RSI2 Classic
The Connors RSI2 Classic Strategy operates on the principle of mean reversion, capitalizing on temporary pullbacks within established trends. The intuition is that even strongly trending assets experience short-term dips due to profit-taking or market noise. We want to employ a 2-period RSI to identify extreme oversold/overbought conditions (below 5/above95) over just two 30-minute bars, and signal potential bounce opportunities. We use a moving average to align with the broader trend, increasing the probability that pullbacks are temporary rather than trend reversals.
This exact strategy is detailed in Short-Term Trading Strategies That Work (2008), and was rigorously backtested by Connors and research partner Cesar Alvarez back in the day. We would like to see if the edge still holds years later.
Signal rules:
- Buy when: RSI2 < 5, last close price > 200-period moving average, and no current positions.
- Sell when: RSI2 > 95, last close price < 200-period moving average, and no current positions.
- Exit buy when: last close price > 5-period moving average, or last close price < 200-period moving average.
- Exit sell when: last close price < 5-period moving average, or last close price > 200-period moving average.
- Stop loss distance is 0.15% from the current price.
The MQL5 code:
//US500 M30
#include <Trade/Trade.mqh>
CTrade trade;

input int Magic = 0;
input double lot = 0.1;

int barsTotal = 0;
int handleMa;
int handleMaFast;
int handleRsi;
const int Max = 5;
const int Min = 95;
const int MaPeriods = 200;
const int MaPeriodsFast = 5;
const double slp = 0.0015;

int OnInit()
  {
   trade.SetExpertMagicNumber(Magic);
   handleMa =iMA(_Symbol,PERIOD_CURRENT,MaPeriods,0,MODE_SMA,PRICE_CLOSE);
   handleMaFast = iMA(_Symbol,PERIOD_CURRENT,MaPeriodsFast,0,MODE_SMA,PRICE_CLOSE);
   handleRsi = iRSI(_Symbol,PERIOD_CURRENT,2,PRICE_CLOSE);
   return(INIT_SUCCEEDED);
  }

void OnDeinit(const int reason)
  {
  }

void OnTick()
  {
  int bars = iBars(_Symbol,PERIOD_CURRENT);

  if (barsTotal!= bars){
     barsTotal = bars;
     bool NotInPosition = true;
     double ma[];
     double ma_fast[];
     double rsi[];
     CopyBuffer(handleMa,BASE_LINE,1,1,ma);
     CopyBuffer(handleMaFast,BASE_LINE,1,1,ma_fast);
     CopyBuffer(handleRsi,0,1,1,rsi);
     double lastClose = iClose(_Symbol, PERIOD_CURRENT, 1);
     for(int i = PositionsTotal()-1; i>=0; i--){
         ulong pos = PositionGetTicket(i);
         string symboll = PositionGetSymbol(i);
         if(PositionGetInteger(POSITION_MAGIC) == Magic&&symboll== _Symbol){
            NotInPosition = false;
            if((PositionGetInteger(POSITION_TYPE) == POSITION_TYPE_BUY&&(lastClose>ma_fast[0]||lastClose<ma[0]))
            ||(PositionGetInteger(POSITION_TYPE) == POSITION_TYPE_SELL&&(lastClose<ma_fast[0]||lastClose>ma[0])))trade.PositionClose(pos);
            }}
     if(rsi[0]<Max&&NotInPosition&&lastClose>ma[0])executeBuy();
     if(rsi[0]>Min&&NotInPosition&&lastClose<ma[0])executeSell();
    }
 }

void executeSell() {
       double bid = SymbolInfoDouble(_Symbol, SYMBOL_BID);
       bid = NormalizeDouble(bid,_Digits);
       double sl = bid*(1+slp);
       sl = NormalizeDouble(sl, _Digits);
       trade.Sell(lot,_Symbol,bid,sl);
}

void executeBuy() {
       double ask = SymbolInfoDouble(_Symbol, SYMBOL_ASK);
       ask = NormalizeDouble(ask,_Digits);
       double sl = ask*(1-slp);
       sl = NormalizeDouble(sl, _Digits);
       trade.Buy(lot,_Symbol,ask,sl);
}
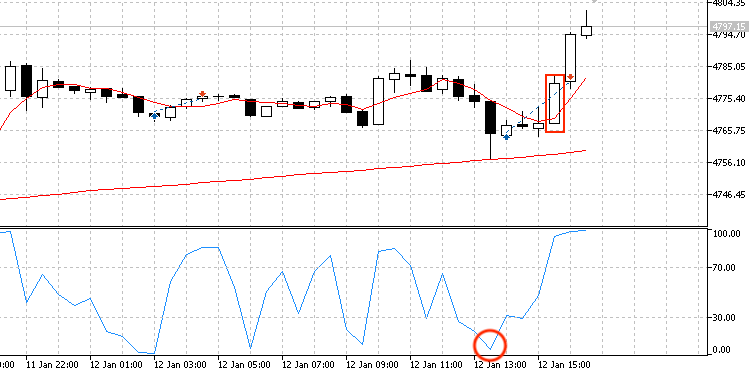
A typical trade would look like this:
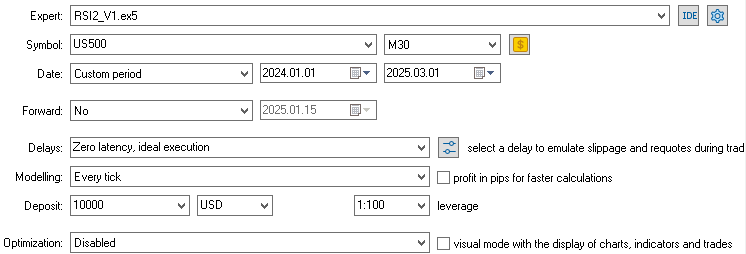
Here are the backtest results for US500 (M30) from January 1, 2024, to March 1, 2025.

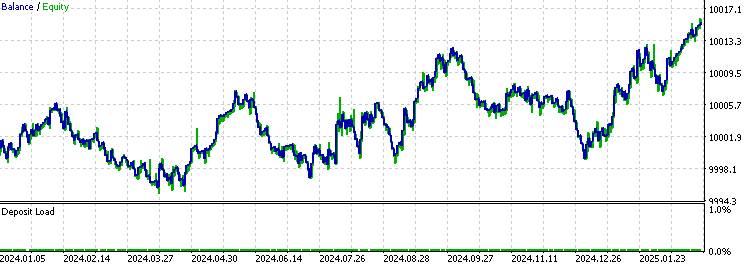
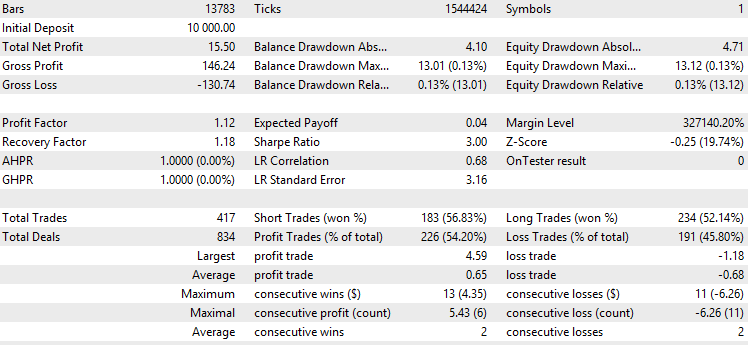
The trade frequency here is pretty high compared to other day-trading strategies, averaging about 1–2 trades per day with 252 trading days in a year. This likely comes from RSI2 being super reactive, churning out signals often even with extreme entry criteria. The average profit roughly matches the average loss, which is solid for a mean-reversion strategy where the win rate usually tops 50%. Even though the trading rules are completely symmetric, there’s a gap between short and long trade win rates: short trades had a higher win rate with fewer trades in the bullish 2024 market, suggesting bullish pullbacks might be trickier to nail with this strategy.
Strategy two - RSI2 Pullback
The RSI2 Pullback Strategy improves mean-reversion trading by requiring several consecutive extreme RSI values. The idea is that an asset in a long-term trend, facing a sharp, multi-bar pullback, is primed for a rebound. By using RSI2 with a slightly higher threshold than the traditional version and combining it with three consecutive RSI values above or below that threshold, the signal becomes stronger, suggesting capitulation and raising the chances of a quick reversal.
This strategy builds on Larry Connors' framework, but I’ve tweaked it by adding the requirement of multiple consecutive extreme RSI readings and introducing an unusual exit rule. We exit the position once it surpasses the previous candle’s high or low. This exit idea comes from noticing that short-term reversals often show a reversal bar that exceeds the prior candle’s high or low, allowing us to exit fast and lock in a small profit.
Signal rules:
- Buy when: the past three RSI2 value < 10, last close price > 200-period moving average, and no current positions.
- Sell when: the past three RSI2 value > 90, last close price < 200-period moving average, and no current positions.
- Exit buy when: last close price > second last candle high, or last close price < 200-period moving average.
- Exit sell when: last close price < second last candle low, or last close price > 200-period moving average.
- Stop loss distance is 0.15% from the current price.
The MQL5 code:
//US500 M30
#include <Trade/Trade.mqh>
CTrade trade;

input int Magic = 0;
input double lot = 0.1;

int barsTotal = 0;
int handleMa;
int handleRsi;
const int Max = 10;
const int Min = 90;
const int MaPeriods = 200;
const double slp = 0.0015;

int OnInit()
  {
   trade.SetExpertMagicNumber(Magic);
   handleMa =iMA(_Symbol,PERIOD_CURRENT,MaPeriods,0,MODE_SMA,PRICE_CLOSE);
   handleRsi = iRSI(_Symbol,PERIOD_CURRENT,2,PRICE_CLOSE);
   return(INIT_SUCCEEDED);
  }

void OnDeinit(const int reason)
  {
  }

void OnTick()
  {
  int bars = iBars(_Symbol,PERIOD_CURRENT);

  if (barsTotal!= bars){
     barsTotal = bars;
     bool NotInPosition = true;
     double ma[];
     double rsi[];
     CopyBuffer(handleMa,BASE_LINE,1,1,ma);
     CopyBuffer(handleRsi,0,1,3,rsi);
     double lastClose = iClose(_Symbol, PERIOD_CURRENT, 1);
     double lastlastHigh = iHigh(_Symbol,PERIOD_CURRENT,2);
     double lastlastLow = iLow(_Symbol,PERIOD_CURRENT,2);
     for(int i = PositionsTotal()-1; i>=0; i--){
         ulong pos = PositionGetTicket(i);
         string symboll = PositionGetSymbol(i);
         if(PositionGetInteger(POSITION_MAGIC) == Magic&&symboll== _Symbol){
            NotInPosition = false;
            if((PositionGetInteger(POSITION_TYPE) == POSITION_TYPE_BUY&&(lastClose>lastlastHigh||lastClose<ma[0]))
            ||(PositionGetInteger(POSITION_TYPE) == POSITION_TYPE_SELL&&(lastClose<lastlastLow||lastClose>ma[0])))trade.PositionClose(pos);
            }}
     if(rsi[0]<Max&&rsi[1]<Max&&rsi[2]<Max&&NotInPosition&&lastClose>ma[0])executeBuy();
     if(rsi[0]>Min&&rsi[1]>Min&&rsi[2]>Min&&NotInPosition&&lastClose<ma[0])executeSell();
    }
 }

void executeSell() {
       double bid = SymbolInfoDouble(_Symbol, SYMBOL_BID);
       bid = NormalizeDouble(bid,_Digits);
       double sl = bid*(1+slp);
       sl = NormalizeDouble(sl, _Digits);
       trade.Sell(lot,_Symbol,bid,sl);
}

void executeBuy() {
       double ask = SymbolInfoDouble(_Symbol, SYMBOL_ASK);
       ask = NormalizeDouble(ask,_Digits);
       double sl = ask*(1-slp);
       sl = NormalizeDouble(sl, _Digits);
       trade.Buy(lot,_Symbol,ask,sl);
}
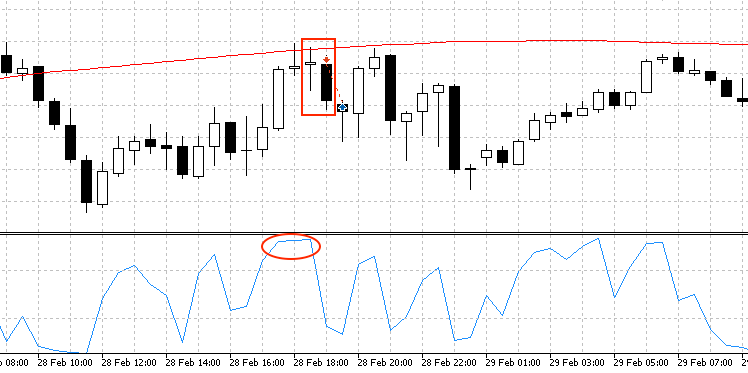
A typical trade would look like this:
Here are the backtest results for US500 (M30) from January 1, 2024, to March 1, 2025.
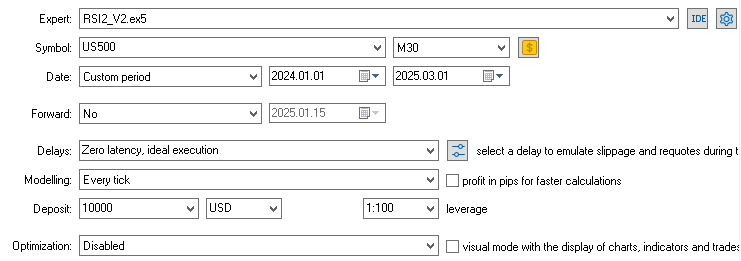

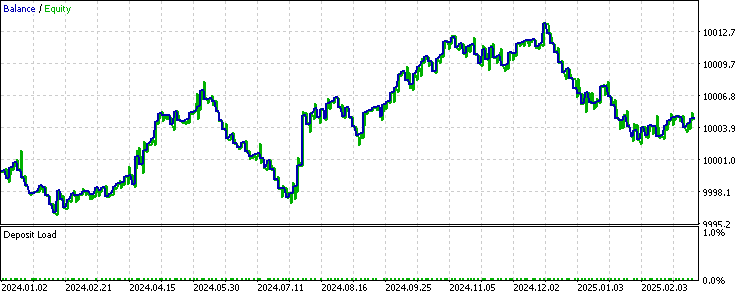
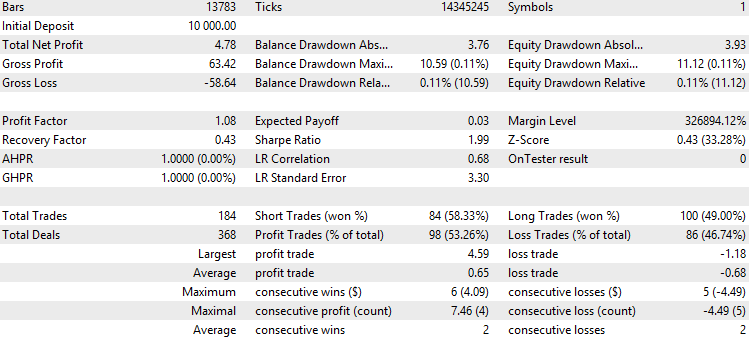
This strategy trades less often than the previous one, mostly because the entry now demands three consecutive extreme RSI values. The win rate for long trades isn’t exactly impressive. As we noted with the last strategy, since we’re scalping tiny bounce-backs (usually 2–3 candles) we might not fully capitalize on the big volatility of the bullish trend in 2024. This could balance out if we test it more across multiple years to collect data from different market conditions.
Strategy three - RSI2 Overbought/Oversold
The RSI2 Overbought/Oversold Strategy offers more flexibility, since the exit level adjusts depending on how trendy the asset is. It too assumes extreme RSI2 readings mean a stock has gone too far, too fast, and is due for a reversal, letting traders buy dips (oversold) or short rallies (overbought). Unlike the previous two strategies, this one has a more dynamic exit based on a tunable RSI value threshold. The catch is it might be riskier with fat tail risks since RSI, even at a 2-period setting, is smoothed and lags behind price action. So, if the trade quickly turns against us, only the stop loss saves the position.
Also, the 200-period moving average is typically used for long-term trends in bullish stock markets. That was why, for the previous two strategies, Larry made them long-only. Because we are day trading CFDs here, I’ve adapted all the strategies to trade both long and short. However, this strategy was mentioned by Larry to be able to trade both side of the market, including short-selling stocks. It uses a 50-period moving average instead of 200 for trend filtering, making it more responsive to trend shifts, since short selling often ties to quick changes rather than long-term stock market trends.
This strategy comes from Larry Connors’ research and is highlighted in his writings and seminars as a flexible way to use the indicator, suiting both long and short trades depending on the market.
Signal rules:
- Buy when: RSI2 < 5, last close price > 50-period moving average, and no current positions.
- Sell when: RSI2 > 95, last close price < 50-period moving average, and no current positions.
- Exit buy when: RSI2 > 70.
- Exit sell when: RSI2 < 30.
- Stop loss distance is 1% from the current price.
The MQL5 code:
//US500 M30
#include <Trade/Trade.mqh>
CTrade trade;

input int Magic = 0;
input double lot = 0.1;

const int Max = 5;
const int Min = 95;
const int MaPeriods = 50;
const double slp = 0.01;

int barsTotal = 0;
int handleMa;
int handleRsi;

int OnInit()
  {
   trade.SetExpertMagicNumber(Magic);
   handleMa =iMA(_Symbol,PERIOD_CURRENT,MaPeriods,0,MODE_SMA,PRICE_CLOSE);
   handleRsi = iRSI(_Symbol,PERIOD_CURRENT,2,PRICE_CLOSE);
   return(INIT_SUCCEEDED);
  }

void OnDeinit(const int reason)
  {
  }

void OnTick()
  {
  int bars = iBars(_Symbol,PERIOD_CURRENT);

  if (barsTotal!= bars){
     barsTotal = bars;
     bool NotInPosition = true;
     double ma[];
     double rsi[];
     CopyBuffer(handleMa,BASE_LINE,1,1,ma);
     CopyBuffer(handleRsi,0,1,1,rsi);
     double lastClose = iClose(_Symbol, PERIOD_CURRENT, 1);
     for(int i = PositionsTotal()-1; i>=0; i--){
         ulong pos = PositionGetTicket(i);
         string symboll = PositionGetSymbol(i);
         if(PositionGetInteger(POSITION_MAGIC) == Magic&&symboll== _Symbol){
            NotInPosition = false;
            if((PositionGetInteger(POSITION_TYPE) == POSITION_TYPE_BUY&&rsi[0]>70)
            ||(PositionGetInteger(POSITION_TYPE) == POSITION_TYPE_SELL&&rsi[0]<30))trade.PositionClose(pos);
            }}
     if(rsi[0]<Max&&NotInPosition&&lastClose>ma[0])executeBuy();
     if(rsi[0]>Min&&NotInPosition&&lastClose<ma[0])executeSell();
    }
 }

void executeSell() {
       double bid = SymbolInfoDouble(_Symbol, SYMBOL_BID);
       bid = NormalizeDouble(bid,_Digits);
       double sl = bid*(1+slp);
       sl = NormalizeDouble(sl, _Digits);
       trade.Sell(lot,_Symbol,bid,sl);
}

void executeBuy() {
       double ask = SymbolInfoDouble(_Symbol, SYMBOL_ASK);
       ask = NormalizeDouble(ask,_Digits);
       double sl = ask*(1-slp);
       sl = NormalizeDouble(sl, _Digits);
       trade.Buy(lot,_Symbol,ask,sl);
}
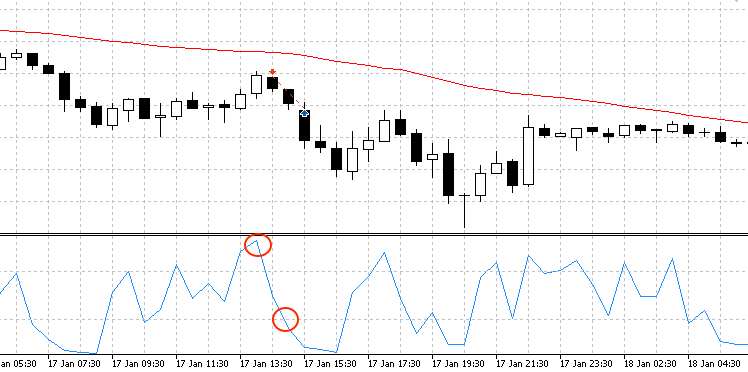
A typical trade would look like this:
Here are the backtest results for US500 (M30) from January 1, 2024, to March 1, 2025.
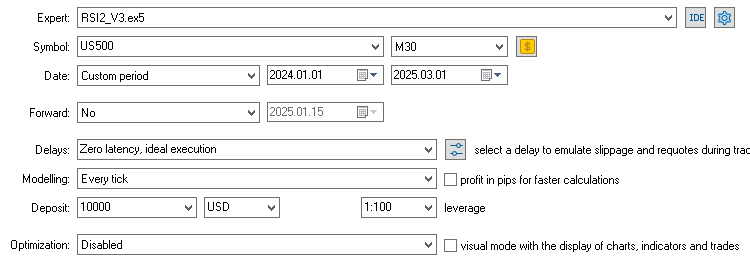

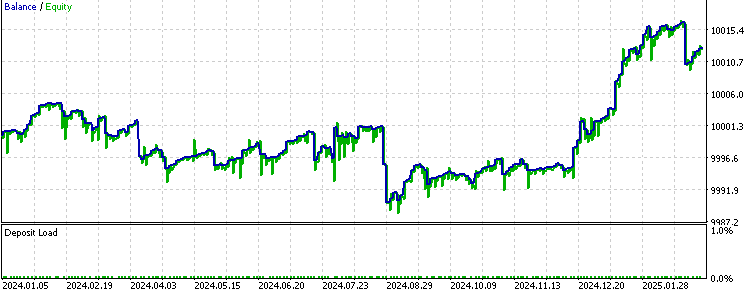
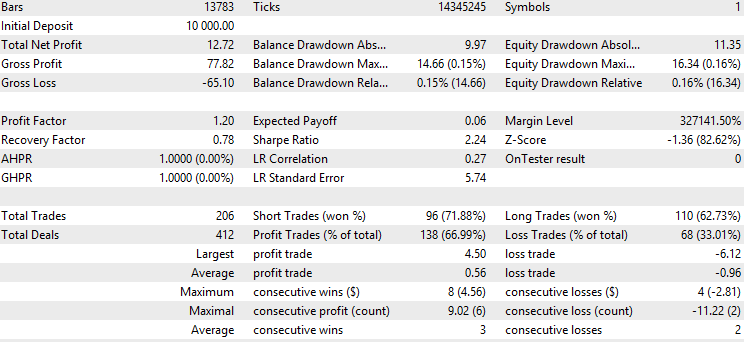
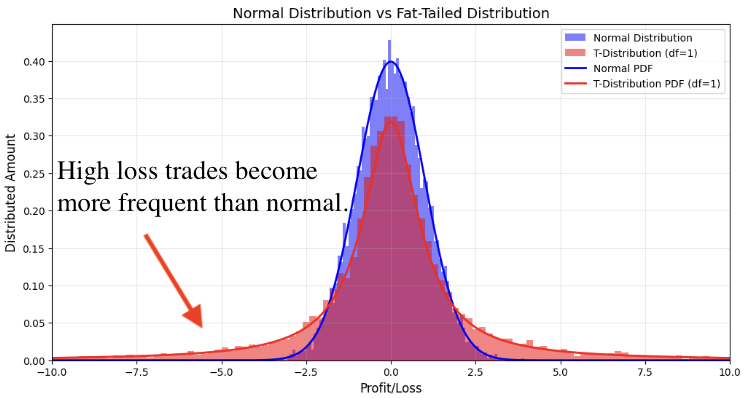
Compared to the prior two strategies, this one shows a higher win rate but also a bigger equity floating drawdown, as seen in the green lines on the equity curve. This ties back to the fat tail risk mentioned earlier and the need for a wider stop loss than usual. Fat tail risk describes the greater likelihood of extreme events in a distribution, which can cause substantial losses in a mean-reversion strategy that expects prices to return to their historical average. In these strategies, unexpected large price swings, more frequent in fat-tailed distributions, can prevent the anticipated reversion and lead to amplified risks or losses compared to what a normal distribution would predict. While this strategy boasts a higher profit factor, the drawdown needs to be tackled to make it a practical, tradable strategy.
Reflections
Looking back at the three strategies we’ve covered, they’re pretty similar in code and signal rules. That’s mostly because they all come from the "RSI2 Mean-Reversion" model system. Once you have a solid model system, tweaking a few rules to whip up different strategies is fairly straightforward. Let’s break down what a model system is versus a single strategy in CTA trading.
A single strategy is tied to a specific timeframe and asset, with signal rules that are detailed and not easily swapped around. A model system, though, is more of a broad starting point for finding your edge based on historically proven concepts like mean-reversion, trend-following, momentum, or breakout. From there, a specific model system combines key signal sources with that big concept, like RSI2 Mean-Reversion for this article. Model systems are more flexible across timeframes, assets, and signal rules, making it simpler to churn out multiple strategies and build a diversified portfolio efficiently.
To pull off a model system and develop strategies from it, it’s a good idea to:
- Calculate all signals or price distances in a stationary way by normalizing them, or use percentages of price to make them more scalable across different assets and timeframes.
- Avoid hardcoding the timeframe and symbol in your code. Use _Symbol and PERIOD_CURRENT for automatic adjustments during backtesting under various conditions.
- Split a strategy into clear entry and exit rules, list them out, and consider alternative rules that still capture the same edge-driven motivation.
- Encapsulate reusable code into functions to keep it tidy and efficient, making it easier to tweak signal rules later on.
Now, that we understand the concept of using the thinking in models instead of in particular strategies, here are some suggestions for future improvement of utilizing the RSI2 mean-reversion model to create a more tradable strategy.
- Test the strategies across various timeframes and assets other than US500 M30 to find out if there are better conditions than what we’re currently using. Make sure to make all the discoveries in in-sample data to avoid look-ahead bias.
- Change the momentum and trend indicators, like replacing RSI with ROC or VIX, or switching moving averages for a Kalman filter.
- Blend the entry and exit rules with other mean-reversion strategies, such as using Bollinger Bands for entries while sticking to the exit rule from this article.
These are key techniques experienced CTA quant researchers rely on to build strategies more effectively. Coming up with new strategy ideas was never about inventing something totally unheard of. It’s more about tweaking or combining existing, proven models that are out there but not profitable enough on their own. This part of the job is abstract enough that machines can’t take over, yet structured enough that people are still methodically mining data by following a process.
Conclusion
In this article, we started by explaining why we chose to build intraday strategies from the RSI2 mean-reversion concept. Next, we went over three well-known strategies from Larry Connors, detailing the reasoning behind their signal rules, spelling out the exact entry and exit conditions, and backtesting them on MetaTrader 5. After that, we introduced the idea of crafting strategies from model systems, offered practical tips for applying this approach, and suggested ways to develop more profitable RSI2 mean-reversion strategies moving forward. All in all, this article lays out a clear framework for traders: take a popular, publicly available strategy online, tweak it a bit, and test it on MQL5 to refine the concept further. Traders can pick up this process easily and boost their strategy development efficiency.
File Table
| File Name | File Usage |
|---|---|
| RSI2_V1.mq5 | The first strategy EA |
| RSI2_V2.mq5 | The second strategy EA |
| RSI2_V3.mq5 | The third strategy EA |
 Automating Trading Strategies in MQL5 (Part 13): Building a Head and Shoulders Trading Algorithm
 MQL5 Wizard Techniques you should know (Part 58): Reinforcement Learning (DDPG) with Moving Average and Stochastic Oscillator Patterns
 Simple solutions for handling indicators conveniently
 Master MQL5 from beginner to pro (Part V): Fundamental control flow operators
- Free trading apps
- Over 8,000 signals for copying
- Economic news for exploring financial markets
You agree to website policy and terms of use