
Implementing a Rapid-Fire Trading Strategy Algorithm with Parabolic SAR and Simple Moving Average (SMA) in MQL5
Introduction
This article will walk you through the vital processes of testing and optimizing our trading algorithm. We will use MQL5's Strategy Tester to backtest our EA against historical data. In layman's terms, we will check how well our algorithm would have performed in the past compared to real market conditions. As we discuss our EA's performance, we will also cover how to interpret various performance metrics (e.g., profit factor, drawdown, win rate, etc.) and what they tell us about our algorithm's reliability and profitability. By the end of this article, we will have a much clearer idea of how to implement a rapid-fire trading strategy and what it takes to ensure its success. The following topics will be effective throughout the article:
- Introduction to Rapid-Fire Trading Strategy
- Understanding the Indicators: Parabolic SAR and SMA
- Implementation in MQL5
- Testing and Optimization
- Conclusion
A rapid-fire trading strategy focuses on profiting from quick and frequent market movements by executing multiple trades in a short timeframe, often holding positions for less than an hour. This approach contrasts with traditional strategies that target longer-term trends, aiming instead to exploit small price changes in fast-moving securities. Success in this strategy relies on the ability to process and respond to market data almost instantly, making automated systems, like Expert Advisors, crucial for executing trades efficiently.
Key to the effectiveness of this strategy is the use of technical indicators such as the Parabolic SAR and Simple Moving Average, which help identify trend reversals and smooth out price data. These indicators, integrated into a high-frequency trading algorithm, enable the strategy to adapt quickly to market changes, maintaining accuracy in signal generation and trade execution. When properly implemented, rapid-fire trading can yield quick profits, though it requires careful management of costs and risks.
Understanding the Indicators: Parabolic SAR and SMA
An effective rapid-fire trading strategy requires an understanding of the important technical indicators that direct trading decisions. Two guides that are useful in this respect are the Parabolic SAR (Stop and Reverse) and the Simple Moving Average (SMA). The SMA is one of the oldest and most often-used trend-following indicators. The Parabolic SAR is relatively new in comparison but is certainly not a lesser-known tool; both of these indicators are very handy in determining market conditions and signaling potential trading opportunities.
Designed to follow trends, the Parabolic SAR indicator aims to find and identify potential price direction reversals. It works by plotting a series of dots either above or below the price, relative to where the price is about the SAR (stop and reverse). If we incorporate the Parabolic SAR into our trading strategy, we can interpret it relative to the series of dots to decide to buy, sell, or short a position in the market. If the price is above the SAR dots, we're in a bullish trend; if the price is below the SAR dots, we're in a bearish trend. Default indicator settings are to be used. This is as illustrated below:
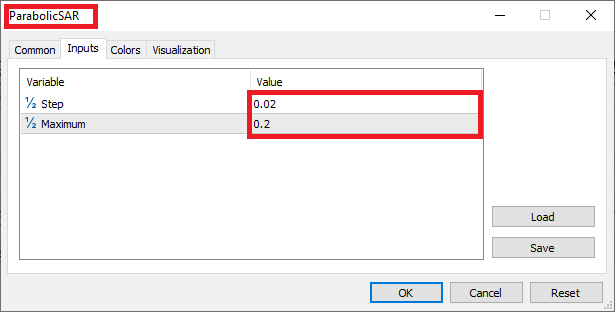
Parabolic SAR indicator setup:
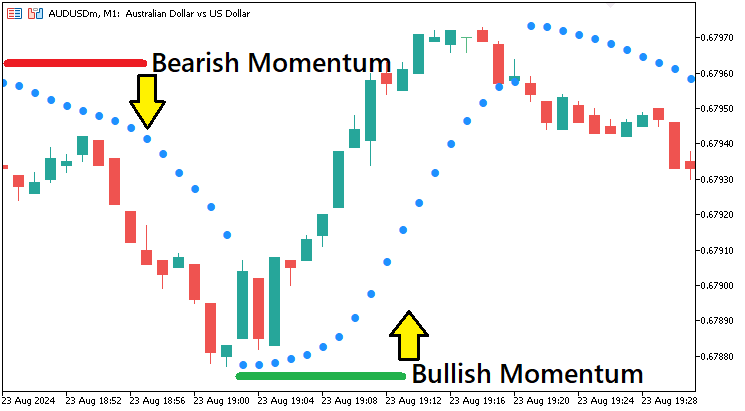
Another essential part of our trading strategy is the Simple Moving Average (SMA). The SMA takes price data over a specified period and "smooths" it out. It gives us a much easier-to-read look at what the overall trend is. We could also use the SMA to get an even simpler read on the trend. If the SMA is sloping up, then we could say, in very simple terms, that the market is in an uptrend. If the SMA is sloping down, we could say the market is in a downtrend. The SMA is a trend filter. It tells us whether we should be looking for long (uptrend), short (downtrend), or no trades (when the price is hovering around the SMA's flatline). A simple moving average of period 60 is to be used. This is as illustrated below:
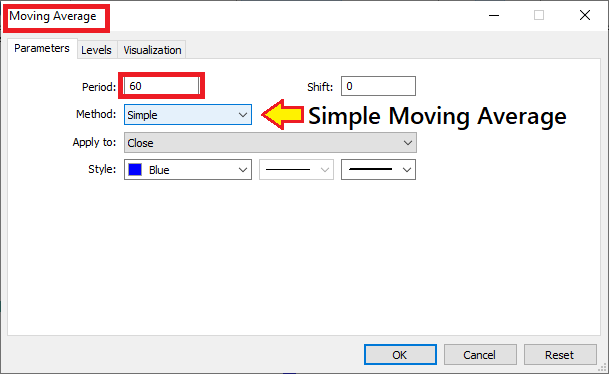
Simple Moving Average indicator setup:
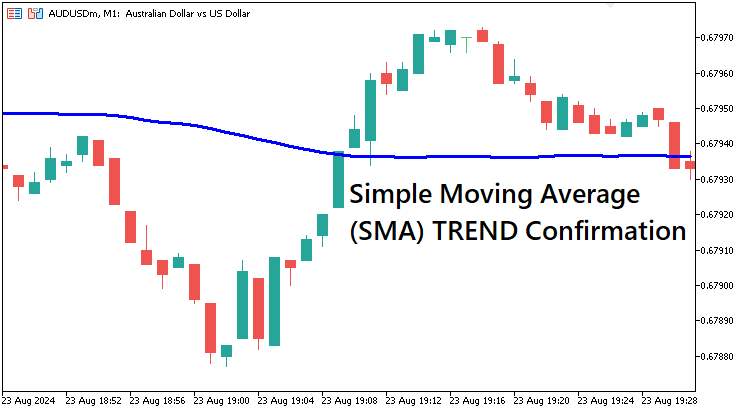
When used together, the Parabolic SAR and simple moving average yield a complete picture of market conditions. The SAR can be read for immediate signals about what might be happening to the current trend. It can and does quite often signal trend reversals before they happen. The SMA looks at more data over a longer period and, therefore, confirms the trend direction with more certainty. When combined, we have them as shown below:
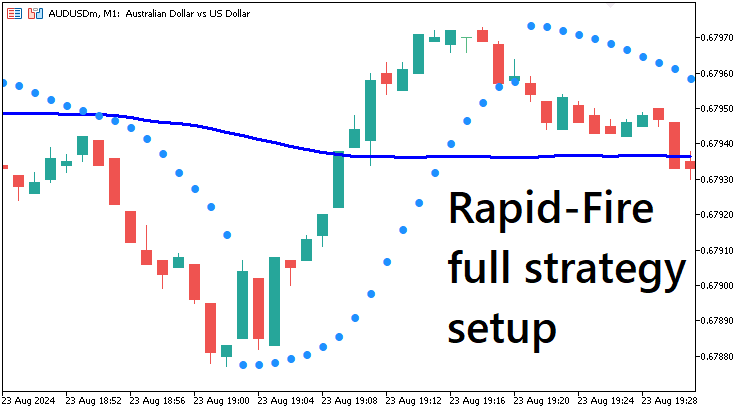
With the provided strategy overview, let us craft the strategy's Expert Advisor in MQL5.
Implementation in MQL5
After learning all the theories about the Rapid-Fire trading strategy, let us then automate the theory and craft an Expert Advisor (EA) in MetaQuotes Language 5 (MQL5) for MetaTrader 5 (MT5).
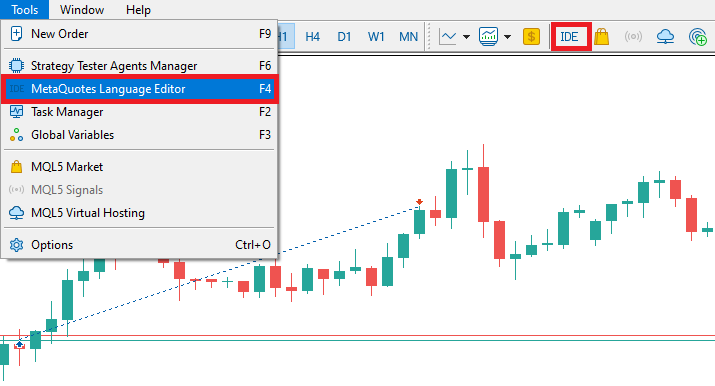
To create an expert advisor (EA), on your MetaTrader 5 terminal, click the Tools tab and check MetaQuotes Language Editor, or simply press F4 on your keyboard. Alternatively, you can click the IDE (Integrated Development Environment) icon on the tools bar. This will open the MetaQuotes Language Editor environment, which allows the writing of trading robots, technical indicators, scripts, and libraries of functions.
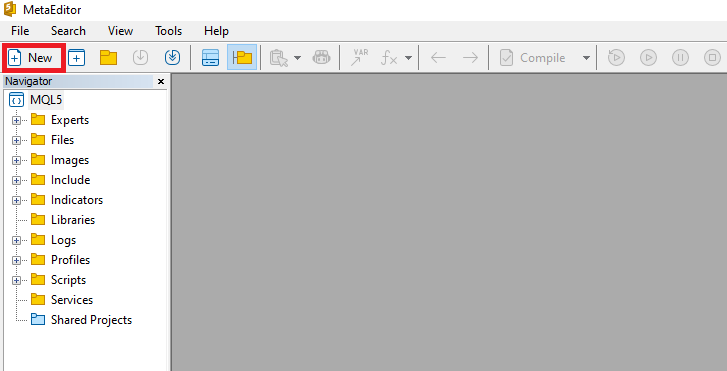
Once the MetaEditor is opened, on the tools bar, navigate to the File tab and check New File, or simply press CTRL + N, to create a new document. Alternatively, you can click on the New icon on the tools tab. This will result in a MQL Wizard pop-up.
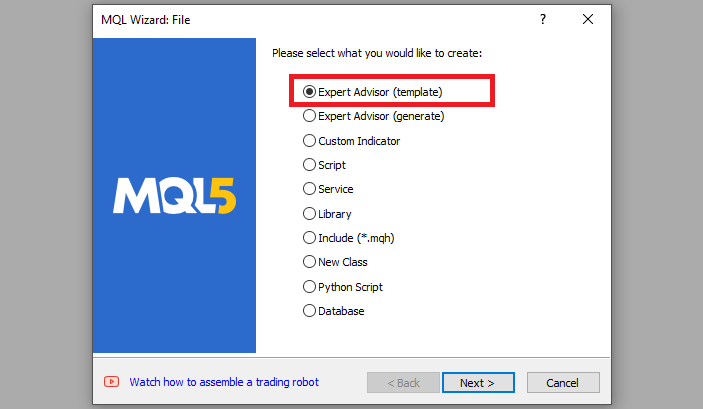
On the Wizard that pops, check Expert Advisor (template) and click Next.
On the general properties of the Expert Advisor, under the name section, provide your expert's file name. Note that to specify or create a folder if it doesn't exist, you use the backslash before the name of the EA. For example, here we have "Experts\" by default. That means that our EA will be created in the Experts folder and we can find it there. The other sections are pretty much straightforward, but you can follow the link at the bottom of the Wizard to know how to precisely undertake the process.
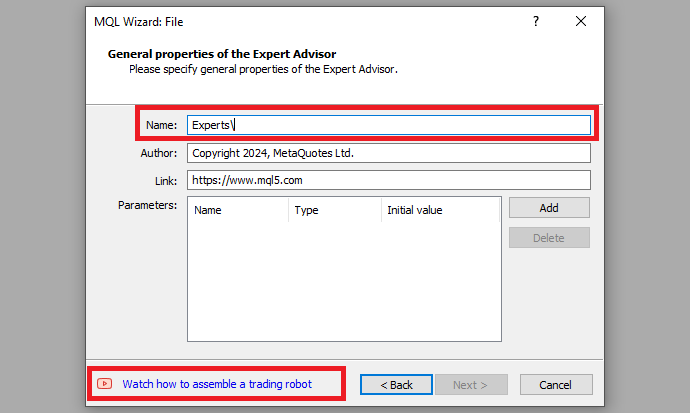
After providing your desired Expert Advisor file name, click on Next, click Next, and then click Finish. After doing all that, we are now ready to code and program our strategy.
First, we start by defining some metadata about the Expert Advisor (EA). This includes the name of the EA, the copyright information, and a link to the MetaQuotes website. We also specify the version of the EA, which is set to "1.00".
//+------------------------------------------------------------------+
//|                                               #1. RAPID FIRE.mq5 |
//|                                  Copyright 2024, MetaQuotes Ltd. |
//|                                             https://www.mql5.com |
//+------------------------------------------------------------------+

#property copyright "Copyright 2024, MetaQuotes Ltd."   // Set the copyright property for the Expert Advisor
#property link      "https://www.mql5.com"              // Set the link property for the Expert Advisor
#property version   "1.00"                              // Set the version of the Expert Advisor
When loading the program, information that depicts the one shown below is realized.
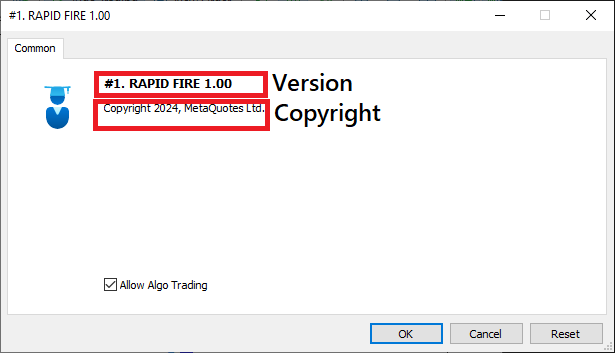
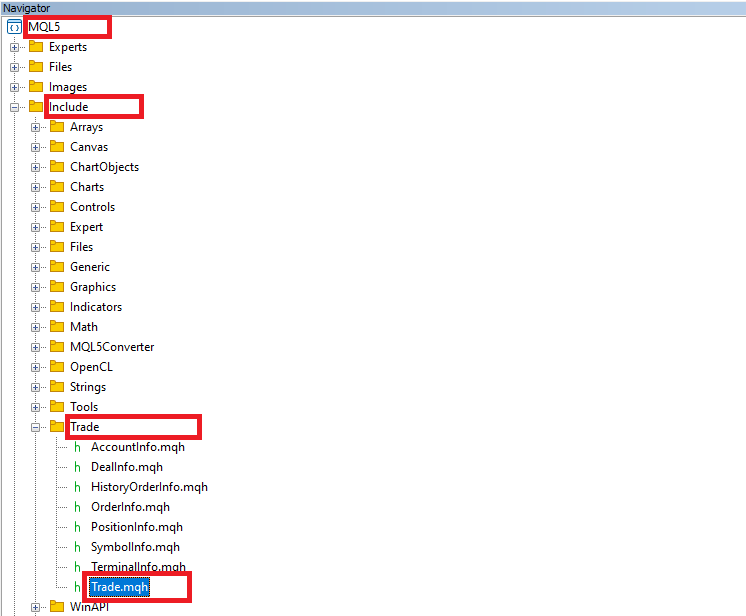
First, we include a trade instance by using #include at the beginning of the source code. This gives us access to the CTrade class, which we will use to create a trade object. This is crucial as we need it to open trades.
#include <Trade/Trade.mqh>   // Include the MQL5 standard library for trading operations
CTrade obj_Trade;            // Create an instance of the CTrade class to handle trade operations
The preprocessor will replace the line #include <Trade/Trade.mqh> with the content of the file Trade.mqh. Angle brackets indicate that the Trade.mqh file will be taken from the standard directory (usually it is terminal_installation_directory\MQL5\Include). The current directory is not included in the search. The line can be placed anywhere in the program, but usually, all inclusions are placed at the beginning of the source code, for a better code structure and easier reference. Declaration of the obj_Trade object of the CTrade class will give us access to the methods contained in that class easily, thanks to the MQL5 developers.
We will need to create indicator handles so that we can include the necessary indicators in the strategy.
int handleSMA = INVALID_HANDLE, handleSAR = INVALID_HANDLE; // Initialize handles for SMA and SAR indicators
Here, we first declare and initialize two integer variables, "handleSMA" and "handleSAR". These will serve as handles for two of the technical indicators we plan to use in our Expert Advisor. In MQL5, a handle is a unique identifier assigned to an indicator when we create it using specific MQL5 functions. We will use the identifiers to reference the non-painted indicators anywhere in the program. We have also assigned both identifiers to an INVALID_HANDLE constant, which ensures that the program won't reference an invalid handle if we get lazy and forget to check the program's flow logic after it has been compiled. Both indicators will do their work without any problems if we handle them correctly and avoid referencing an invalid handle or doing anything stupid without checking the handles first.
Next, we will need to create arrays where we store the values or data that we retrieve from the indicators.
double sma_data[], sar_data[]; // Arrays to store SMA and SAR indicator data
Here, we define two dynamic arrays, "sma_data" and "sar_data", to which we will assign the data points generated by the SMA (Simple Moving Average) and the SAR (Parabolic SAR) indicators. We assign the most recent values calculated by each indicator to these arrays, leaving them free to reference and analyze the data when generating trading signals. Trading signals can be generated from a signal line crossover. To generate a signal trading with the current trend or a reversal of the current trend, we can make use of the past values held in these arrays. By making use of these past values, we should be able to more accurately interpret our indicators and the price action of the asset being traded.
Next, we need the OnInit event handler. The handler is essential because it is automatically called when the Expert Advisor (EA) is initialized on a chart. This function is responsible for setting up the EA, including creating necessary indicator handles, initializing variables, and preparing resources. In other words, OnInit is an in-built function that ensures that everything is properly configured before the EA begins processing market data. It is as follows.
//+------------------------------------------------------------------+
//| Expert initialization function                                   |
//+------------------------------------------------------------------+
int OnInit(){
   // OnInit is called when the EA is initialized on the chart
//...
}
On the OnInit event handler, we need to initialize the indicator handles so that data values are assigned to them.
handleSMA = iMA(_Symbol,PERIOD_M1,60,0,MODE_SMA,PRICE_CLOSE); // Create an SMA (Simple Moving Average) indicator handle for the M1 timeframe
Here, we use the iMA function to create a handle for the Simple Moving Average (SMA) indicator. The handle will give us access to the SMA values for whatever trading symbol and timeframe we specify. Here, we set it up for the current trading symbol (_Symbol) on a 1-minute chart (PERIOD_M1), over a period of 60 bars. The parameter "0" indicates that there is no shift in the SMA calculation, while the demand to calculate the mode is specified with the constant MODE_SMA; hence, we will be calculating a simple moving average. Finally, we specify the price type PRICE_CLOSE, which means the indicator will be based on the closing prices of each bar. We store the resulting handle in the variable "handleSMA". Next, we create the handle for the Parabolic SAR indicator.
handleSAR = iSAR(_Symbol,PERIOD_M1,0.02,0.2); // Create a SAR (Parabolic SAR) indicator handle for the M1 timeframe
Similarly, we create a handle for the Parabolic SAR (SAR) indicator using the iSAR function. The iSAR function returns the values of the Parabolic SAR for a specific trading symbol and timeframe. In our case, we use it for the current trading symbol (_Symbol) on the 1-minute chart (PERIOD_M1). The parameters 0.02 and 0.2 define the step and maximum value of the SAR, which means they control how sensitive the indicator will be to price movements. The resulting handle will let us access SAR data that will be central to our first trading strategy, which relies on market trends and price reversals.
By default, the indicator handle starts from 10 and progresses with an interval of 1. So if we print the indicator values, we should have 10 and 11 since we have two handles. To visualize their values, let us log them.
   Print("SMA Handle = ",handleSMA);
   Print("SAR Handle = ",handleSAR);
The values we get are as below:
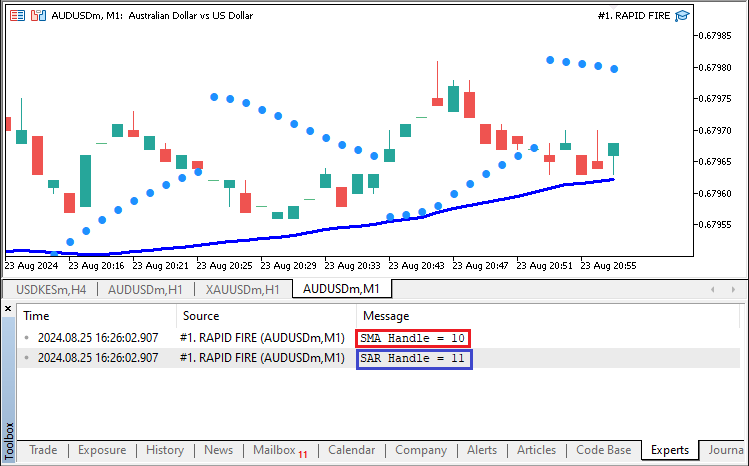
Now we log the values correctly. Next, let us make sure that the indicator handles are indeed not empty.
   // Check if the handles for either the SMA or SAR are invalid (indicating failure)
   if (handleSMA == INVALID_HANDLE || handleSAR == INVALID_HANDLE){
      Print("ERROR: FAILED TO CREATE SMA/SAR HANDLE. REVERTING NOW");  // Print error message in case of failure
      return (INIT_FAILED);  // Return failure code, stopping the EA from running
   }
In this section, we set up a mechanism to catch critical errors that occur during the SMA and SAR indicator handle creation. If these handles are not created successfully, the Expert Advisor cannot function correctly. Thus, we check to see whether "handleSMA" or "handleSAR" has remained equal to INVALID_HANDLE, which would indicate an unsuccessful initialization of either of these two indicators. If we find that either of these handles is invalid, we print an error message ("ERROR: FAILED TO CREATE SMA/SAR HANDLE. REVERTING NOW.") and return the INIT_FAILED value from the initialization function. These actions together constitute a graceful error-handling routine and serve to ensure that the EA can make unsafe trading decisions. Then, we need to set the storage arrays as time series. This is achieved via the following code snippet:
   // Configure the SMA and SAR data arrays to work as series, with the newest data at index 0
   ArraySetAsSeries(sma_data,true);
   ArraySetAsSeries(sar_data,true);
We set up our storage arrays to operate as time series data, with the most recent information located at index 0. We accomplish this using the ArraySetAsSeries function and the two arrays ("sma_data" and "sar_data") as the first argument, with true as the second argument to ensure the arrays are treated as series. This is a necessary step for accessing the latest indicator values at the ordinary decision times in the trading logic when the data represented by the indicator would have been spit out to the trading decision-making routine. The next part of the logic references both a series of current and past values for the two indicators. Finally, if we reach this point, it means that everything is initialized correctly and thus we return a successful initialization instance.
return(INIT_SUCCEEDED); // Return success code to indicate successful initialization
Up to this point, everything in the initialization section worked correctly. The full source code responsible for the program initialization is as follows:
//+------------------------------------------------------------------+
//| Expert initialization function                                   |
//+------------------------------------------------------------------+
int OnInit(){
   // OnInit is called when the EA is initialized on the chart

   handleSMA = iMA(_Symbol,PERIOD_M1,60,0,MODE_SMA,PRICE_CLOSE);  // Create an SMA (Simple Moving Average) indicator handle for the M1 timeframe
   handleSAR = iSAR(_Symbol,PERIOD_M1,0.02,0.2);                  // Create a SAR (Parabolic SAR) indicator handle for the M1 timeframe

   Print("SMA Handle = ",handleSMA);
   Print("SAR Handle = ",handleSAR);

   // Check if the handles for either the SMA or SAR are invalid (indicating failure)
   if (handleSMA == INVALID_HANDLE || handleSAR == INVALID_HANDLE){
      Print("ERROR: FAILED TO CREATE SMA/SAR HANDLE. REVERTING NOW");  // Print error message in case of failure
      return (INIT_FAILED);  // Return failure code, stopping the EA from running
   }

   // Configure the SMA and SAR data arrays to work as series, with the newest data at index 0
   ArraySetAsSeries(sma_data,true);
   ArraySetAsSeries(sar_data,true);

   return(INIT_SUCCEEDED);  // Return success code to indicate successful initialization
}
Next, we move on to the OnDeinit event handler, which is a function called when the program is deinitialized.
//+------------------------------------------------------------------+
//| Expert deinitialization function                                 |
//+------------------------------------------------------------------+
void OnDeinit(const int reason){
   // OnDeinit is called when the EA is removed from the chart or terminated
//...
}
The OnDeinit function gets invoked when the Expert Advisor (EA) is removed from the chart or when the terminal shuts down. We have to use this event handler to ensure correct upkeep and resource management. When the EA terminates, we must release any handles to indicators we created in the initialization phase. If we didn't do this, we could be leaving behind memory locations that we used, which would be inefficient; we certainly did not want to risk leaving behind any resources that we didn't need. This is why OnDeinit is important and why cleanup steps are critical in any programming environment.
   // Release the indicator handles to free up resources
   IndicatorRelease(handleSMA);
   IndicatorRelease(handleSAR);
We clean up every resource we set aside for use. To perform this cleanup, we use the IndicatorRelease function, which we call separately for each handle we allocated and initialized, just as we stored them away when we first began using them. This ensures we free up the resources in the reverse order of their allocation. Here, we specifically look at the SMA and SAR indicators. The cleanup is crucial to maintaining the platform's performance, especially if you are using multiple Expert Advisors or running the platform for extended periods. Thus, the full source code for the resources free-up is as follows:
//+------------------------------------------------------------------+
//| Expert deinitialization function                                 |
//+------------------------------------------------------------------+
void OnDeinit(const int reason){
   // OnDeinit is called when the EA is removed from the chart or terminated

   // Release the indicator handles to free up resources
   IndicatorRelease(handleSMA);
   IndicatorRelease(handleSAR);
}
Next, we need to check for trading opportunities whenever there are price updates. This is achieved on the OnTick event handler.
//+------------------------------------------------------------------+
//| Expert tick function                                             |
//+------------------------------------------------------------------+
void OnTick(){
   // OnTick is called whenever there is a new market tick (price update)

//...

}
The event-handler function, OnTick, executes and processes recent price information every time there is a new tick or a change in market conditions. It is an essential part of the operation of our Expert Advisor (EA) because it is where we run our trading logic, the trading conditions of which are, hopefully, structured to yield profitable trades. When the market data changes, we assess the current state of the market and make decisions regarding whether to open or close a position. The function executes as often as market conditions change, ensuring that our strategy operates in real-time and is responsive to current prices and changes in the values of our market indicators.
To stay updated with the current market conditions, we need to get the values of the current price quotes.
   double Ask = NormalizeDouble(SymbolInfoDouble(_Symbol,SYMBOL_ASK),_Digits);  // Get and normalize the Ask price
   double Bid = NormalizeDouble(SymbolInfoDouble(_Symbol,SYMBOL_BID),_Digits);  // Get and normalize the Bid price
Here, we obtain the most current Ask and Bid prices for the traded symbol. To get these prices, we use the SymbolInfoDouble function. For the Ask price, we specify SYMBOL_ASK, and for the Bid price, we specify SYMBOL_BID. After we obtain the prices, we use the NormalizeDouble function to round the prices to the number of decimal places defined by _Digits. This step is crucial because it ensures that our trading operations are performed using prices that are both standardized and accurate. If we didn't round the prices, floating-point inaccuracies could yield misleading results in operation price calculations. We then copy the indicator values for use in analysis and trade operations.
   // Retrieve the last 3 values of the SMA indicator into the sma_data array
   if (CopyBuffer(handleSMA,0,0,3,sma_data) < 3){
      Print("ERROR: NOT ENOUGH DATA FROM SMA FOR FURTHER ANALYSIS. REVERTING");  // Print error if insufficient SMA data
      return;  // Exit the function if not enough data is available
   }
We use the CopyBuffer function to retrieve the three most recent values of the Simple Moving Average indicator. The CopyBuffer function takes as input the SMA indicator handle, the SMA data buffer index, the starting position (in this case, the most recent value), the number of values to retrieve (three), and the array to store the data (sma_data). After we have copied the SMA values into the array, we check to see if they copied correctly. If there is an error at this point, we print an error message to the log and exit the function to avoid proceeding with our trading logic based on potentially faulty or incomplete data.
Similarly, we use the CopyBuffer function to retrieve the SAR indicator data. The following code snippet is employed.
   // Retrieve the last 3 values of the SAR indicator into the sar_data array
   if (CopyBuffer(handleSAR,0,0,3,sar_data) < 3){
      Print("ERROR: NOT ENOUGH DATA FROM SAR FOR FURTHER ANALYSIS. REVERTING");  // Print error if insufficient SAR data
      return;  // Exit the function if not enough data is available
   }
All that you need to know right now is the starting index of the bar to store data from and the buffer index. Let us visualize them as below:
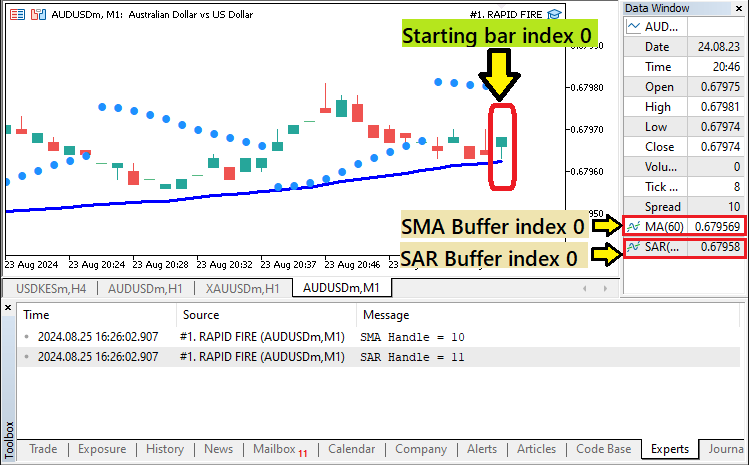
Let us print their data to the journal so we can see if we correctly get their data.
   ArrayPrint(sma_data,_Digits," , ");
   ArrayPrint(sar_data,_Digits," , ");
We use the ArrayPrint function to show the contents of the "sma_data" and "sar_data" arrays. ArrayPrint is a basic function that prints the contents of an array to the terminal. It’s good for preparing simple visualizations of the data being worked with. To use the function, you need to pass it three pieces of information:
- The array you want to print ("sma_data" or "sar_data").
- The precision you want for the displayed values (_Digits), determines how many decimal places will be shown.
- The delimiter is to be used between the printed values (", ") in the output.
By printing the contents of the SMA and SAR arrays, we can keep track of the actual numbers our algorithm is using, which is helpful for debugging purposes. We can also check this data in a backtest to ascertain that we indeed get the required data.
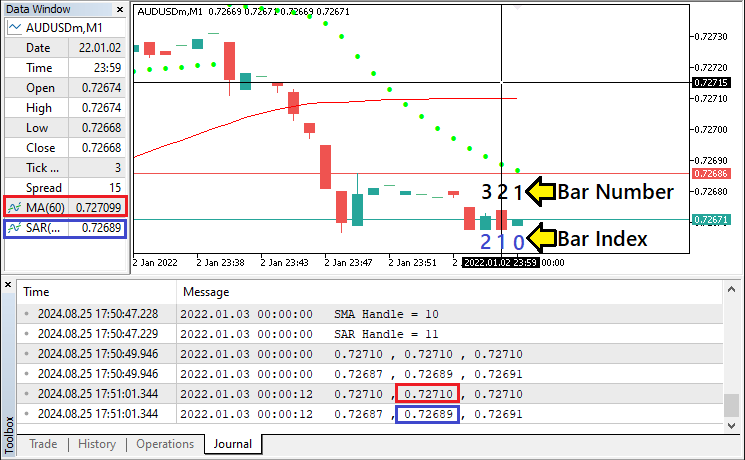
From the picture, we can see that the data is correctly retrieved and stored. The data in red color represents the Moving Average data while the data in blue color represents the SAR data. From the crosshair, we are referencing the second bar and index 1. It is now clear that we get data 3 data values retrieved, just as requested. We can proceed to get the necessary bar values.
   // Get the low prices for the current and previous bars on the M1 timeframe
   double low0 = iLow(_Symbol,PERIOD_M1,0);  // Low of the current bar
   double low1 = iLow(_Symbol,PERIOD_M1,1);  // Low of the previous bar
Here, we extract the low prices from the current and previous bars on the 1-minute timeframe using the iLow function. The first parameter, _Symbol, automatically adjusts to the trading instrument for which the Expert Advisor is operating (for instance, EUR/USD). The second parameter, PERIOD_M1, tells the system that we are working on the 1-minute chart; this is vital because the rapid-fire strategy is predicated on making short-term trades based on rapid price movements. The third parameter, 0, in "iLow(_Symbol, PERIOD_M1, 0)", indicates that we want the low price of the current bar that is in the process of being formed. Similarly, in "iLow(_Symbol, PERIOD_M1, 1)", the 1 signals that we want the low price of the previous completed bar. We store the retrieved values in the "double" data type variables "low0" and "low1" respectively.
Similarly, to retrieve the high prices for the current and previous bars, a similar logic is adopted.
   // Get the high prices for the current and previous bars on the M1 timeframe
   double high0 = iHigh(_Symbol,PERIOD_M1,0);  // High of the current bar
   double high1 = iHigh(_Symbol,PERIOD_M1,1);  // High of the previous bar
Here, the only thing that changes is the function used, iHigh, which retrieves the high data for the specified bar index and timeframe. To confirm the data that we get is correct, let us print it again using the Print function.
   Print("High bar 0 = ",high0,", High bar 1 = ",high1);
   Print("Low bar 0 = ",low0,", Low bar 1 = ",low1);
Data confirmation is as below:
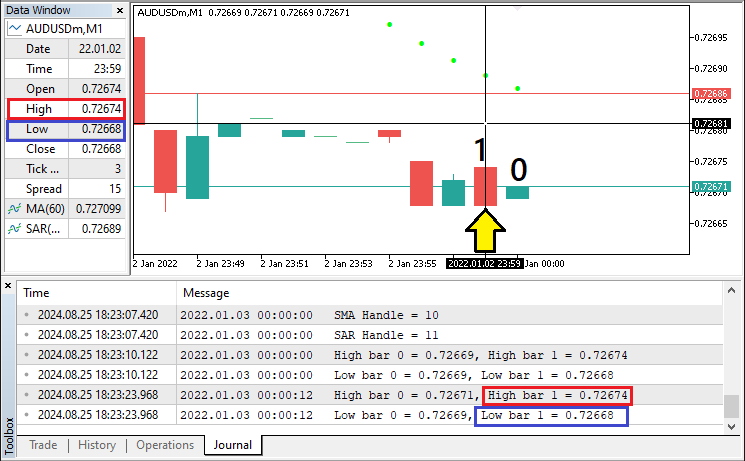
That was a success. We can now move on to crafting the trading logic. However, we don't need to execute the trading logic on every tick. Thus, let us craft a mechanism to ensure we trade only once per bar.
   // Define a static variable to track the last time a signal was generated
   static datetime signalTime = 0;
   datetime currTime0 = iTime(_Symbol,PERIOD_M1,0);  // Get the time of the current bar
In this section, we create a variable, "signalTime", to keep track of when the last trading signal was generated. We make this variable static to ensure that it maintains its value between calls to the OnTick function. If "signalTime" did not have static storage duration, it would be allocated each time the OnTick was called, and its value would be gone after OnTick finished executing. We want the signal time to be set only once for each bar, and we want it to keep its value until the next bar starts. Thus, we set it to 0 at the beginning so that it has a value only after the first signal is generated. To prevent it from generating a second (or multiple) signal during the same bar, we will compare the time of the current bar with the value stored in the variable. Afterward, we can now define the trading logic.
   // Check for BUY signal conditions:
   // - Current SAR is below the current low (bullish)
   // - Previous SAR was above the previous high (bullish reversal)
   // - SMA is below the current Ask price (indicating upward momentum)
   // - No other positions are currently open (PositionsTotal() == 0)
   // - The signal hasn't already been generated on the current bar
   if (sar_data[0] < low0 && sar_data[1] > high1 && signalTime != currTime0
      && sma_data[0] < Ask && PositionsTotal() == 0){
      Print("BUY SIGNAL @ ",TimeCurrent());  // Print buy signal with timestamp
      signalTime = currTime0;  // Update the signal time to the current bar time
   }
Here, we verify the conditions for issuing a buy signal based on the simultaneous behavior of the Parabolic SAR and SMA indicators, alongside a couple of other constraints. To qualify for a bullish signal from the Parabolic SAR, the current SAR value ("sar_data[0]") must be below the current low price ("low0"). At the same time, the previous SAR value ("sar_data[1]") must have been above the previous high price ("high1"). To qualify for a bullish SMA signal, the SMA must be below the current Ask price ("sma_data[0] < Ask").
In addition, we verify that there aren't any other open positions (PositionsTotal == 0). We wouldn't want to open multiple trades at the same time. We then make sure that the signal hasn't been generated for the current bar by comparing "signalTime" with "currTime0". If all of these checks pass, we print a message announcing the generation of a buy signal. We also update the signal time variable to the current time. That neat little trick is what allows us to limit the signal generation to just one time per bar. In the end, what we're doing is making sure that the EA is only reacting to certain market conditions and isn't doing any unnecessary work. The results we get are as below:
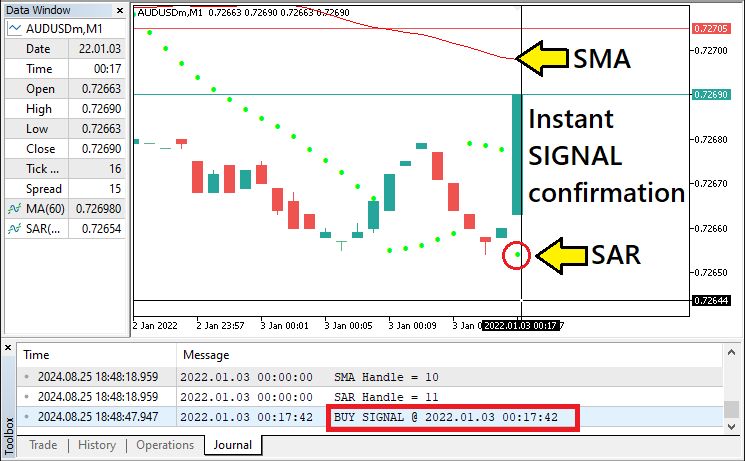
Since we get the signal, let us then proceed to open buy positions.
obj_Trade.Buy(0.01,_Symbol,Ask,Ask-150*_Point,Ask+100*_Point); // Execute a buy order with a lot size of 0.01, stop loss and take profit
Here, we execute a buy order using the "Buy" method from the CTrade class (represented by the "obj_Trade" object that we created). Here's a breakdown of the parameters:
- 0.01: This is the lot size of the trade. Here, we are specifying a small position size of 0.01 lots.
- _Symbol: This represents the trading symbol (currency pair, stock, etc.) that the Expert Advisor is attached to. The symbol is automatically detected by using the built-in _Symbol variable.
- Ask: This is the price at which the buy order will be executed, which is the current Ask price in the market. The Ask price is typically used for buying trades.
- Ask - 150 * _Point: This is the stop loss level. We set the stop loss 150 points below the Ask price to limit potential losses in case the market moves against the trade.
- Ask + 100 * _Point: This is the take profit level. We set the take profit 100 points above the Ask price, meaning that the trade will automatically close when the market reaches this profit level.
By placing this order, we are instructing the Expert Advisor to open a buy trade at the current Ask price, with predefined stop loss and take profit levels to manage risk and reward. The final code snippet for confirming buy signals and opening buy orders is as follows:
   // Check for BUY signal conditions:
   // - Current SAR is below the current low (bullish)
   // - Previous SAR was above the previous high (bullish reversal)
   // - SMA is below the current Ask price (indicating upward momentum)
   // - No other positions are currently open (PositionsTotal() == 0)
   // - The signal hasn't already been generated on the current bar
   if (sar_data[0] < low0 && sar_data[1] > high1 && signalTime != currTime0
      && sma_data[0] < Ask && PositionsTotal() == 0){
      Print("BUY SIGNAL @ ",TimeCurrent());  // Print buy signal with timestamp
      signalTime = currTime0;  // Update the signal time to the current bar time
      obj_Trade.Buy(0.01,_Symbol,Ask,Ask-150*_Point,Ask+100*_Point);  // Execute a buy order with a lot size of 0.01, stop loss and take profit
   }
To confirm a sell signal and open a sell order, similar logic applies.
   // Check for SELL signal conditions:
   // - Current SAR is above the current high (bearish)
   // - Previous SAR was below the previous low (bearish reversal)
   // - SMA is above the current Bid price (indicating downward momentum)
   // - No other positions are currently open (PositionsTotal() == 0)
   // - The signal hasn't already been generated on the current bar
   else if (sar_data[0] > high0 && sar_data[1] < low1 && signalTime != currTime0
      && sma_data[0] > Bid && PositionsTotal() == 0){
      Print("SELL SIGNAL @ ",TimeCurrent());  // Print sell signal with timestamp
      signalTime = currTime0;  // Update the signal time to the current bar time
      obj_Trade.Sell(0.01,_Symbol,Bid,Bid+150*_Point,Bid-100*_Point);  // Execute a sell order with a lot size of 0.01, stop loss and take profit
   }
Here, we implement a sell trade logic that will execute when specific market conditions are present. We first check whether the Parabolic SAR (SAR) indicator suggests a bearish trend. We do this by comparing the most recent SAR data to the bar's prices. The SAR should be above the bar's high for the current candle ("sar_data[0] > high0"), and the previous SAR value was below the previous bar's low price ("sar_data[1] < low1"), which indicates a possible bearish reversal. The SAR's trend indication can be "safe to trade" momentum. Then we check the SMA. It should be above the Bid price ("sma_data[0] > Bid"), which indicates a "safe to trade" possible downtrend.
When all the aforementioned conditions have been met, we signal a sell and log it ("Print("SELL SIGNAL @ ", TimeCurrent())"). The "signalTime" variable records the current bar's time; this is important because we must ensure that we do not issue more than one sell signal per bar. To execute the trade, we use the object function "obj_Trade.Sell". We systematically enter the market at points in time when potential bearish reversals may occur. We do this with an eye toward the risk that we are taking. And we manage that risk using stop loss and take profit orders. The sell confirmation setup is as below:
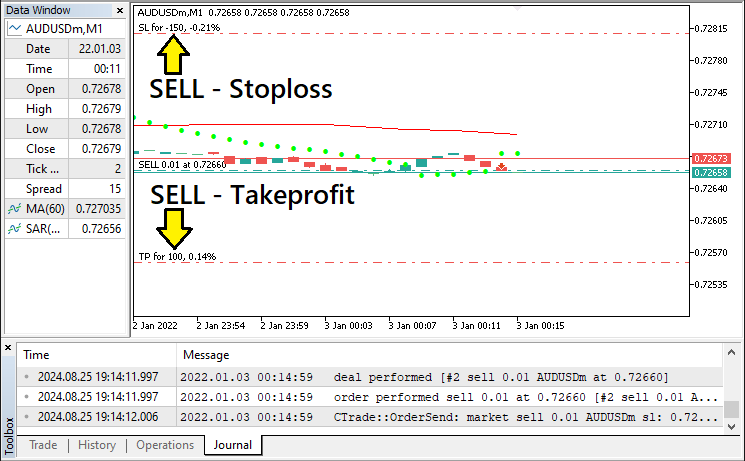
Up to this point, it is now clear that we have correctly crafted the Rapid-Fire Expert Advisor algorithm. Thus, the full OnTick source code responsible for confirming trades and opening positions is as follows:
//+------------------------------------------------------------------+
//| Expert tick function                                             |
//+------------------------------------------------------------------+
void OnTick(){
   // OnTick is called whenever there is a new market tick (price update)

   double Ask = NormalizeDouble(SymbolInfoDouble(_Symbol,SYMBOL_ASK),_Digits);  // Get and normalize the Ask price
   double Bid = NormalizeDouble(SymbolInfoDouble(_Symbol,SYMBOL_BID),_Digits);  // Get and normalize the Bid price

   // Retrieve the last 3 values of the SMA indicator into the sma_data array
   if (CopyBuffer(handleSMA,0,0,3,sma_data) < 3){
      Print("ERROR: NOT ENOUGH DATA FROM SMA FOR FURTHER ANALYSIS. REVERTING");  // Print error if insufficient SMA data
      return;  // Exit the function if not enough data is available
   }

   // Retrieve the last 3 values of the SAR indicator into the sar_data array
   if (CopyBuffer(handleSAR,0,0,3,sar_data) < 3){
      Print("ERROR: NOT ENOUGH DATA FROM SAR FOR FURTHER ANALYSIS. REVERTING");  // Print error if insufficient SAR data
      return;  // Exit the function if not enough data is available
   }

   //ArrayPrint(sma_data,_Digits," , ");
   //ArrayPrint(sar_data,_Digits," , ");

   // Get the low prices for the current and previous bars on the M1 timeframe
   double low0 = iLow(_Symbol,PERIOD_M1,0);  // Low of the current bar
   double low1 = iLow(_Symbol,PERIOD_M1,1);  // Low of the previous bar

   // Get the high prices for the current and previous bars on the M1 timeframe
   double high0 = iHigh(_Symbol,PERIOD_M1,0);  // High of the current bar
   double high1 = iHigh(_Symbol,PERIOD_M1,1);  // High of the previous bar

   //Print("High bar 0 = ",high0,", High bar 1 = ",high1);
   //Print("Low bar 0 = ",low0,", Low bar 1 = ",low1);

   // Define a static variable to track the last time a signal was generated
   static datetime signalTime = 0;
   datetime currTime0 = iTime(_Symbol,PERIOD_M1,0);  // Get the time of the current bar

   // Check for BUY signal conditions:
   // - Current SAR is below the current low (bullish)
   // - Previous SAR was above the previous high (bullish reversal)
   // - SMA is below the current Ask price (indicating upward momentum)
   // - No other positions are currently open (PositionsTotal() == 0)
   // - The signal hasn't already been generated on the current bar
   if (sar_data[0] < low0 && sar_data[1] > high1 && signalTime != currTime0
      && sma_data[0] < Ask && PositionsTotal() == 0){
      Print("BUY SIGNAL @ ",TimeCurrent());  // Print buy signal with timestamp
      signalTime = currTime0;  // Update the signal time to the current bar time
      obj_Trade.Buy(0.01,_Symbol,Ask,Ask-150*_Point,Ask+100*_Point);  // Execute a buy order with a lot size of 0.01, stop loss and take profit
   }

   // Check for SELL signal conditions:
   // - Current SAR is above the current high (bearish)
   // - Previous SAR was below the previous low (bearish reversal)
   // - SMA is above the current Bid price (indicating downward momentum)
   // - No other positions are currently open (PositionsTotal() == 0)
   // - The signal hasn't already been generated on the current bar
   else if (sar_data[0] > high0 && sar_data[1] < low1 && signalTime != currTime0
      && sma_data[0] > Bid && PositionsTotal() == 0){
      Print("SELL SIGNAL @ ",TimeCurrent());  // Print sell signal with timestamp
      signalTime = currTime0;  // Update the signal time to the current bar time
      obj_Trade.Sell(0.01,_Symbol,Bid,Bid+150*_Point,Bid-100*_Point);  // Execute a sell order with a lot size of 0.01, stop loss and take profit
   }
}
//+------------------------------------------------------------------+
Cheers to us for creating the program. Next, we need to do the testing of the Expert Advisor and optimize it for maximum gains. This is done in the next section.
Testing and Optimization
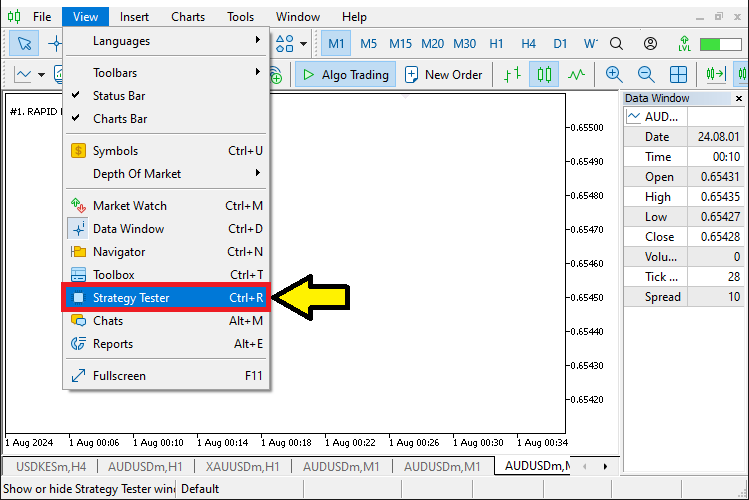
This section concentrates on the testing and optimization of our rapid-fire trading strategy using the MetaTrader 5 Strategy Tester. Testing is essential because we need to ensure that our Expert Advisor (EA) is functioning as it should and that it is performing well in a variety of market conditions. To begin testing our EA, we need to load it into the Strategy Tester, choose the desired trading symbol and timeframe (we have specified the M1 timeframe in our code), and set the testing period. By backtesting our EA, we can get a historical simulation of how our EA would have performed with the specified strategy and parameters. Of course, we try to identify any potential problems that could cause the EA to misfunction in a live trading scenario. To open the strategy tester, click on view, and select Strategy Tester.
Once it is opened, navigate to the overview tab, select "Visualize", switch to the settings tab, load the program, and set the desired settings. For our case, we will have the testing period for just this month so that we work with small data.
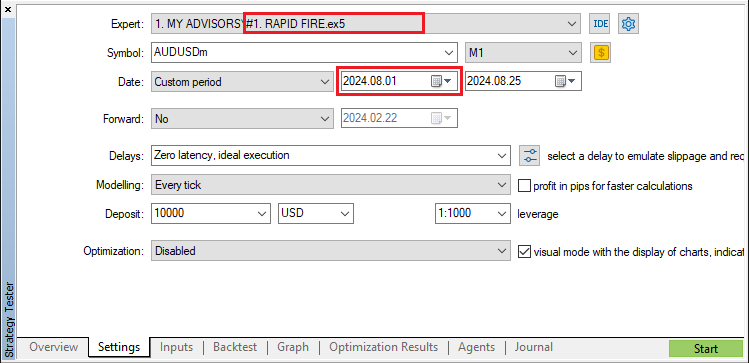
Upon testing, we have the following results:

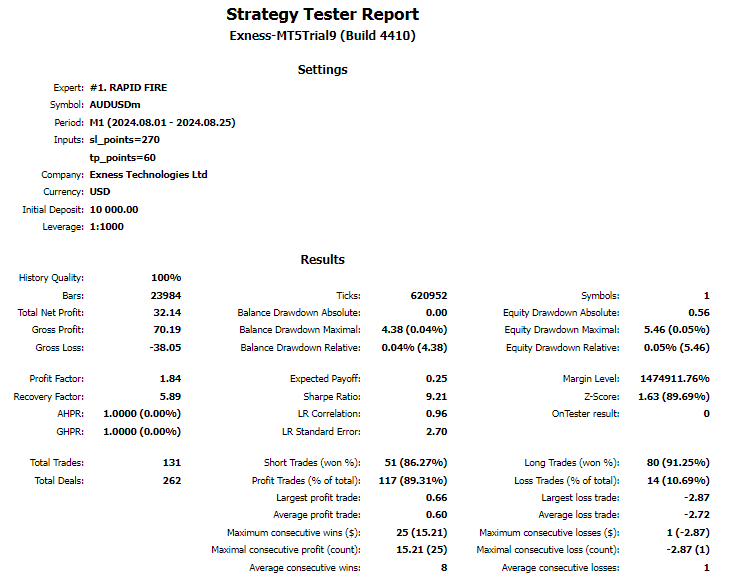
We need to take a close look at the results from the testing phase, concentrating on vital performance metrics like total net profit, maximum drawdown, and percentage of winning trades. These numbers will tell us how well (and how poorly) our strategy performs and give us some idea of its overall robustness. We'll also want to examine trade reports that the Strategy Tester produces. These reports will allow us to see the sorts of trades our EA is making (or not making) and give us a chance to understand its "reasoning" when it encounters various market conditions. If we're not happy with the results, we'll have to rework the strategy to look for better-performing parameter sets for the SMA and SAR indicators. Or we'll have to dig deeper into the strategy's overall logic to find out why it isn't performing any better than it does.
To find the best trading strategy, we have to tune it to the market. To do that, we use a method called "strategy optimization." Strategy optimization is not something we do once and forget about. We have to see how the system behaves under different configurations and then pick the configuration that gives us the most consistent results over all the tests we perform. When testing a strategy in this way, we are effectively finding the optimal parameters and using them as keys to unlock the trading strategy we're examining. After we find these keys, we have to run the strategy again and test it over a walkforward period. Otherwise, we're no better than someone who just guesses at the market's future direction. To optimize the system, we will need to have some inputs from where the iterations can take place. The following logic will be implemented.
input int sl_points = 150; // Stoploss points
input int tp_points = 100; // Takeprofit points
Upon optimization, we have the following results:
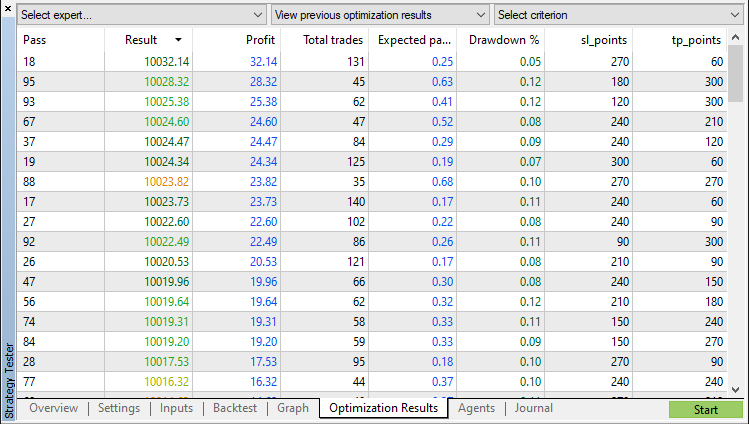
The optimized results graph resembles the one below:
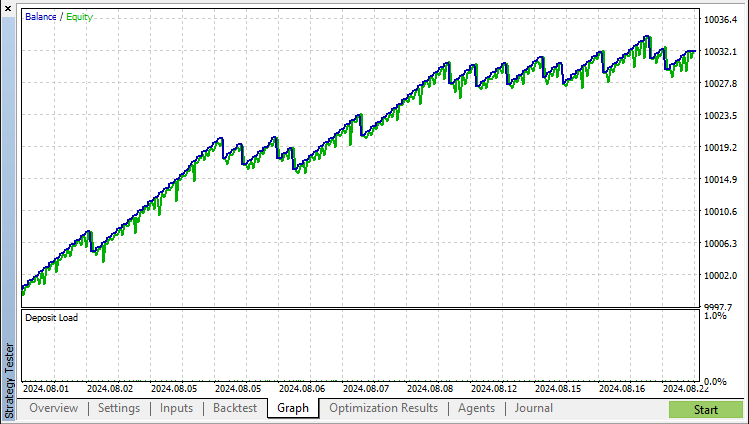
Finally, the test report is as shown below:
Conclusion
In this article, we discussed the development of a rapid-fire trading Expert Advisor (EA) in MQL5, which executes short, quick trades. The strategy relies on two main technical indicators: the Parabolic SAR, which signals trend reversals, and the Simple Moving Average (SMA), which gauges market momentum. These indicators form the core of the EA's trading logic.
We covered the implementation details, including configuring the indicators, setting up data handles, and managing trades to ensure the EA interacts effectively with the market. Finally, we emphasized the importance of testing and optimizing the EA using MetaTrader 5's Strategy Tester to ensure it meets our trading objectives. Despite being an automated system, the development process closely mirrors that of manual trading strategies.
Disclaimer: The information illustrated in this article is only for educational purposes. It is just intended to show insights on how to create a Rapid-Fire Strategy Expert Advisor (EA) based on the Price Action approach and thus should be used as a base for creating a better expert advisor with more optimization and data extraction taken into account. The information presented does not guarantee any trading results.
We do hope that you found the article helpful, fun, and easy to understand, in a way that you can make use of the presented knowledge in your development of future expert advisors. Technically, this eases your way of analyzing the market based on the Price Action approach and particularly the Rapid-Fire strategy. Enjoy.
 Developing a Replay System (Part 45): Chart Trade Project (IV)
 MQL5 Wizard Techniques you should know (Part 35): Support Vector Regression
 Reimagining Classic Strategies (Part VII) : Forex Markets And Sovereign Debt Analysis on the USDJPY
 Developing a Replay System (Part 44): Chart Trade Project (III)
- Free trading apps
- Over 8,000 signals for copying
- Economic news for exploring financial markets
You agree to website policy and terms of use
Hi Allen,
Can this strategy be achieved in MT4
@Qhumanani hello. Yes but it would require conversion. Thank you.
"When running backtests, there are buy and sell orders, but when running on a live account, there are no orders, even though the default settings are used and it has been running for 2 days."
You should consider checking any possible reasons in the log and confirm there are signals being generated.
Would be interesting to add the possibility of having risk management settings, by fixed lot size or a percentage of balance, thanks!
Very interesting, found this strategy after testing it manually!
Would be interesting to add the possibility of having risk management settings, by fixed lot size or a percentage of balance, thanks!
We're glad to hear that. We'll consider the idea. Thanks.