
Creating a Dynamic Multi-Symbol, Multi-Period Relative Strength Indicator (RSI) Indicator Dashboard in MQL5
Introduction
In this article, we will guide you through the process of creating a dynamic multi-symbol, multi-period RSI (Relative Strength Index) indicator dashboard in MetaQuotes Language 5 (MQL5) for MetaTrader 5 (MT5). This comprehensive guide will explore the definition, functionality, and practical applications of a custom RSI dashboard, as well as the steps required to develop it using MetaQuotes Language 5 (MQL5).
A dynamic RSI dashboard serves as a powerful tool for traders, providing a consolidated view of RSI values across multiple symbols and timeframes. This allows for a more informed decision-making process by identifying overbought or oversold conditions in the market. By visualizing RSI data in a single interface, traders can quickly assess market conditions and adapt their strategies accordingly.
We will cover the following key areas:
- Initialization of the Dashboard: Setting up the environment, creating main buttons, and displaying timeframes and symbols.
- Real-Time Updates: Implementing functionality to calculate and display RSI values dynamically, with updates based on live market data.
- Button Creation and Updating: Detailed explanation of functions used to create and update buttons, ensuring the dashboard is user-friendly and informative.
- Customization and Practical Use: How to customize the dashboard to suit individual trading needs and integrate it into your trading strategy.
By the end of this article, you will have a thorough understanding of how to build and utilize a multi-symbol, multi-period RSI dashboard in MQL5. This will enhance your trading toolkit, improve your ability to analyze market trends, and ultimately help you make more informed trading decisions. To achieve this, we will utilize the following topics:
- Overview and Elements Illustration
- Implementation in MQL5
- Conclusion
On this journey, we will extensively use MetaQuotes Language 5 (MQL5) as our base Integrated Development Environment (IDE) coding environment in MetaEditor, and execute the files on the MetaTrader 5 (MT5) trading terminal. Thus, having the versions mentioned above will be of prime importance. Let's dive into the intricacies of developing this powerful trading tool.
Overview and Elements Illustration
We will create a comprehensive dashboard that consolidates RSI values across multiple trading symbols and timeframes, providing traders with a powerful tool for market analysis. We will outline and cover everything in detail to ensure a thorough understanding. Our development will focus on the following key elements:
- Dashboard Initialization:
Main Button Creation: The first step in our initialization process will be to create a central button indicating the base and benchmark of the dashboard. This button will serve as the primary control for the dashboard and provide a focal point for the user interface. It will be strategically positioned at the top of the dashboard to provide easy access and clear visibility.
Timeframe Buttons: Next, we will create buttons representing different timeframes to feature the other indicator data from various symbol periods. These buttons will be arranged horizontally next to the main button and designed to display RSI values for each respective period. Each timeframe button will be labeled with the appropriate period abbreviation, allowing traders to quickly identify and make comparisons of data on different timeframes at a glance.
- Symbol Buttons:
Dynamic Symbol List: To provide a comprehensive view of the market, we will generate buttons for each trading symbol available in the user's MetaTrader 5 platform and added to the market watch. These buttons will be created dynamically and listed vertically below the main button. The currently active trading symbol will be highlighted with a distinct color (e.g., lime or green) to make it easily recognizable. This feature will ensure that traders can quickly identify the active symbol and monitor its RSI values in real-time.
Base Button: At the bottom of the symbol list, we will add a base button that spans the width of all the timeframe buttons combined. This button will be given the name of the dashboard, or rather its title, but can be used to display the state for the current symbol's signal or serve as a summary or footer for the symbol list. It will provide a clear demarcation between the symbol buttons and the RSI value display, ensuring that the dashboard is well-organized and easy to navigate.
- Real-Time Updates:
RSI Calculation: To ensure that the dashboard provides accurate and up-to-date information, we will calculate the RSI values for each symbol and timeframe in real time using in-built MQL5 functions. This function will compute the RSI based on the closing prices of the selected period, providing an essential indicator of market momentum. The RSI values will be stored in an array and updated at each tick to reflect the latest market data.
Dynamic Display: The calculated RSI values will be dynamically displayed on the corresponding buttons. To enhance visual clarity, we will implement a color-coding scheme based on predefined RSI thresholds. If the RSI value is below 30, indicating an oversold condition, the button's background color will change to green. If the RSI value is above 70, indicating an overbought condition, the background color will change to red. For RSI values between 30 and 70, the background color will remain white, indicating a neutral condition. This dynamic display will allow traders to quickly assess the market status and make informed trading decisions.
To illustrate the whole process, here is what we intend to have at the end.
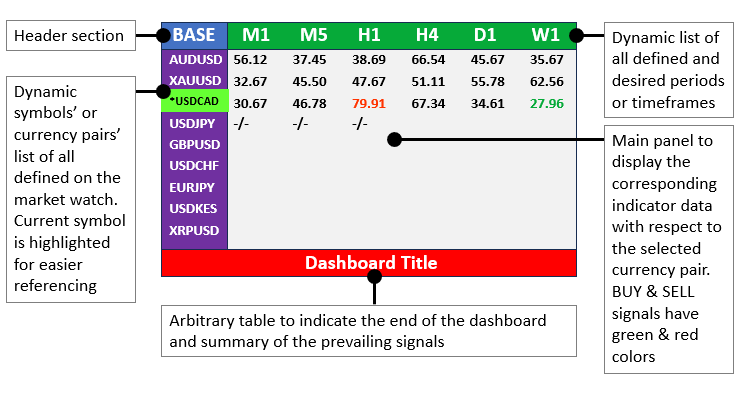
To illustrate the entire development process, we will break down each element into detailed steps, providing code snippets and explanations. By the end of this article, you will have a fully functional RSI dashboard that you can customize and integrate into your trading strategy.
Implementation in MQL5
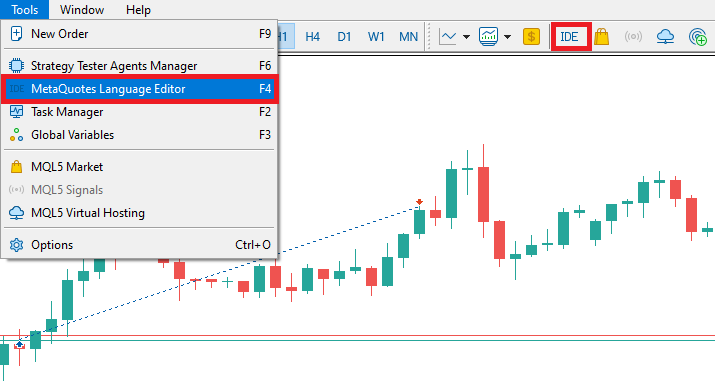
The indicator dashboard will be based on an expert advisor. To create an expert advisor (EA), on your MetaTrader 5 terminal, click the Tools tab and check MetaQuotes Language Editor, or press F4 on your keyboard. Alternatively, click the IDE (Integrated Development Environment) icon on the tools bar. This will open the MetaQuotes Language Editor environment, which allows the writing of trading robots, technical indicators, scripts, and libraries of functions.
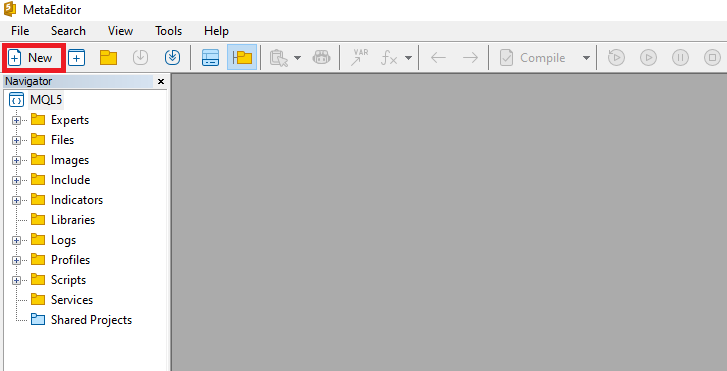
Once the MetaEditor is opened, on the tools bar, navigate to the File tab and check New File, or simply press CTRL + N, to create a new document. Alternatively, you can click on the New icon on the tools tab. This will result in a MQL Wizard pop-up.
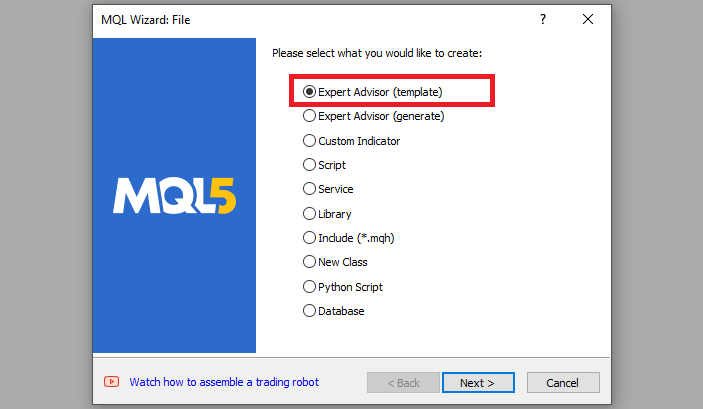
On the Wizard that pops, check Expert Advisor (template) and click Next.
On the general properties of the Expert Advisor, under the name section, provide your expert's file name. Note that to specify or create a folder if it doesn't exist, you use the backslash before the name of the EA. For example, here we have "Experts\" by default. That means that our EA will be created in the Experts folder and we can find it there. The other sections are pretty much straightforward, but you can follow the link at the bottom of the Wizard to know how to precisely undertake the process.
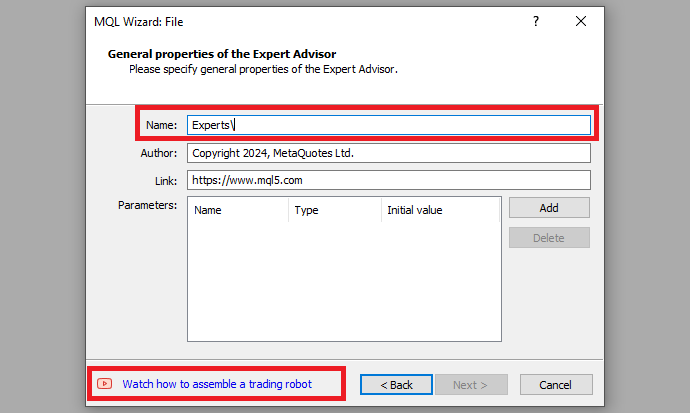
After providing your desired Expert Advisor file name, click on Next, click Next, and then click Finish. After doing all that, we are now ready to code and program our indicator dashboard.
First, we will need to create a function for the buttons that will be made. This will be of great use since it will enable us to reuse the same function when creating similar features rather than having to repeat the whole process when creating similar objects. It also will save us a lot of time and space making the process quick, straightforward, and code snippets short.
To create the buttons, we will create a function that takes 11 arguments or parameters.
//+------------------------------------------------------------------+
//| Function to create a button                                      |
//+------------------------------------------------------------------+
bool createButton(string objName, string text, int xD, int yD, int xS, int yS,
   color clrTxt, color clrBg, int fontSize = 12, color clrBorder = clrNONE,
   string font = "Arial Rounded MT Bold"
) {

...

}
The function signature illustrates everything. It is a boolean function that has the name "createButton", meaning that it will return two boolean flags, true or false, in case of success or failure respectively. To easily understand its parameters, let us outline and explain them individually below.
- objName (string): This parameter specifies the name of the button object. Each button must have a unique name to differentiate it from other objects on the chart. This name is used to reference the button for updates and modifications.
- text (string): Defines the text that will be displayed on the button. It can be any string, such as "RSI", "BUY", or any other label relevant to the button's purpose.
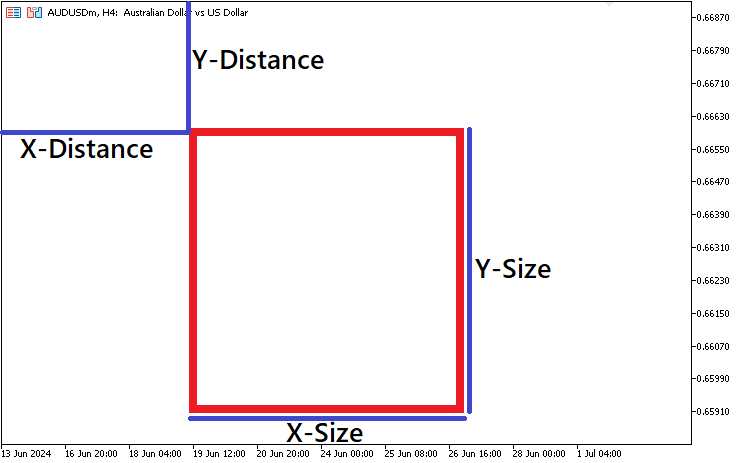
- xD (int): The parameter specifies the horizontal distance of the button from the specified corner of the chart. The unit is in pixels.
- yD (int): Similar to xD, this parameter defines the vertical distance of the button from the specified corner of the chart.
- xS (int): The parameter specifies the width of the button in pixels. It determines how wide the button will appear on the chart.
- yS (int): Defines the height of the button in pixels. It determines how tall the button will appear on the chart.
- clrTxt (color): This parameter sets the color of the text displayed on the button. The color can be specified using the predefined color constants in MQL5, such as clrBlack, clrWhite, clrRed, etc.
- clrBg (color): This defines the background color of the button. It is also specified using predefined color constants and determines the fill color of the button.
- fontSize (int): This optional parameter specifies the size of the font used for the button's text. It defaults to 12 if not provided. Font size determines the size of the text displayed on the button.
- clrBorder (color): This other optional parameter sets the color of the button's border. It defaults to "clrNONE" if not provided, meaning no border color is applied. If specified, the border color can enhance the button's visibility and aesthetics.
- font (string): Yet this other optional parameter defines the font type used for the button's text. It defaults to "Arial Rounded MT Bold" if not provided. The font determines the style of the text displayed on the button.
On the function signature, you should have noticed that some of the arguments are already initialized to some value. The initialization value represents the default value that will be assigned to that parameter in case it is ignored during the function call. For example, our default border color is none, meaning that if the color value is not specified during the function call, no color will be applied to the border of our rectangle label.
Inside the function body, housed by the curly brackets ({}), we define our object creation procedures.
   // Attempt to create the button
   if (!ObjectCreate(0, objName, OBJ_BUTTON, 0, 0, 0)) {
      Print(__FUNCTION__, ": failed to create Btn: ERR Code: ", GetLastError()); // Print error message if button creation fails
      return (false); // Return false if creation fails
   }
We start by using an if statement to check whether the object is not created. The ObjectCreate function, a boolean which takes 6 arguments, is used. This function creates an object with the specified name, type, and initial coordinates in the specified chart subwindow. First, we specify the chart window, 0 means the object is to be created on the main window. Then, we provide the object name. This is the name that will be uniquely assigned to a specific object. The type of object we want to create is of type "OBJ_BUTTON", signifying an object for creating and designing the custom indicator dashboard. We then proceed to provide the subwindow, 0 for the current subwindow. Finally, we provide the time and price values as zero (0) since we will not be attaching them to the chart but rather to the chart window coordinates. Pixels are used to set the mapping.
If the creation of the object fails, ultimately the ObjectCreate function returns false, clearly there is no point proceeding, we return with an error. In this case, we inform of the error by printing it to the journal beside the error code and returning false. There could be a previous error, and thus to get the latest error, we need to clear the previous error. This is achieved by calling the ResetLastError function, which is an in-built MQL5 function, just before our object creation logic.
ResetLastError(); // Reset the last error code
The purpose of the function is to set the value of the function GetLastError, which gets the error code of the last operation that encountered an error, to zero. By calling it, we ensure that any previous error codes are cleared before proceeding with the next operations. This step is essential because it allows us to handle fresh errors independently without interference from previous error states.
If we do not return up to this point, it means we created the object, and thus we can continue with the property update of the object. An in-built function "ObjectSet..." sets the value of the corresponding object property. The object property must be of the datetime, integer, color, boolean, or character type.
   // Set button properties
   ObjectSetInteger(0, objName, OBJPROP_XDISTANCE, xD); // Set X distance
   ObjectSetInteger(0, objName, OBJPROP_YDISTANCE, yD); // Set Y distance
   ObjectSetInteger(0, objName, OBJPROP_XSIZE, xS); // Set X size
   ObjectSetInteger(0, objName, OBJPROP_YSIZE, yS); // Set Y size
   ObjectSetInteger(0, objName, OBJPROP_CORNER, CORNER_RIGHT_UPPER); // Set corner position
   ObjectSetString(0, objName, OBJPROP_TEXT, text); // Set button text
   ObjectSetString(0, objName, OBJPROP_FONT, font); // Set font type
   ObjectSetInteger(0, objName, OBJPROP_FONTSIZE, fontSize); // Set font size
   ObjectSetInteger(0, objName, OBJPROP_COLOR, clrTxt); // Set text color
   ObjectSetInteger(0, objName, OBJPROP_BGCOLOR, clrBg); // Set background color
   ObjectSetInteger(0, objName, OBJPROP_BORDER_COLOR, clrBorder); // Set border color
   ObjectSetInteger(0, objName, OBJPROP_BACK, false); // Set background property
   ObjectSetInteger(0, objName, OBJPROP_STATE, false); // Set button state
   ObjectSetInteger(0, objName, OBJPROP_SELECTABLE, false); // Set if the button is selectable
   ObjectSetInteger(0, objName, OBJPROP_SELECTED, false); // Set if the button is selected
Let us concentrate on the first property logic.
ObjectSetInteger(0, objName, OBJPROP_XDISTANCE, xD); // Set X distance
Here, we use the in-built ObjectSetInteger function and pass the parameters respectively. The parameters are as described below.
- Chart id: This is the chart identifier. "0" refers to the current chart (chart ID). We’re adjusting the properties of an object within this chart.
- Name: This is the name of the object. "objName" represents the unique name assigned to the rectangle label object.
- Property id: This is the ID of the object property and its value can be one of the values of the "ENUM_OBJECT_PROPERTY_INTEGER" enumeration. "OBJPROP_XDISTANCE" specifies that we’re modifying the X distance property.
- Property value: This is the value of the property. The value assigned to "xD" determines how far to the right (or left, if negative) the top-left corner of our rectangle label will be positioned horizontally from the left edge of the chart.
Similarly, we set the other properties using the same format. "OBJPROP_YDISTANCE" configures the Y distance property of the rectangle label. The "yD" value determines how far the top-left corner of the rectangle label will be positioned vertically from the upper edge of the chart. In other words, it controls the vertical placement of the label within the chart area. This sets the Y distance from the corner. The "OBJPROP_XSIZE" and "OBJPROP_YSIZE" sets the width and height of the rectangle respectively.
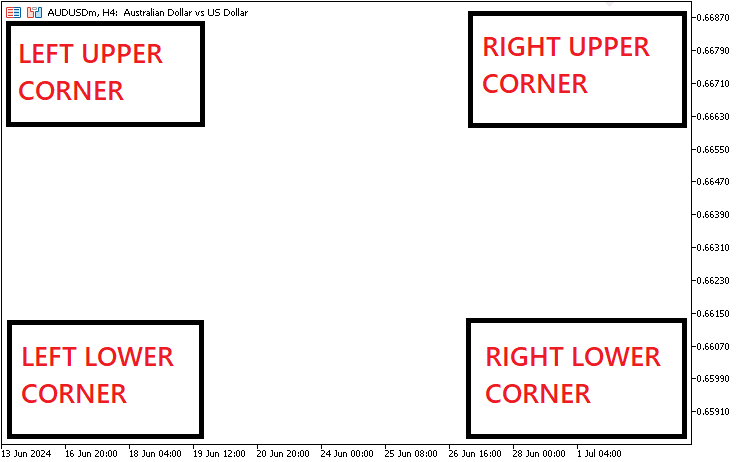
To position our object, we use the "OBJPROP_CORNER" property to determine the corner that we want our object to be on the chart window.
ObjectSetInteger(0, objName, OBJPROP_CORNER, CORNER_RIGHT_UPPER); // Set corner position
The property can only be of 4 types:
- CORNER_LEFT_UPPER: Center of coordinates is in the upper left corner of the chart.
- CORNER_LEFT_LOWER: Center of coordinates is in the lower left corner of the chart.
- CORNER_RIGHT_LOWER: Center of coordinates is in the lower right corner of the chart.
- CORNER_RIGHT_UPPER: Center of coordinates is in the upper right corner of the chart.
In a photographic representation, this is what we have.
The rest of the properties are straightforward. We added comments to them for easier understanding. Then, we just redraw the chart to make changes take effect automatically without having to wait for a change in price quotes or chart events.
ChartRedraw(0); // Redraw the chart to reflect the new button
Finally, we return true signifying that the creation and update of the object properties was a success.
return (true); // Return true if creation is successful
The full function code responsible for the creation of a button object on the chart window is as below.
//+------------------------------------------------------------------+
//| Function to create a button                                      |
//+------------------------------------------------------------------+
bool createButton(string objName, string text, int xD, int yD, int xS, int yS,
   color clrTxt, color clrBg, int fontSize = 12, color clrBorder = clrNONE,
   string font = "Arial Rounded MT Bold"
) {
   ResetLastError(); // Reset the last error code
   // Attempt to create the button
   if (!ObjectCreate(0, objName, OBJ_BUTTON, 0, 0, 0)) {
      Print(__FUNCTION__, ": failed to create Btn: ERR Code: ", GetLastError()); // Print error message if button creation fails
      return (false); // Return false if creation fails
   }
   // Set button properties
   ObjectSetInteger(0, objName, OBJPROP_XDISTANCE, xD); // Set X distance
   ObjectSetInteger(0, objName, OBJPROP_YDISTANCE, yD); // Set Y distance
   ObjectSetInteger(0, objName, OBJPROP_XSIZE, xS); // Set X size
   ObjectSetInteger(0, objName, OBJPROP_YSIZE, yS); // Set Y size
   ObjectSetInteger(0, objName, OBJPROP_CORNER, CORNER_RIGHT_UPPER); // Set corner position
   ObjectSetString(0, objName, OBJPROP_TEXT, text); // Set button text
   ObjectSetString(0, objName, OBJPROP_FONT, font); // Set font type
   ObjectSetInteger(0, objName, OBJPROP_FONTSIZE, fontSize); // Set font size
   ObjectSetInteger(0, objName, OBJPROP_COLOR, clrTxt); // Set text color
   ObjectSetInteger(0, objName, OBJPROP_BGCOLOR, clrBg); // Set background color
   ObjectSetInteger(0, objName, OBJPROP_BORDER_COLOR, clrBorder); // Set border color
   ObjectSetInteger(0, objName, OBJPROP_BACK, false); // Set background property
   ObjectSetInteger(0, objName, OBJPROP_STATE, false); // Set button state
   ObjectSetInteger(0, objName, OBJPROP_SELECTABLE, false); // Set if the button is selectable
   ObjectSetInteger(0, objName, OBJPROP_SELECTED, false); // Set if the button is selected

   ChartRedraw(0); // Redraw the chart to reflect the new button
   return (true); // Return true if creation is successful
}
Now that we have the function that we need to create a button, let us use it to create the indicator dashboard. We will need names of the object and to easily manage the interaction of the object names, it is much easier to define macros.
// Define button identifiers and properties
#define BTN1 "BTN1"
We use the #define keyword to define a macro named "BTN1" with the value "BTN1" to easily store our main button name, instead of having to repeatedly retype the name on every instance we create the button section, significantly saving us time and reducing the chances of wrongly providing the name. So basically, macros are used for text substitution during compilation.
Similarly, we define other macros that we will use.
#define Desc "Desc "
#define Symb "Symb "
#define Base "Base "
#define RSI "RSI "
#define XS1 90
#define XS2 100
#define YS1 25
#define clrW clrWhite
#define clrB clrBlack
#define clrW_Gray C'230,230,230'
Here, we use the macro "Desc" as a prefix for the names of buttons that describe various timeframes, allowing us to generate unique names for these description buttons by appending indices and additional strings, such as "Desc0", "Desc1", etc. Similarly, the macro "Symb" is used as a prefix for the names of buttons representing different trading symbols, helping us create unique identifiers like "Symb0", "Symb1", and so on. The macro "Base" serves as a prefix for the base button name, providing a clear and consistent naming convention for our dashboard components. To handle RSI-related buttons, we use the macro "RSI", ensuring unique identifiers for buttons displaying RSI values across different symbols and timeframes.
For dimensions, "XS1" will set the width for certain buttons, while "XS2" and "YS1" specify the width and height for other buttons, respectively, standardizing the size of our GUI elements. We define color macros, "clrW" and "clrB", to allow us to conveniently refer to white and black colors in our code. MQL5 has predefined color format variables and that is what we assign and refer to when we use "clrWhite" for a white color; the web colors.
Color format section 1: 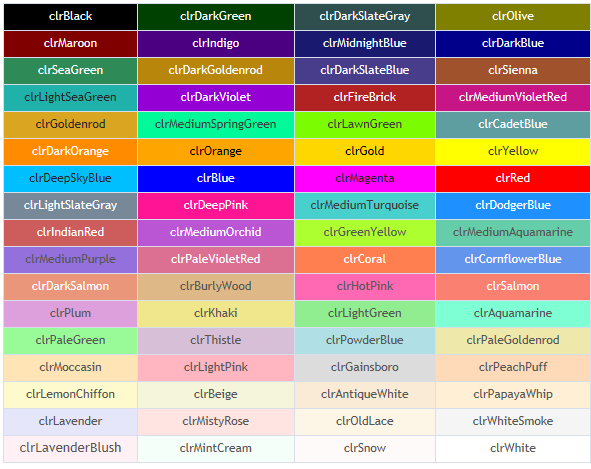
Color format section 2:
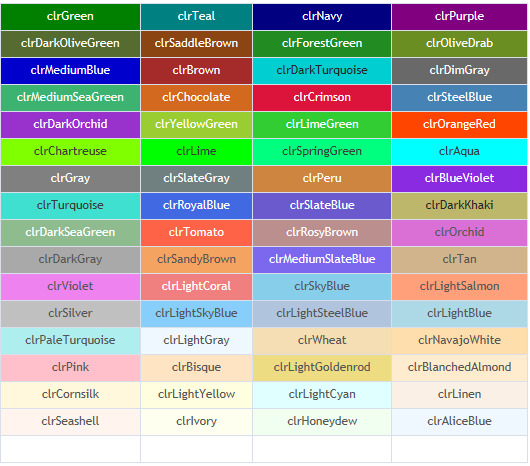
Additionally, we define a custom gray color as "clrW_Gray" C'230,230,230' to use as a background or border color, ensuring a consistent visual style across the dashboard. To gain more control over the colors, we represent the last macro in literals format. This takes the format "C'000,000,000'" where the triple zeros can be any numeral from 0 to 255. The format adopted is RGB (Red, Green, Blue) form. The three values represent the red, green, and blue components, respectively, on a scale from 0 to 255. Thus, 230,230,230 translates to an almost white shade.
We will need to define specific symbol timeframes or periods that we will use in our dashboard. We thus will need to store them and the easiest way to store them is in arrays where they can be easily accessed.
// Define the timeframes to be used
ENUM_TIMEFRAMES periods[] = {PERIOD_M1, PERIOD_M5, PERIOD_H1, PERIOD_H4, PERIOD_D1};
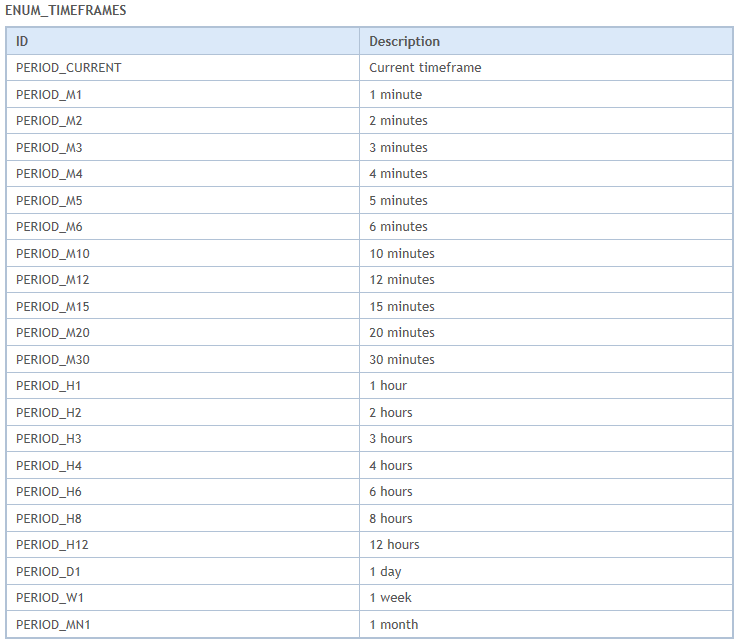
We define a static array of type ENUM_TIMEFRAMES to specify the timeframes that will be used in our dashboard. We name the array as " periods", and include the following specific timeframes: PERIOD_M1 (1 minute), PERIOD_M5 (5 minutes), PERIOD_H1 (1 hour), PERIOD_H4 (4 hours), and PERIOD_D1 (1 day). By listing these timeframes in the " periods" array, we ensure that our dashboard will display RSI values for each of these distinct periods, providing a comprehensive view of market trends across multiple timeframes. This setup will allow us to iterate over the array and apply our calculations and button creations uniformly for each specified period later. The data type variable used to define the array is an enumeration that consists of all the available timeframes in MetaTrader 5 (MT5). You can use any as long as it is availed explicitly. Here is a list of all the timeframes you can use.
Lastly, still, in the global variable, we will need to create an indicator handle that will hold our indicator and an array where we will store the indicator data for the various timeframes and symbols to be used. This is achieved via the following code snippet.
// Global variables
int handleName_Id; // Variable to store the handle ID for the RSI indicator
double rsi_Data_Val[]; // Array to store the RSI values
We declare an integer data type variable named "handleName_Id" to store the handle ID for the RSI indicator. When we create an RSI indicator for a specific symbol and timeframe, it will return a unique handle ID. The ID will then be stored in the indicator handle, allowing us to reference this specific RSI indicator in subsequent operations, such as retrieving its values for further analysis. That is where the second variable array comes in. We define a double dynamic array named "rsi_Data_Val" to store the RSI values obtained from the indicator. When we retrieve the RSI data, the values will be copied into this array. By making this array a global variable, we ensure that the RSI data is accessible throughout the program, allowing us to use the values for real-time updates and display them on our dashboard buttons.
Our dashboard will first be created on the initialization section of the Expert Advisor, and thus let us have a look at what the initialization event handler does.
//+------------------------------------------------------------------+
//| Expert initialization function                                   |
//+------------------------------------------------------------------+
int OnInit() {

...

   return(INIT_SUCCEEDED); // Return initialization success
}
The OnInit function is an event handler that is called on the expert initialization instance to do necessary initializations if necessary. It is designed to perform all necessary initial setup tasks to ensure that the Expert Advisor operates correctly. This includes creating user interface elements, initializing variables, and setting up the necessary conditions for the program to function properly during its runtime. In our case, we will use it to initialize the dashboard elements.
We then call the function to create a button by typing its name and providing its parameters.
   // Create the main button for the pair with specific properties
   createButton(BTN1, "PAIR", 600, 50, XS1, YS1, clrW, clrGray, 15, clrGray);
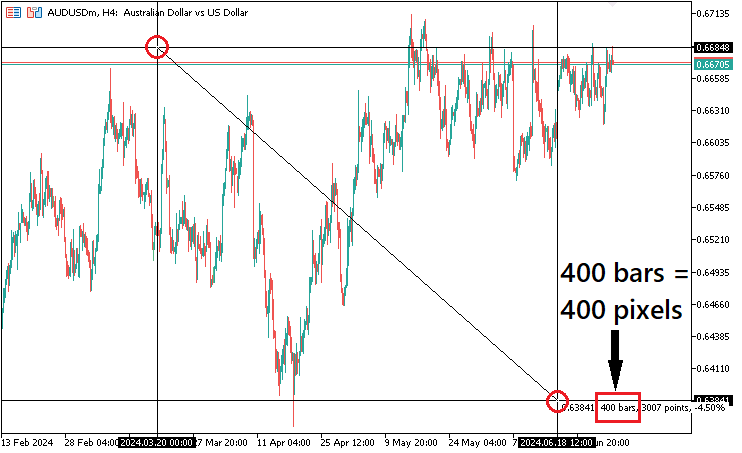
Here, our button name is "BTN1" as from the macro definition. The second parameter is used to specify the wording or text to be displayed in the button proximities. Our distance along the x-axis, the time and date scale, from the right upper corner of the chart window is 600 pixels, and the distance along the y-axis, the price scale, is 50 pixels. The width is taken from the already predefined macro for easier referencing to the subsequent buttons. The width is "XS1" which is 90 pixels and the height is "YSI" which is 25 pixels respectively. We choose our text color to be "clrW" which is color white, with a background of gray color, a font size of 15, and a button border color of gray. To get the pixels to range approximately, you can scale down the chart to 0 and the number of bars between two cross-hair coordinates is equal to the number of pixels on the horizontal scale. In an example, here is what we mean.
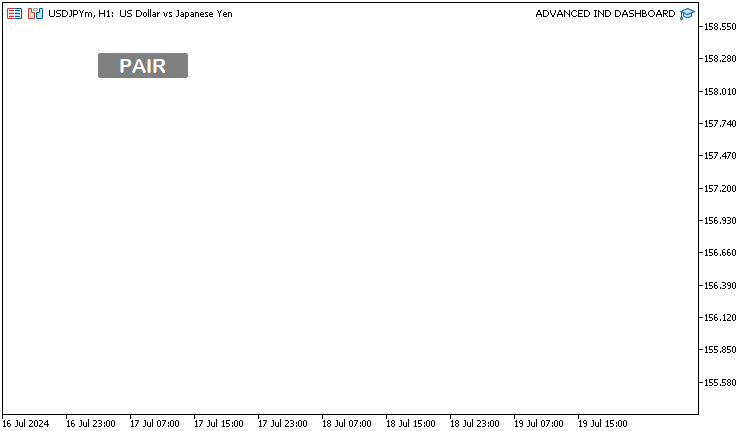
The other parameter has been left out meaning that the default value will be applied automatically, that is, the font name will be "Arial Rounded MT Bold". Upon compilation, this is what we currently have.
Even if we had all the parameters with the default values as below, the results would always be the same.
   // Create the main button for the pair with specific properties
   createButton(BTN1, "PAIR", 600, 50, XS1, YS1, clrW, clrGray, 15, clrGray, "Arial Rounded MT Bold");
Next, we want to create buttons for each predefined timeframe to display the corresponding RSI (Relative Strength Index) information. We can do this statically by calling the function to create the buttons for each element that we want to create but that would just make our code very long and tiresome. Thus, we will employ a dynamic format that will help us to create the buttons in supervised iterations.
   // Loop to create buttons for each timeframe with the corresponding RSI label
   for(int i = 0; i < ArraySize(periods); i++) {
      createButton(Desc + IntegerToString(i), truncPrds(periods[i]) + " RSI 14", (600 - XS1) + i * -XS2, 50, XS2, YS1, clrW, clrGray, 13, clrGray);
   }
We initiate a for loop that iterates through the "periods" array, which contains the specified timeframes we had earlier on defined and filled. We use the ArraySize function to ensure the loop covers all elements in the array. The function is simple and takes just a single argument and simply returns the number of elements of a selected array, "periods" in our case. Within the loop, we call the "createButton" function to create a button for each timeframe. The button's name is constructed by concatenating the macro "Desc" (defined as "Desc ") with the index "i" converted to a string using the IntegerToString function, ensuring each button has a unique name, such as "Desc 0", "Desc 1", and so on. The function converts a value of integer type into a string of a specified length and returns the obtained string. It takes 3 input parameters, but the last 2 are optional. The first parameter is the number for conversion, index "i" in our case. We use a custom function to generate the button's label, the "truncPrds" function, which truncates the string representation of the timeframe to a more readable format (e.g., "M1", "M5") and appends " RSI 14" to indicate that this button will display the RSI value with a period of 14. The function's code snippet is as below:
// Function to truncate the ENUM_TIMEFRAMES string for display purposes
string truncPrds(ENUM_TIMEFRAMES period) {
   // Extract the timeframe abbreviation from the full ENUM string
   string prd = StringSubstr(EnumToString(period), 7);
   return prd; // Return the truncated string
}
The function takes a period of type ENUM_TIMEFRAMES as its parameter and begins by converting the ENUM value to its string representation using the EnumToString function. This typically results in a string that includes a prefix, which we do not need for display. To remove this unnecessary part, we use the StringSubstr function to extract a substring starting from the 7th character onward. This effectively will truncate the string to a shorter, more readable form that is suitable for display in the user interface. Finally, we return the truncated string, providing a clean and concise representation of the timeframe that can be used for labeling buttons in our dashboard. To understand why we need this function, here is an illustration.
Logic adopted:
      Print("BEFORE: ",EnumToString(periods[i]));
      Print("AFTER: ",truncPrds(periods[i]));
The print statements.
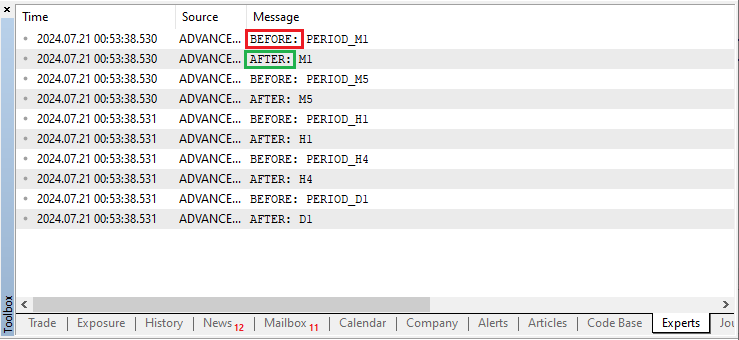
You can now clearly see that the untruncated periods are longer than the truncated periods and they do contain the unnecessary 7 characters "PERIOD_" inclusive of the underscore character, which we ultimately remove.
The x-coordinate of each button is dynamically calculated, starting with an initial value of 600 - "XS1" and adjusting it by subtracting "XS2" (the button width) multiplied by the index "i". This positioning will ensure that each button is placed to the left of the previous one, creating a horizontal alignment. The y-coordinate is fixed at 50 pixels from the top of the chart, maintaining a consistent vertical position for all timeframe buttons. The button dimensions are then set using the values defined by the macros "XS2" for width (100 pixels) and "YS1" for height (25 pixels). Additionally, we set the text color of each button to "clrWhite" which is a white color, the background color to gray color, the font size to 13, and finally the border color to gray color. Upon compilation, this is what we get.
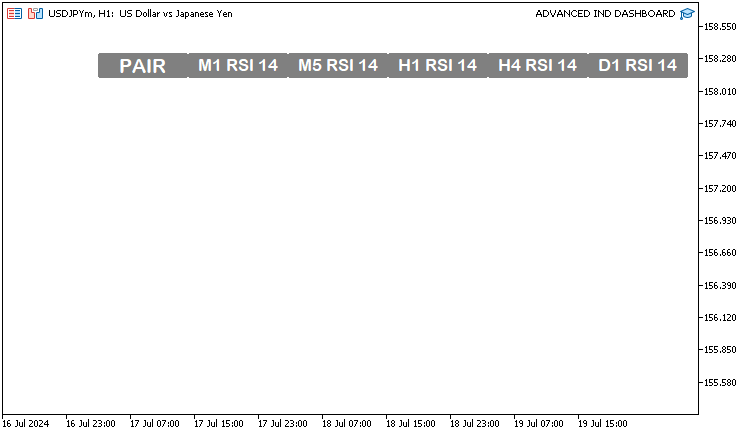
For illustration, the background color could not be pleasing to you. You can go ahead and use whichever you deem feet. All you have to do is alter the colors to your pleasing aesthetics. For example, to have a blue background and a black defined border, you can adopt the below code changes.
createButton(Desc + IntegerToString(i), truncPrds(periods[i]) + " RSI 14", (600 - XS1) + i * -XS2, 50, XS2, YS1, clrW, clrDodgerBlue, 13, clrBlack);
Here, we changed the background color to dodger blue and the border color to black. Upon compilation, this is what we get:
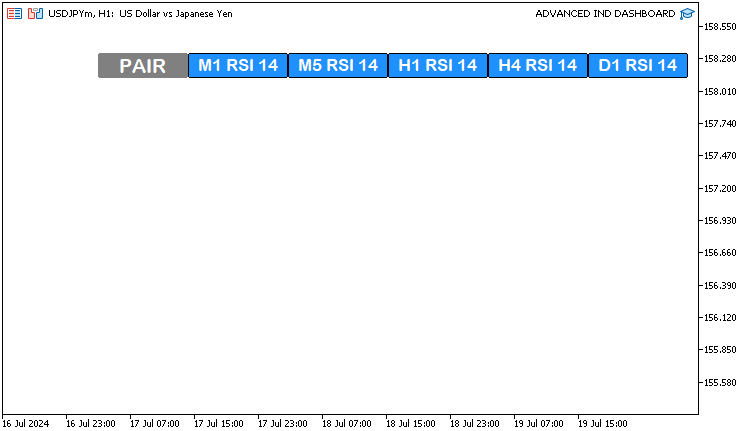
Notice how the buttons become fancy and aesthetically appealing. However, for the sake of the article to maintain consistency, let us use the default colors that are not shouting. We will use shouting colors when we create and identify valid signals later in the article.
Next, we need to create another vertical symbols' button series again adopting the dynamic representation format. For the symbols, we do not need to define specific symbols in an array and use them for the visualization. We can automatically access the symbols that are availed by the broker. To achieve this, we use a for loop to iterate via all the symbols provided by the broker and choose necessary ones if necessary.
   // Loop to create buttons for each symbol
   for(int i = 0; i < SymbolsTotal(true); i++) {

   ...

   }
To get the symbols provided by the broker, we use an in-built MQL5 function SymbolsTotal. The function returns the number of available (selected in Market Watch or all) symbols. It takes just a single input boolean parameter which if set to true, the function will return the number of symbols selected in Market Watch. If the value is false, it will return the total number of all symbols. To clearly understand this, let us print the values when the function's input parameter value is set to false.
   // Loop to create buttons for each symbol
   for(int i = 0; i < SymbolsTotal(false); i++) {
      Print("Index ",i,": Symbol = ",SymbolName(i,false));

      ...

   }
In the for loop, we set the flag of the selected value to false so we get access to the entire symbol list. On the print statement, we have used another SymbolName function to get the name of the symbol in the list by position. The second parameter of the function specifies the request mode based on market watch symbol selection criteria. If the value is true, the symbol is taken from the list of symbols selected in Market Watch. If the value is false, the symbol is taken from the general list. Upon compilation, here is what we get.
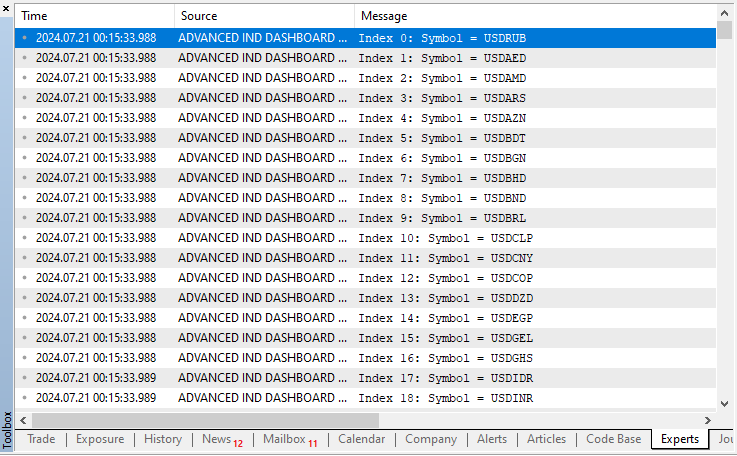
Continuation.
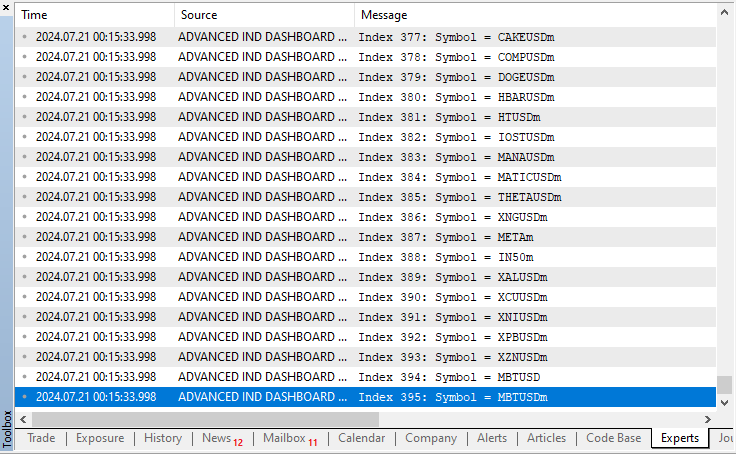
You can see that all symbols are selected. In this case, 396 symbols are selected and printed. Now imagine an instance where you show all the symbols on the chart. That is too much right? They will not fit in a single chart and if you try to, the font will be so small that you will not be able to see the symbols with ease, or will just litter your chart. Furthermore, not even all the symbols are of use to you. At this juncture, you may consider then just having a few that are of top priority and leave out the rest. The selection of the best pairs of your favorites is assumed to be in the market watch section. This is where you place your favorite symbols to have a look at the price quotes and monitor their movements at a glance. So, it is from this market watch that we will pick the display symbols. To make that practicable, we set the value of the two functions to true.
   // Loop to create buttons for each symbol
   for(int i = 0; i < SymbolsTotal(true); i++) {
      Print("Index ",i,": Symbol = ",SymbolName(i,true));

      ...

   }
Upon compilation, this is what we get:
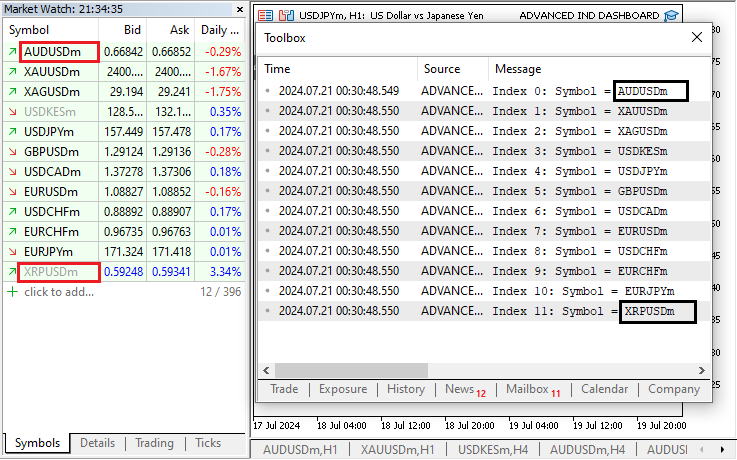
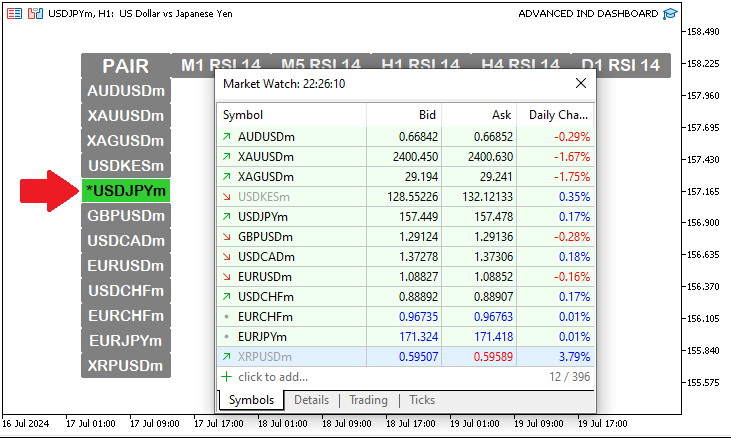
Notice the symbols on the market watch, which are 12, are the ones printed to the toolbox journal in the same chronological order. We have highlighted them in red and black colors respectively for easier distinction and referencing. To create the dynamic vertical buttons, this is the logic we use.
createButton(Symb + IntegerToString(i), SymbolName(i, true), 600, (50 + YS1) + i * YS1, XS1, YS1, clrW, clrGray, 11, clrGray);
Here, we begin by constructing the button's name by concatenating the macro "Symb" (defined as "Symb ") with the index "i", converted to a string using the IntegerToString function, ensuring each button has a unique identifier like "Symb 0", "Symb 1", and so on. We set the button's label to the name of the trading symbol at index "i", obtained using the SymbolName function which retrieves the symbol's name, with the true parameter ensuring the name is in the market watch list. We set the x-coordinate of the button to 600 pixels, aligning all symbol buttons vertically. The y-coordinate is dynamically calculated as (50 + "YS1") + "i" multiplied by "YS1", which positions each button sequentially downwards by adding the height of the button ("YS1", which is 25 pixels) multiplied by the index "i" to the initial offset of 50 pixels plus "YS1". We specify the button's dimensions using the values of "XS1" (90 pixels for width) and "YS1" (25 pixels for height). We set the text color to "clrW" (white), the background color to a gray color, the font size to 11, and finally the border color to a gray color. Upon compilation, this is the result:
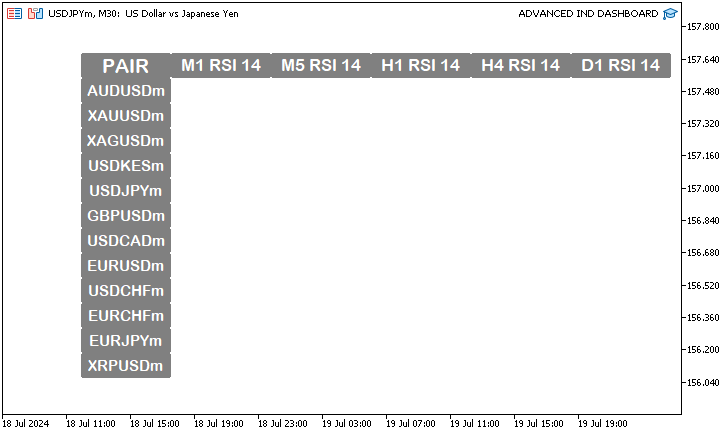
This is the list of all the symbols that are in the market watch. If you happen to add or remove the symbols, they will be automatically created, confirming our urge to use a dynamic logic for its creation. Let us remove some of the pairs, specifically the last 3, and see if that is the case.
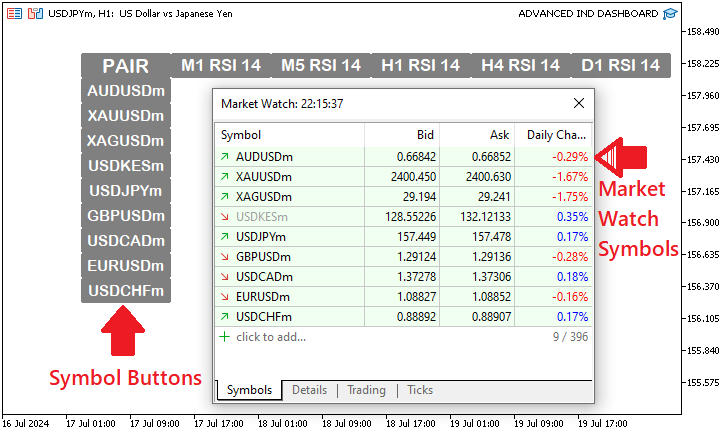
You can see that that is done automatically. Now, we will add the removed symbols back and continue to craft a logic that will help identify and prioritize the currently selected symbol and distinguish it from the rest of the symbol buttons.
      if (SymbolName(i, true) == _Symbol) {
         createButton(Symb + IntegerToString(i), "*" + SymbolName(i, true), 600, (50 + YS1) + i * YS1, XS1, YS1, clrB, clrLimeGreen, 11, clrW);
      } else {
         createButton(Symb + IntegerToString(i), SymbolName(i, true), 600, (50 + YS1) + i * YS1, XS1, YS1, clrW, clrGray, 11, clrGray);
      }
Here, instead of creating the buttons with similar textures, we create the buttons and differentiate the appearance of the button for the currently active symbol. We start by checking if the symbol name at index "i" matches the current active symbol, retrieved by the pre-defined variable _Symbol. If there is a match, we create a button with a distinct appearance to highlight the active symbol. For the active symbol, we set the text color to 'clrB" (black), the background color to lime green, the font size to 11, and the border color to "clrW" (white). This distinct color scheme will highlight the active symbol for easy identification. If the symbol does not match the active symbol, we default function takes over and creates the button with the standard appearance scheme ensuring that inactive symbols are displayed in a consistent and visually distinct manner from the active symbol. Upon compilation, this is what we have achieved.
After creating all the needed symbol buttons, let us have a footer that signifies the end of the symbol visualization matrix and add some summary information to it. The following code snippet is adapted.
      // Create the base button for the RSI Dashboard at the end
      if (i == SymbolsTotal(true) - 1) {
         createButton(Base + IntegerToString(i), "RSI DashBoard", 600, (50 + YS1) + (i * YS1) + YS1, XS1 + XS2 * ArraySize(periods), YS1, clrW, clrGray, 11, clrGray);
      }
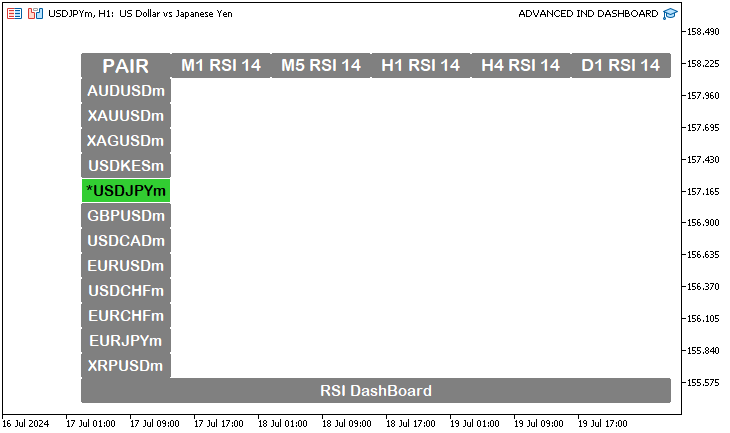
To create the base button for the RSI Dashboard, and ensure it is positioned at the end of the list of symbols, we begin by checking if the current index "i" is equal to the total number of symbols minus one, which means it is the last symbol in the list. If this condition is true, we proceed to create the base button. We use the "createButton" function to define the appearance and position of this base button. To construct the button's name, we concatenate the "Base" string with the index "i", providing a unique identifier, and set its label to "RSI Dashboard". This is just an arbitrary value and you can change it to something else as you deem fit. We then position the button at an x-coordinate of 600 pixels and a y-coordinate calculated as (50 + "YS1") + (i * "YS1") + "YS1", ensuring it appears just below the last symbol button. We define the width of the button to be "XS1" + "XS2" multiplied by the ArraySize function which returns the total elements in the "periods" array, to span the width of all timeframe buttons combined, while we define the height to "YS1" (25 pixels). The color scheme for the button adopts the standard appearance. Generally, this base button will act as a clear label for the entire RSI Dashboard, providing a visual anchor at the bottom of the symbol list. Here are the milestone results.
Finally, we now need to create buttons that display RSI values for each symbol and timeframe combination. The following code snippet is utilized to achieve that.
      // Loop to create buttons for RSI values for each symbol and timeframe
      for (int j = 0; j < ArraySize(periods); j++) {
         createButton(RSI + IntegerToString(j) + " " + SymbolName(i, true), "-/-", (600 - XS1) + (j * -XS2), (50 + YS1) + (i * YS1), XS2 - 1, YS1 - 1, clrB, clrW, 12, clrW);
      }
   }
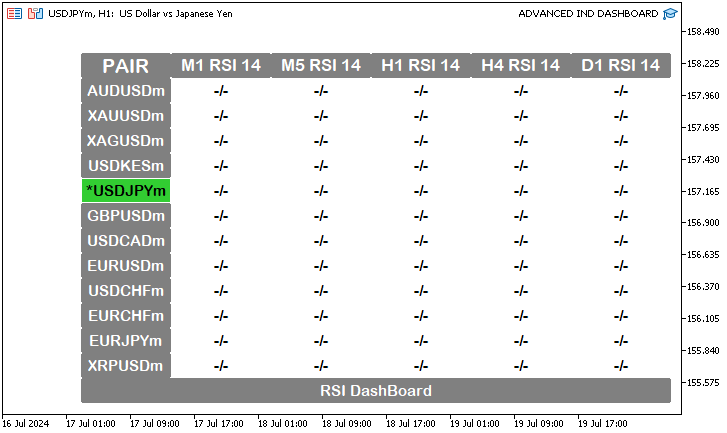
We initiate the loop with an integer counter "j", which represents the index of the timeframe. For each timeframe, we call the "createButton" function to set up a button that will show the RSI value for the current symbol and timeframe. We generate the button's name by concatenating the RSI string with the index "j" and the symbol name, ensuring a unique identifier for each button. We set the label for the button to "-/-", which we will later update with the actual RSI value. Currently, let us just make sure we can produce a symbol-period grid layout. We position the button at an x-coordinate of (600 - "XS1") + (j * - "XS2"), which arranges the buttons horizontally, spaced by "XS2" (100 pixels) with adjustments to account for the button width. Similarly, we set the y-coordinate to (50 + "YS1") + (i * "YS1"), ensuring the buttons are placed vertically based on the symbol index. The button dimensions are "XS2" - 1 for the width and "YS1" - 1 for the height. The negation of 1 ensures that we leave a boundary of 1 pixel so that there is an illusion of button grids. We then set the color scheme for the buttons with a text color of "clrB" (black), a background color of "clrW" (white), a font size of 12, and a border color of "clrW" (white). This setup will organize the RSI buttons in a grid layout, each associated with a specific symbol and timeframe, providing a clear and structured view of RSI values across different periods. Upon compilation, this is what we get:
Now that we can create the general grid layout of the dashboard, we just need to get the indicator values and update the buttons. Before we even get to that point, we can preview the created objects by right-clicking anywhere on the chart and selecting the "Object List" option on the pop-up window. Alternatively, press "Ctrl + B". On the pop-up, click "List all" and the list of the elements we created will be availed.
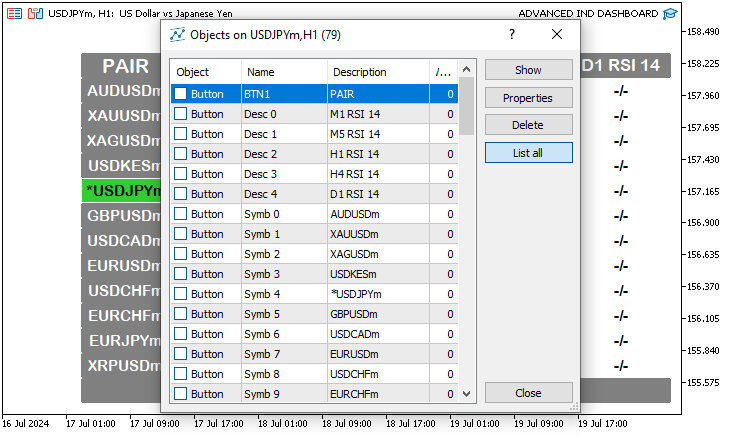
Now we are certain we create the objects chronologically on the chart with their respective unique names. This ensures that we leave no stone unturned. You can see that for example on the symbols, we have the first symbol as "Symb 0", which distinguishes it from the other symbols. Had we not concatenated the names of the symbols with respective objects, all the buttons would have the same symbol name, which would result in an error on the creation of the others since once it is created, it sticks and no other button will assume the same name. So technically, only one button would be created and the rest ignored. How crafty is that? Okay, we now continue to create the initialization values.
   // Loop to initialize RSI values and update buttons
   for(int i = 0; i < SymbolsTotal(true); i++) {
      for (int j = 0; j < ArraySize(periods); j++) {
         // Get the handle ID for the RSI indicator for the specific symbol and timeframe
         handleName_Id = iRSI(SymbolName(i, true), periods[j], 14, PRICE_CLOSE);
         ArraySetAsSeries(rsi_Data_Val, true); // Set the array to be used as a time series
         CopyBuffer(handleName_Id, 0, 0, 1, rsi_Data_Val); // Copy the RSI values into the array

         ...

   }
Here, we use two loops to iterate through each trading symbol and timeframe to initialize the RSI values and update the corresponding buttons. We start with an outer loop with index "i" which selects a trading symbol in the market watch, and within this loop, we have an inner for loop, which iterates through each defined timeframe, for each selected symbol. This means that for example, we select "AUDUSD", we iterate via all the defined timeframes, that is, "M1", "M5", "H1", "H4" and "D1". To easily understand the logic, let us have a printout.
   // Loop to initialize RSI values and update buttons
   for(int i = 0; i < SymbolsTotal(true); i++) {
      Print("SELECTED SYMBOL = ",SymbolName(i, true));
      for (int j = 0; j < ArraySize(periods); j++) {
         Print("PERIOD = ",EnumToString(periods[j]));

         ...

   }
This is what we have.
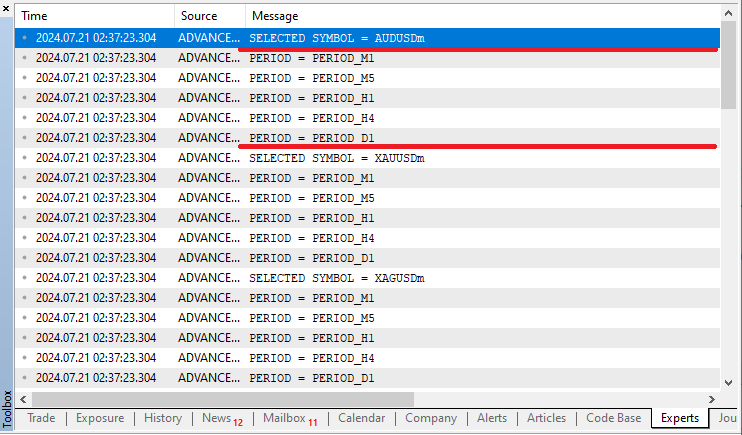
Next, for each combination of symbol and timeframe, we obtain the RSI indicator handle using the iRSI function with parameters: symbol, timeframe, RSI period as 14, and price type as the closing prices. The handle "handleName_Id" is just an integer number that is defined and stored somewhere in our computer memory and allows us to interact with the RSI indicator data. By default, the integer starts at index 10, and if there is any other indicator created, it increments by one, that is 10, 11, 12, 13, ... and so on. For illustration purposes, let us print it.
Print("PERIOD = ",EnumToString(periods[j]),": HANDLE ID = ",handleName_Id);
Upon compilation, this is what we have:
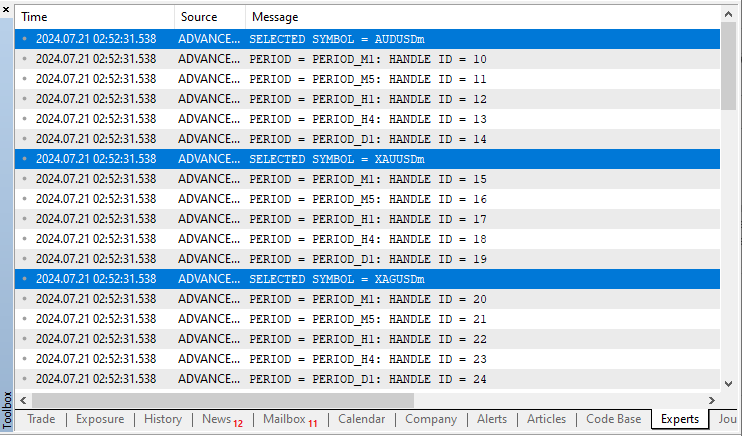
You can see that the handles' ID starts at 10, and since we have 12 symbols and 5 periods for each symbol, we anticipate a total of (12 * 5 = 60) 60 indicator handles. But since we start our indexing at 10, we will need to include the first 9 values in the result to get the final handle ID. Mathematically, that will be 60 + 9 which results to (60 + 9 = 69) 69. Let us confirm if that is correct via a visual representation.
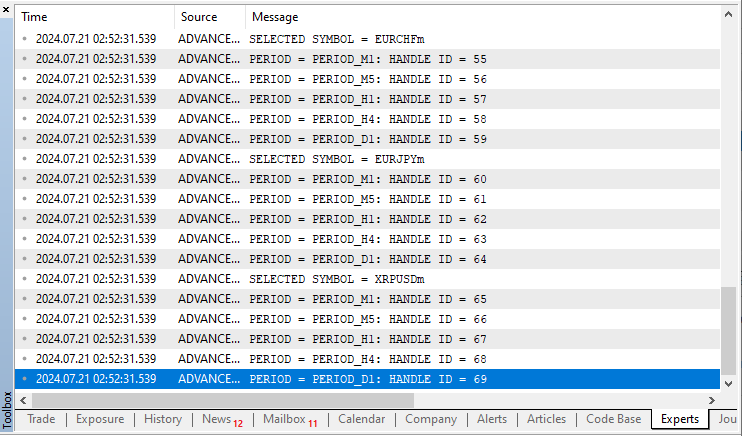
That was correct. We then set the "rsi_Data_Val" array to be used as a time series by calling the ArraySetAsSeries function and setting the flag to true to confirm the action. This configuration will ensure that the most recent RSI values are at the start of the array. We then proceed to copy the RSI values into the array using the CopyBuffer function, where 0 indicates the buffer index, 0 is the start position, 1 specifies the number of data points to retrieve, and "rsi_Data_Val" is the destination array where we store the retrieved data for further analysis. Let us print the data to the journal and see what we get. We use the ArrayPrint function to print the simple dynamic array.
ArrayPrint(rsi_Data_Val);
Below is what we get:
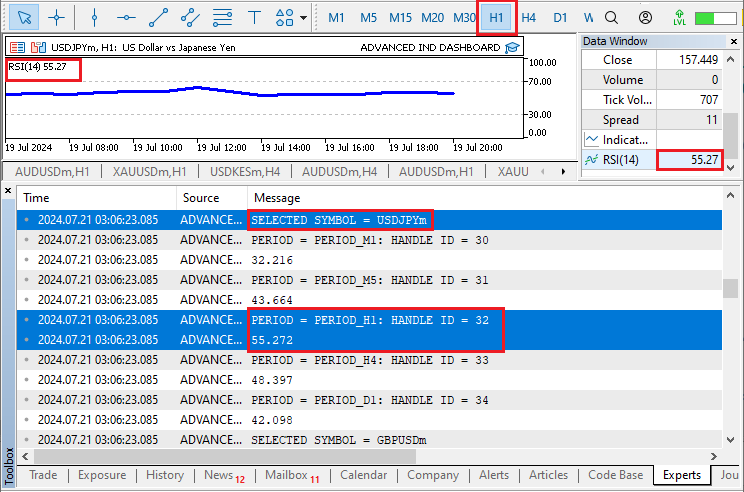
That was awesome. We get the correct data. You can confirm the data on the indicator window and on the data window with the one that we retrieve. This is a clear illustration that we get the data and we can proceed. You can see the beauty of confirming everything that we do. On every new logic that you add to the dashboard, it is recommended that you compile and run a test to affirm that you get the results as anticipated. We now just use the indicator values to update the dashboard and we will be done.
         // Update the button with the RSI value and colors
         update_Button(RSI + IntegerToString(j) + " " + SymbolName(i, true), DoubleToString(rsi_Data_Val[0], 2), clrBlack, clrW_Gray, clrWhite);
Here, we use a custom function "update_Button" to update the dashboard buttons with respective indicator data. The function logic is as follows.
//+------------------------------------------------------------------+
//| Function to update a button                                      |
//+------------------------------------------------------------------+
bool update_Button(string objName, string text, color clrTxt = clrBlack,
                  color clrBG = clrWhite, color clrBorder = clrWhite
) {
   int found = ObjectFind(0, objName); // Find the button by name
   // Check if the button exists
   if (found < 0) {
      ResetLastError(); // Reset the last error code
      Print("UNABLE TO FIND THE BTN: ERR Code: ", GetLastError()); // Print error message if button is not found
      return (false); // Return false if button is not found
   } else {
      // Update button properties
      ObjectSetString(0, objName, OBJPROP_TEXT, text); // Set button text
      ObjectSetInteger(0, objName, OBJPROP_COLOR, clrTxt); // Set text color
      ObjectSetInteger(0, objName, OBJPROP_BGCOLOR, clrBG); // Set background color
      ObjectSetInteger(0, objName, OBJPROP_BORDER_COLOR, clrBorder); // Set border color

      ChartRedraw(0); // Redraw the chart to reflect the updated button
      return (true); // Return true if update is successful
   }
}
This function is just identical to the one we used to create a button. The difference is that instead of creating the button, we find the button using the ObjectFind function. If successful, it returns the number of the subwindow (0 means the main window of the chart), in which the object is found. If the object is not found, the function returns a negative number. Thus, if the return value is less than 0, it means it is a negative number indicating the absence of the object and we inform of the error by printing the error code, and before that, we reset the previous possible error, and return false to terminate the function. If it passes, we find the object and just proceed to update the object properties, that is the text, the color schemes of the text, the background, and the border. Upon compilation, this is what we get:
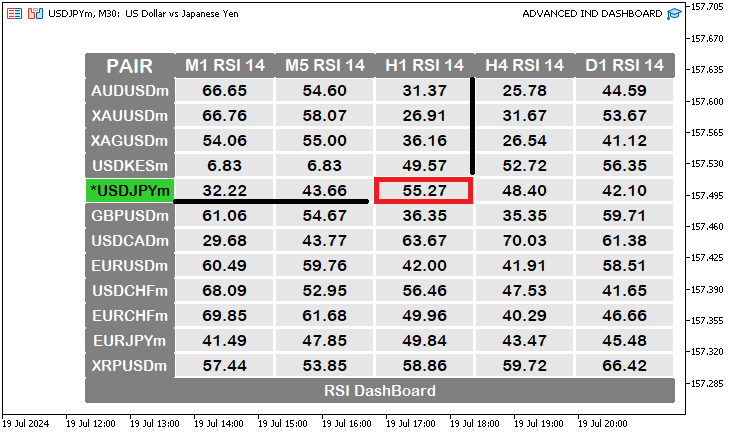
Excellent. We have the indicator data in the grid now. Look at how correctly the data is mapped with just a single line of code. Confirm also that the data we had before, that is, 55.27, for a 1-hour timeframe of the current symbol is correctly filled. To make it even more fancy, let us define market entry conditions based on overbought and oversold levels and change the colors for easier and user-friendly referencing. So now instead of using fixed colors, let us use dynamic colors.
         // Declare variables for button colors
         color text_clr, bg_clr, border_clr;

         // Determine button colors based on RSI value
         if (rsi_Data_Val[0] < 30) {
            text_clr = clrWhite; bg_clr = clrGreen; border_clr = clrGreen;
         } else if (rsi_Data_Val[0] > 70) {
            text_clr = clrWhite; bg_clr = clrRed; border_clr = clrRed;
         } else {
            text_clr = clrBlack; bg_clr = clrW_Gray; border_clr = clrWhite;
         }

         // Update the button with the RSI value and colors
         update_Button(RSI + IntegerToString(j) + " " + SymbolName(i, true), DoubleToString(rsi_Data_Val[0], 2), text_clr, bg_clr, border_clr);
First, we declare three variables for button colors: "text_clr" for the text color, "bg_clr" for the background color, and "border_clr" for the border color. Next, we determine the appropriate colors based on the RSI value stored in the RSI data array. If the RSI value is below 30, which typically indicates that the asset is oversold, we set the text color to white, the background color to green, and the border color to green, a combination that highlights the button in green to signify a potential buying opportunity.
Similarly, if the RSI value is above 70, suggesting that the asset is overbought, we set the text color to white, the background color to red, and the border color to red, indicating a potential selling opportunity with a red button. For RSI values between 30 and 70, the default color scheme is maintained, reflecting a standard or neutral status. Finally, we update the button's appearance by calling the "update_Button" function and passing the respective button parameters. This ensures that each button on the dashboard accurately reflects the current RSI status and visually communicates the market conditions. To view the milestone, here is a visual representation:
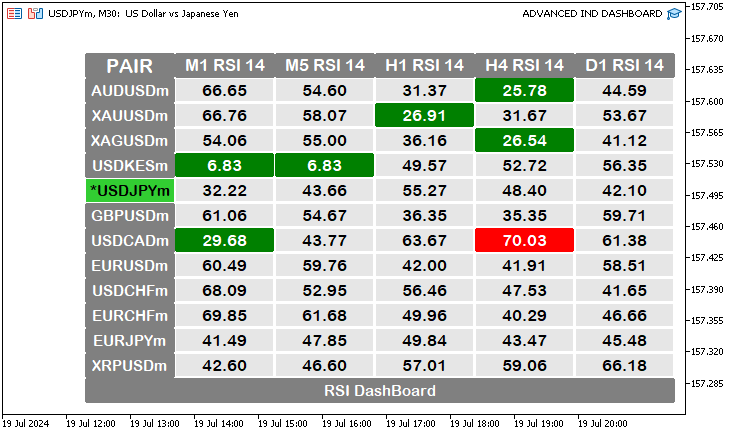
Perfect. We now created a dynamic and responsive indicator dashboard that shows the current prevailing market conditions on the chart with easier referencing highlights enabled.
The full source code responsible for the initialization of the indicator dashboard is as below:
//+------------------------------------------------------------------+
//|                                       ADVANCED IND DASHBOARD.mq5 |
//|                                  Copyright 2024, MetaQuotes Ltd. |
//|                                             https://www.mql5.com |
//+------------------------------------------------------------------+
#property copyright "Copyright 2024, MetaQuotes Ltd."
#property link      "https://www.mql5.com"
#property version   "1.00"

// Define button identifiers and properties
#define BTN1 "BTN1"
#define Desc "Desc "
#define Symb "Symb "
#define Base "Base "
#define RSI "RSI "
#define XS1 90
#define XS2 100
#define YS1 25
#define clrW clrWhite
#define clrB clrBlack
#define clrW_Gray C'230,230,230'

// Define the timeframes to be used
ENUM_TIMEFRAMES periods[] = {PERIOD_M1, PERIOD_M5, PERIOD_H1, PERIOD_H4, PERIOD_D1};

// Function to truncate the ENUM_TIMEFRAMES string for display purposes
string truncPrds(ENUM_TIMEFRAMES period) {
   // Extract the timeframe abbreviation from the full ENUM string
   string prd = StringSubstr(EnumToString(period), 7);
   return prd; // Return the truncated string
}

// Global variables
int handleName_Id; // Variable to store the handle ID for the RSI indicator
double rsi_Data_Val[]; // Array to store the RSI values

//+------------------------------------------------------------------+
//| Expert initialization function                                   |
//+------------------------------------------------------------------+
int OnInit() {
   // Create the main button for the pair with specific properties
   createButton(BTN1, "PAIR", 600, 50, XS1, YS1, clrW, clrGray, 15, clrGray);

   // Loop to create buttons for each timeframe with the corresponding RSI label
   for(int i = 0; i < ArraySize(periods); i++) {
      //Print("BEFORE: ",EnumToString(periods[i]));
      //Print("AFTER: ",truncPrds(periods[i]));
      createButton(Desc + IntegerToString(i), truncPrds(periods[i]) + " RSI 14", (600 - XS1) + i * -XS2, 50, XS2, YS1, clrW, clrGray, 13, clrGray);
   }

   // Loop to create buttons for each symbol
   for(int i = 0; i < SymbolsTotal(true); i++) {
      //Print("Index ",i,": Symbol = ",SymbolName(i,true));
      // Check if the symbol is the current symbol being traded
      if (SymbolName(i, true) == _Symbol) {
         createButton(Symb + IntegerToString(i), "*" + SymbolName(i, true), 600, (50 + YS1) + i * YS1, XS1, YS1, clrB, clrLimeGreen, 11, clrW);
      } else {
         createButton(Symb + IntegerToString(i), SymbolName(i, true), 600, (50 + YS1) + i * YS1, XS1, YS1, clrW, clrGray, 11, clrGray);
      }

      // Create the base button for the RSI Dashboard at the end
      if (i == SymbolsTotal(true) - 1) {
         createButton(Base + IntegerToString(i), "RSI DashBoard", 600, (50 + YS1) + (i * YS1) + YS1, XS1 + XS2 * ArraySize(periods), YS1, clrW, clrGray, 11, clrGray);
      }

      // Loop to create buttons for RSI values for each symbol and timeframe
      for (int j = 0; j < ArraySize(periods); j++) {
         createButton(RSI + IntegerToString(j) + " " + SymbolName(i, true), "-/-", (600 - XS1) + (j * -XS2), (50 + YS1) + (i * YS1), XS2 - 1, YS1 - 1, clrB, clrW, 12, clrW);
      }
   }

   // Loop to initialize RSI values and update buttons
   for(int i = 0; i < SymbolsTotal(true); i++) {
      //Print("SELECTED SYMBOL = ",SymbolName(i, true));
      for (int j = 0; j < ArraySize(periods); j++) {
         //Print("PERIOD = ",EnumToString(periods[j]));
         // Get the handle ID for the RSI indicator for the specific symbol and timeframe
         handleName_Id = iRSI(SymbolName(i, true), periods[j], 14, PRICE_CLOSE);
         //Print("PERIOD = ",EnumToString(periods[j]),": HANDLE ID = ",handleName_Id);
         ArraySetAsSeries(rsi_Data_Val, true); // Set the array to be used as a time series
         CopyBuffer(handleName_Id, 0, 0, 1, rsi_Data_Val); // Copy the RSI values into the array
         //ArrayPrint(rsi_Data_Val);
         // Declare variables for button colors
         color text_clr, bg_clr, border_clr;

         // Determine button colors based on RSI value
         if (rsi_Data_Val[0] < 30) {
            text_clr = clrWhite; bg_clr = clrGreen; border_clr = clrGreen;
         } else if (rsi_Data_Val[0] > 70) {
            text_clr = clrWhite; bg_clr = clrRed; border_clr = clrRed;
         } else {
            text_clr = clrBlack; bg_clr = clrW_Gray; border_clr = clrWhite;
         }

         // Update the button with the RSI value and colors
         update_Button(RSI + IntegerToString(j) + " " + SymbolName(i, true), DoubleToString(rsi_Data_Val[0], 2), text_clr, bg_clr, border_clr);
      }
   }

   return(INIT_SUCCEEDED); // Return initialization success
}

//+------------------------------------------------------------------+
//| Function to create a button                                      |
//+------------------------------------------------------------------+
bool createButton(string objName, string text, int xD, int yD, int xS, int yS,
   color clrTxt, color clrBg, int fontSize = 12, color clrBorder = clrNONE,
   string font = "Arial Rounded MT Bold"
) {
   ResetLastError(); // Reset the last error code
   // Attempt to create the button
   if (!ObjectCreate(0, objName, OBJ_BUTTON, 0, 0, 0)) {
      Print(__FUNCTION__, ": failed to create Btn: ERR Code: ", GetLastError()); // Print error message if button creation fails
      return (false); // Return false if creation fails
   }
   // Set button properties
   ObjectSetInteger(0, objName, OBJPROP_XDISTANCE, xD); // Set X distance
   ObjectSetInteger(0, objName, OBJPROP_YDISTANCE, yD); // Set Y distance
   ObjectSetInteger(0, objName, OBJPROP_XSIZE, xS); // Set X size
   ObjectSetInteger(0, objName, OBJPROP_YSIZE, yS); // Set Y size
   ObjectSetInteger(0, objName, OBJPROP_CORNER, CORNER_RIGHT_UPPER); // Set corner position
   ObjectSetString(0, objName, OBJPROP_TEXT, text); // Set button text
   ObjectSetString(0, objName, OBJPROP_FONT, font); // Set font type
   ObjectSetInteger(0, objName, OBJPROP_FONTSIZE, fontSize); // Set font size
   ObjectSetInteger(0, objName, OBJPROP_COLOR, clrTxt); // Set text color
   ObjectSetInteger(0, objName, OBJPROP_BGCOLOR, clrBg); // Set background color
   ObjectSetInteger(0, objName, OBJPROP_BORDER_COLOR, clrBorder); // Set border color
   ObjectSetInteger(0, objName, OBJPROP_BACK, false); // Set background property
   ObjectSetInteger(0, objName, OBJPROP_STATE, false); // Set button state
   ObjectSetInteger(0, objName, OBJPROP_SELECTABLE, false); // Set if the button is selectable
   ObjectSetInteger(0, objName, OBJPROP_SELECTED, false); // Set if the button is selected

   ChartRedraw(0); // Redraw the chart to reflect the new button
   return (true); // Return true if creation is successful
}

//+------------------------------------------------------------------+
//| Function to update a button                                      |
//+------------------------------------------------------------------+
bool update_Button(string objName, string text, color clrTxt = clrBlack,
                  color clrBG = clrWhite, color clrBorder = clrWhite
) {
   int found = ObjectFind(0, objName); // Find the button by name
   // Check if the button exists
   if (found < 0) {
      ResetLastError(); // Reset the last error code
      Print("UNABLE TO FIND THE BTN: ERR Code: ", GetLastError()); // Print error message if button is not found
      return (false); // Return false if button is not found
   } else {
      // Update button properties
      ObjectSetString(0, objName, OBJPROP_TEXT, text); // Set button text
      ObjectSetInteger(0, objName, OBJPROP_COLOR, clrTxt); // Set text color
      ObjectSetInteger(0, objName, OBJPROP_BGCOLOR, clrBG); // Set background color
      ObjectSetInteger(0, objName, OBJPROP_BORDER_COLOR, clrBorder); // Set border color

      ChartRedraw(0); // Redraw the chart to reflect the updated button
      return (true); // Return true if update is successful
   }
}
Even if we created the dashboard with all the elements, we will need to update it on every tick so that the data on the dashboard reflects the most recent data. That is achieved on the OnTick event handler.
//+------------------------------------------------------------------+
//| Expert tick function                                             |
//+------------------------------------------------------------------+
void OnTick() {

...

}
This is a void event handler function that is called whenever there are changes in price quotes. To update the indicator values, we will need to run some part of the initialization code here so that we get the latest values.
//+------------------------------------------------------------------+
//| Expert tick function                                             |
//+------------------------------------------------------------------+
void OnTick() {
   // Loop to update RSI values and buttons on each tick
   for(int i = 0; i < SymbolsTotal(true); i++) {
      for (int j = 0; j < ArraySize(periods); j++) {
         // Get the handle ID for the RSI indicator for the specific symbol and timeframe
         handleName_Id = iRSI(SymbolName(i, true), periods[j], 14, PRICE_CLOSE);
         ArraySetAsSeries(rsi_Data_Val, true); // Set the array to be used as a time series
         CopyBuffer(handleName_Id, 0, 0, 1, rsi_Data_Val); // Copy the RSI values into the array

         // Declare variables for button colors
         color text_clr, bg_clr, border_clr;

         // Determine button colors based on RSI value
         if (rsi_Data_Val[0] < 30) {
            text_clr = clrWhite; bg_clr = clrGreen; border_clr = clrGreen;
         } else if (rsi_Data_Val[0] > 70) {
            text_clr = clrWhite; bg_clr = clrRed; border_clr = clrRed;
         } else {
            text_clr = clrBlack; bg_clr = clrW_Gray; border_clr = clrWhite;
         }

         // Update the button with the RSI value and colors
         update_Button(RSI + IntegerToString(j) + " " + SymbolName(i, true), DoubleToString(rsi_Data_Val[0], 2), text_clr, bg_clr, border_clr);
      }
   }
}
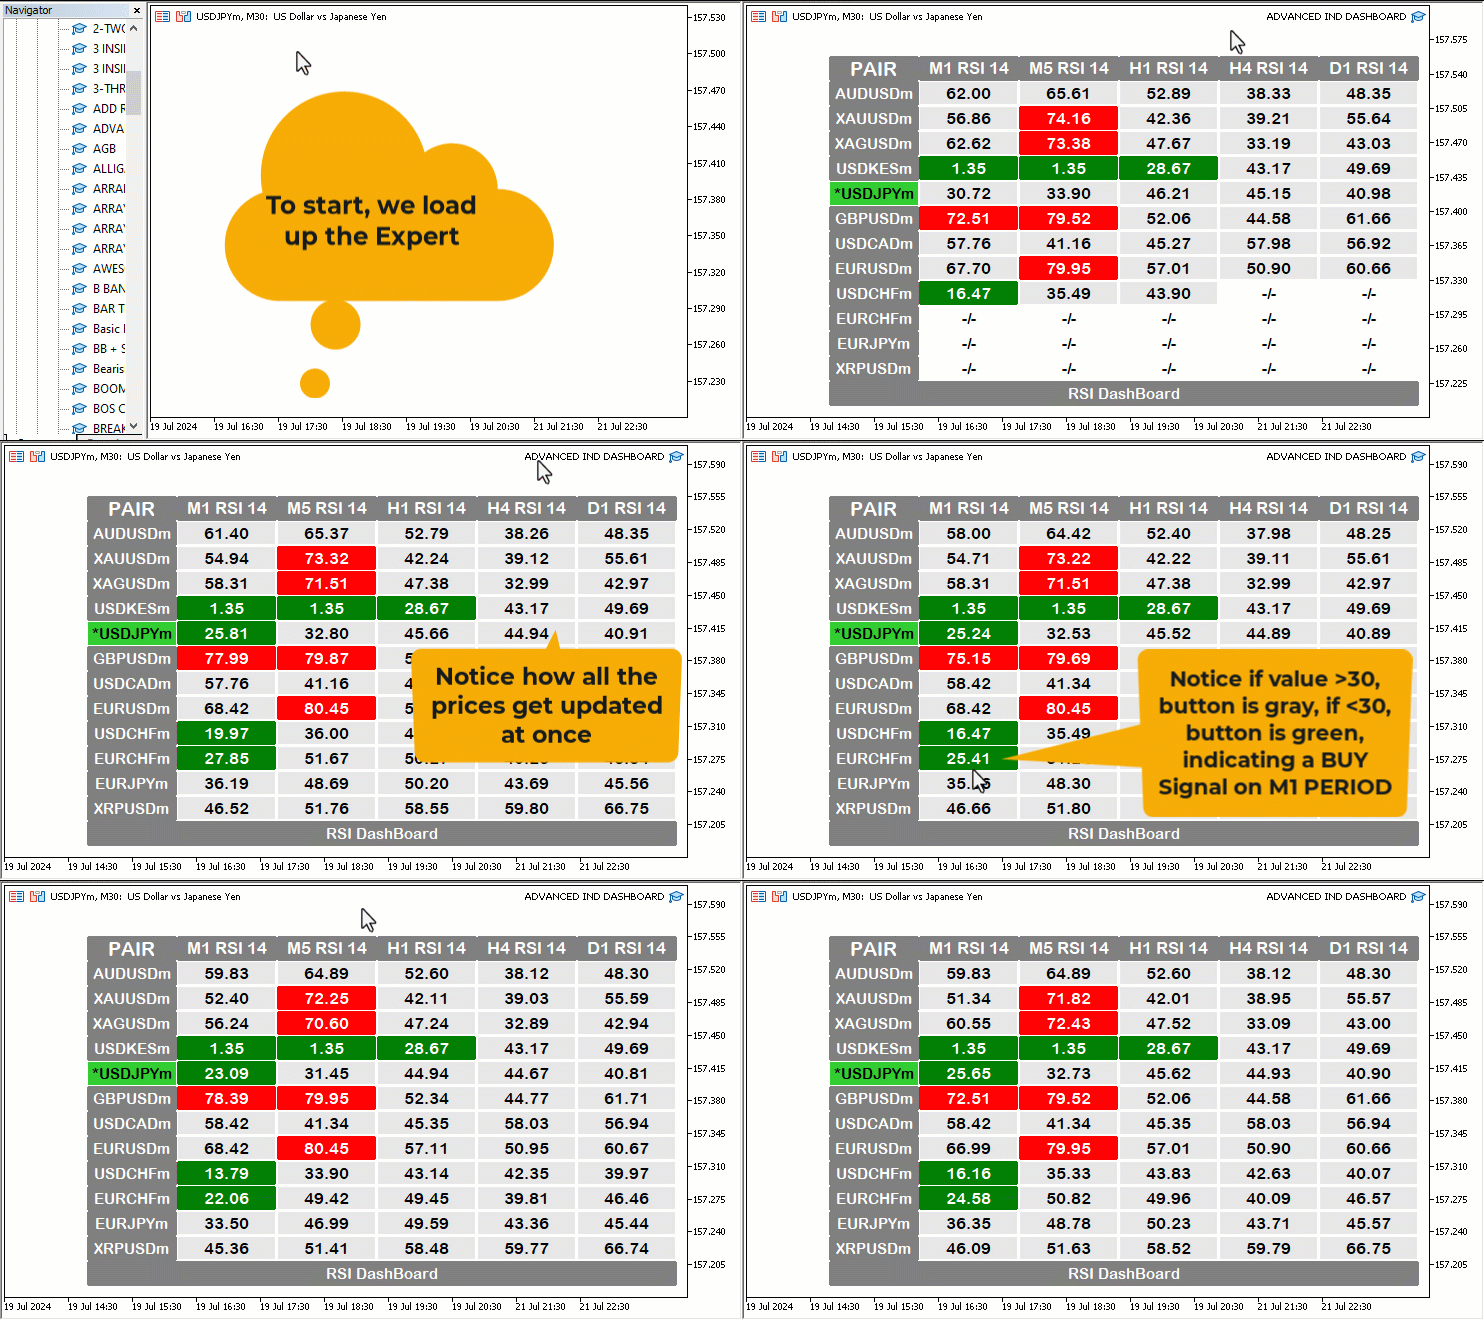
Here, we just copy and paste the code snippet on the initialization section that has two for loops; inner and outer, and update the indicator values. This ensures that on every tick, we update the values to the latest retrieved data. This way, the dashboard becomes very dynamic, live, and appealing to use. On a Graphics Interchange Format (GIF), this is the milestone that we have achieved:
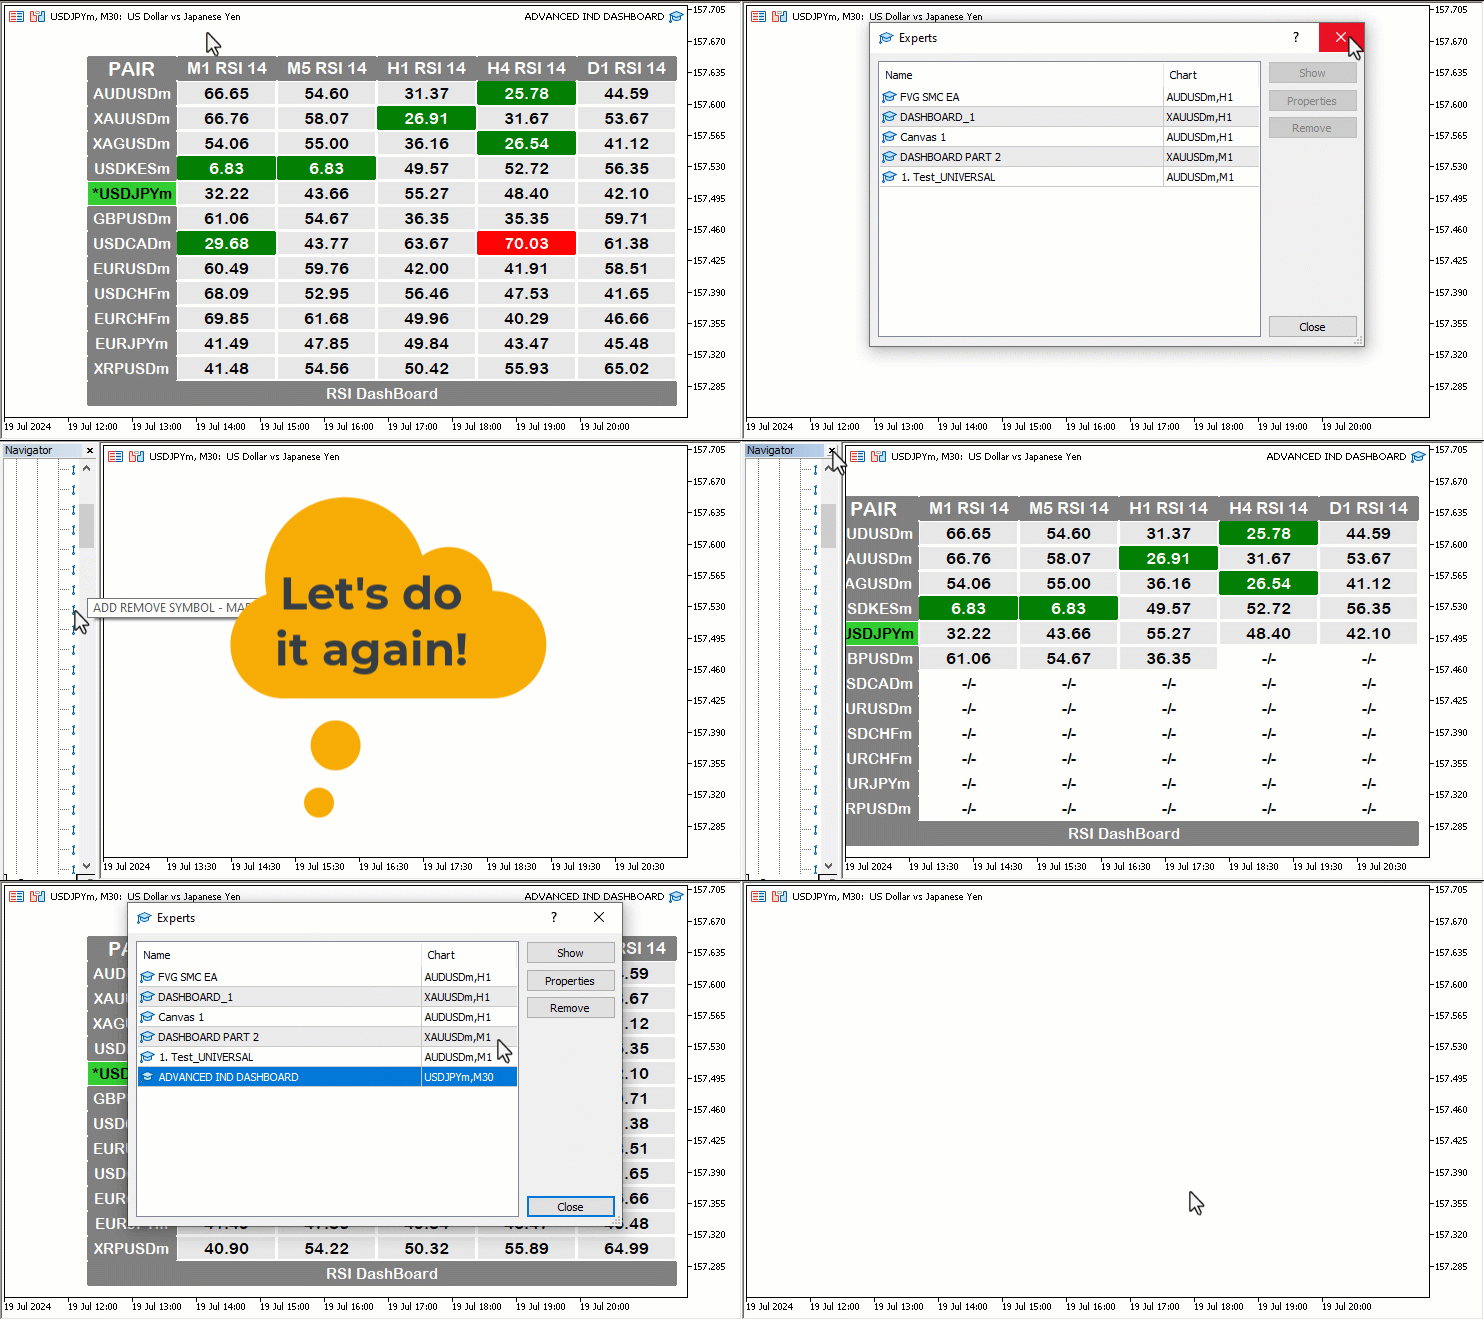
Finally, we need to get rid of the objects that we created, that is the indicator dashboard, once the EA is removed from the chart. This will make sure that the indicator dashboard is destroyed leaving the chart clean. Thus, the function is crucial for maintaining a clean and efficient trading environment. That is achieved on the OnDeinit event handler function, which is called whenever the Expert Advisor is removed from the chart.
//+------------------------------------------------------------------+
//| Expert deinitialization function                                 |
//+------------------------------------------------------------------+
void OnDeinit(const int reason) {
   // remove all dashboard objects
   ObjectsDeleteAll(0,BTN1);
   ObjectsDeleteAll(0,Desc);
   ObjectsDeleteAll(0,Symb);
   ObjectsDeleteAll(0,Base);
   ObjectsDeleteAll(0,RSI);

   ChartRedraw(0);
}
Here, we call the ObjectDeleteAll function to delete all the objects with the specified prefix name. The function removes all objects of the specified type using prefixes in object names. The logic here is quite straightforward. We call the function for each of the defined prefixes: "BTN1", "Desc", "Symb", "Base", and "RSI" as this will ensure that all objects associated with these prefixes are deleted, effectively removing all buttons and graphical elements from the chart. Finally, we call the ChartRedraw function to refresh the chart and reflect the removal of these objects, ensuring the chart is updated and free of any residual elements created by the program. Here is what we have:
Now we created a fully functional indicator dashboard in MQL5. The full source code responsible for the creation of the indicator dashboard is as follows:
//+------------------------------------------------------------------+
//|                                       ADVANCED IND DASHBOARD.mq5 |
//|                                  Copyright 2024, MetaQuotes Ltd. |
//|                                             https://www.mql5.com |
//+------------------------------------------------------------------+
#property copyright "Copyright 2024, MetaQuotes Ltd."
#property link      "https://www.mql5.com"
#property version   "1.00"

// Define button identifiers and properties
#define BTN1 "BTN1"
#define Desc "Desc "
#define Symb "Symb "
#define Base "Base "
#define RSI "RSI "
#define XS1 90
#define XS2 100
#define YS1 25
#define clrW clrWhite
#define clrB clrBlack
#define clrW_Gray C'230,230,230'

// Define the timeframes to be used
ENUM_TIMEFRAMES periods[] = {PERIOD_M1, PERIOD_M5, PERIOD_H1, PERIOD_H4, PERIOD_D1};

// Function to truncate the ENUM_TIMEFRAMES string for display purposes
string truncPrds(ENUM_TIMEFRAMES period) {
   // Extract the timeframe abbreviation from the full ENUM string
   string prd = StringSubstr(EnumToString(period), 7);
   return prd; // Return the truncated string
}

// Global variables
int handleName_Id; // Variable to store the handle ID for the RSI indicator
double rsi_Data_Val[]; // Array to store the RSI values

//+------------------------------------------------------------------+
//| Expert initialization function                                   |
//+------------------------------------------------------------------+
int OnInit() {
   // Create the main button for the pair with specific properties
   createButton(BTN1, "PAIR", 600, 50, XS1, YS1, clrW, clrGray, 15, clrGray);

   // Loop to create buttons for each timeframe with the corresponding RSI label
   for(int i = 0; i < ArraySize(periods); i++) {
      //Print("BEFORE: ",EnumToString(periods[i]));
      //Print("AFTER: ",truncPrds(periods[i]));
      createButton(Desc + IntegerToString(i), truncPrds(periods[i]) + " RSI 14", (600 - XS1) + i * -XS2, 50, XS2, YS1, clrW, clrGray, 13, clrGray);
   }

   // Loop to create buttons for each symbol
   for(int i = 0; i < SymbolsTotal(true); i++) {
      //Print("Index ",i,": Symbol = ",SymbolName(i,true));
      // Check if the symbol is the current symbol being traded
      if (SymbolName(i, true) == _Symbol) {
         createButton(Symb + IntegerToString(i), "*" + SymbolName(i, true), 600, (50 + YS1) + i * YS1, XS1, YS1, clrB, clrLimeGreen, 11, clrW);
      } else {
         createButton(Symb + IntegerToString(i), SymbolName(i, true), 600, (50 + YS1) + i * YS1, XS1, YS1, clrW, clrGray, 11, clrGray);
      }

      // Create the base button for the RSI Dashboard at the end
      if (i == SymbolsTotal(true) - 1) {
         createButton(Base + IntegerToString(i), "RSI DashBoard", 600, (50 + YS1) + (i * YS1) + YS1, XS1 + XS2 * ArraySize(periods), YS1, clrW, clrGray, 11, clrGray);
      }

      // Loop to create buttons for RSI values for each symbol and timeframe
      for (int j = 0; j < ArraySize(periods); j++) {
         createButton(RSI + IntegerToString(j) + " " + SymbolName(i, true), "-/-", (600 - XS1) + (j * -XS2), (50 + YS1) + (i * YS1), XS2 - 1, YS1 - 1, clrB, clrW, 12, clrW);
      }
   }

   // Loop to initialize RSI values and update buttons
   for(int i = 0; i < SymbolsTotal(true); i++) {
      //Print("SELECTED SYMBOL = ",SymbolName(i, true));
      for (int j = 0; j < ArraySize(periods); j++) {
         //Print("PERIOD = ",EnumToString(periods[j]));
         // Get the handle ID for the RSI indicator for the specific symbol and timeframe
         handleName_Id = iRSI(SymbolName(i, true), periods[j], 14, PRICE_CLOSE);
         //Print("PERIOD = ",EnumToString(periods[j]),": HANDLE ID = ",handleName_Id);
         ArraySetAsSeries(rsi_Data_Val, true); // Set the array to be used as a time series
         CopyBuffer(handleName_Id, 0, 0, 1, rsi_Data_Val); // Copy the RSI values into the array
         //ArrayPrint(rsi_Data_Val);
         // Declare variables for button colors
         color text_clr, bg_clr, border_clr;

         // Determine button colors based on RSI value
         if (rsi_Data_Val[0] < 30) {
            text_clr = clrWhite; bg_clr = clrGreen; border_clr = clrGreen;
         } else if (rsi_Data_Val[0] > 70) {
            text_clr = clrWhite; bg_clr = clrRed; border_clr = clrRed;
         } else {
            text_clr = clrBlack; bg_clr = clrW_Gray; border_clr = clrWhite;
         }

         // Update the button with the RSI value and colors
         update_Button(RSI + IntegerToString(j) + " " + SymbolName(i, true), DoubleToString(rsi_Data_Val[0], 2), text_clr, bg_clr, border_clr);
      }
   }

   return(INIT_SUCCEEDED); // Return initialization success
}
//+------------------------------------------------------------------+
//| Expert deinitialization function                                 |
//+------------------------------------------------------------------+
void OnDeinit(const int reason) {
   // remove all dashboard objects
   ObjectsDeleteAll(0,BTN1);
   ObjectsDeleteAll(0,Desc);
   ObjectsDeleteAll(0,Symb);
   ObjectsDeleteAll(0,Base);
   ObjectsDeleteAll(0,RSI);

   ChartRedraw(0);
}
//+------------------------------------------------------------------+
//| Expert tick function                                             |
//+------------------------------------------------------------------+
void OnTick() {
   // Loop to update RSI values and buttons on each tick
   for(int i = 0; i < SymbolsTotal(true); i++) {
      for (int j = 0; j < ArraySize(periods); j++) {
         // Get the handle ID for the RSI indicator for the specific symbol and timeframe
         handleName_Id = iRSI(SymbolName(i, true), periods[j], 14, PRICE_CLOSE);
         ArraySetAsSeries(rsi_Data_Val, true); // Set the array to be used as a time series
         CopyBuffer(handleName_Id, 0, 0, 1, rsi_Data_Val); // Copy the RSI values into the array

         // Declare variables for button colors
         color text_clr, bg_clr, border_clr;

         // Determine button colors based on RSI value
         if (rsi_Data_Val[0] < 30) {
            text_clr = clrWhite; bg_clr = clrGreen; border_clr = clrGreen;
         } else if (rsi_Data_Val[0] > 70) {
            text_clr = clrWhite; bg_clr = clrRed; border_clr = clrRed;
         } else {
            text_clr = clrBlack; bg_clr = clrW_Gray; border_clr = clrWhite;
         }

         // Update the button with the RSI value and colors
         update_Button(RSI + IntegerToString(j) + " " + SymbolName(i, true), DoubleToString(rsi_Data_Val[0], 2), text_clr, bg_clr, border_clr);
      }
   }
}
//+------------------------------------------------------------------+
//| Function to create a button                                      |
//+------------------------------------------------------------------+
bool createButton(string objName, string text, int xD, int yD, int xS, int yS,
   color clrTxt, color clrBg, int fontSize = 12, color clrBorder = clrNONE,
   string font = "Arial Rounded MT Bold"
) {
   ResetLastError(); // Reset the last error code
   // Attempt to create the button
   if (!ObjectCreate(0, objName, OBJ_BUTTON, 0, 0, 0)) {
      Print(__FUNCTION__, ": failed to create Btn: ERR Code: ", GetLastError()); // Print error message if button creation fails
      return (false); // Return false if creation fails
   }
   // Set button properties
   ObjectSetInteger(0, objName, OBJPROP_XDISTANCE, xD); // Set X distance
   ObjectSetInteger(0, objName, OBJPROP_YDISTANCE, yD); // Set Y distance
   ObjectSetInteger(0, objName, OBJPROP_XSIZE, xS); // Set X size
   ObjectSetInteger(0, objName, OBJPROP_YSIZE, yS); // Set Y size
   ObjectSetInteger(0, objName, OBJPROP_CORNER, CORNER_RIGHT_UPPER); // Set corner position
   ObjectSetString(0, objName, OBJPROP_TEXT, text); // Set button text
   ObjectSetString(0, objName, OBJPROP_FONT, font); // Set font type
   ObjectSetInteger(0, objName, OBJPROP_FONTSIZE, fontSize); // Set font size
   ObjectSetInteger(0, objName, OBJPROP_COLOR, clrTxt); // Set text color
   ObjectSetInteger(0, objName, OBJPROP_BGCOLOR, clrBg); // Set background color
   ObjectSetInteger(0, objName, OBJPROP_BORDER_COLOR, clrBorder); // Set border color
   ObjectSetInteger(0, objName, OBJPROP_BACK, false); // Set background property
   ObjectSetInteger(0, objName, OBJPROP_STATE, false); // Set button state
   ObjectSetInteger(0, objName, OBJPROP_SELECTABLE, false); // Set if the button is selectable
   ObjectSetInteger(0, objName, OBJPROP_SELECTED, false); // Set if the button is selected

   ChartRedraw(0); // Redraw the chart to reflect the new button
   return (true); // Return true if creation is successful
}

//+------------------------------------------------------------------+
//| Function to update a button                                      |
//+------------------------------------------------------------------+
bool update_Button(string objName, string text, color clrTxt = clrBlack,
                  color clrBG = clrWhite, color clrBorder = clrWhite
) {
   int found = ObjectFind(0, objName); // Find the button by name
   // Check if the button exists
   if (found < 0) {
      ResetLastError(); // Reset the last error code
      Print("UNABLE TO FIND THE BTN: ERR Code: ", GetLastError()); // Print error message if button is not found
      return (false); // Return false if button is not found
   } else {
      // Update button properties
      ObjectSetString(0, objName, OBJPROP_TEXT, text); // Set button text
      ObjectSetInteger(0, objName, OBJPROP_COLOR, clrTxt); // Set text color
      ObjectSetInteger(0, objName, OBJPROP_BGCOLOR, clrBG); // Set background color
      ObjectSetInteger(0, objName, OBJPROP_BORDER_COLOR, clrBorder); // Set border color

      ChartRedraw(0); // Redraw the chart to reflect the updated button
      return (true); // Return true if update is successful
   }
}
Conclusion
In conclusion, creating a multi-symbol, multi-period RSI indicator dashboard in MetaQuotes Language 5 (MQL5) offers traders a useful tool for market analysis. This dashboard displays real-time RSI values across different symbols and timeframes, helping traders make informed decisions more quickly.Building the dashboard involved setting up components, creating buttons, and updating them based on real-time data using MQL5 functions. The final product is functional and user-friendly.
This article demonstrates how MQL5 can be used to create practical trading tools. Traders can replicate or modify this dashboard to suit their specific needs, supporting both semi-automated and manual trading strategies in an evolving market environment.
 From Novice to Expert: The Essential Journey Through MQL5 Trading
 Practicing the development of trading strategies
 Developing a multi-currency Expert Advisor (Part 5): Variable position sizes
 Neural Networks Made Easy (Part 81): Context-Guided Motion Analysis (CCMR)
- Free trading apps
- Over 8,000 signals for copying
- Economic news for exploring financial markets
You agree to website policy and terms of use