
Practicing the development of trading strategies

Introduction
A trading strategy is a fixed plan that is designed to achieve a profitable return by going long or short in markets. By combining various ideas, traders can develop their own strategies to meet their specific needs and style preferences.
The number of possible trading strategies is so large that even classifying them becomes a difficult task. However, there is a certain set of elements that most of trading strategies usually include.
- Working symbol and timeframe.
- Indicators, filters, etc.
- Rules for opening and closing positions.
- Money and risk management.
In addition to these elements, a trading strategy may include additional parameters. Trading strategies may have a trading time limit, for example, opening positions is allowed from 9 a.m. to 1 p.m., while entry signals outside this interval are ignored.
The main requirement for the parameters of a trading strategy is their consistency and the absence of internal contradictions. Let's say that a trader decides to use some kind of money management method. After that, the trader wants to add a trailing stop to the strategy. These two elements will contradict each other. Money management requires setting predetermined stop loss and take profit levels. However, a trailing stop can close a position before the price reaches the take profit and the resulting profit will be less than expected. To resolve this contradiction, the trader will have to either use a fixed volume of positions or remove the trailing stop.
Any trading strategy must be based on some kind of statistical advantage. Moreover, this advantage should exist for a long time.
An important step in creating a strategy is testing. Using the strategy tester, you can evaluate the features of a trading strategy, its advantages and disadvantages. If necessary, you make the necessary changes. In addition, the tester enables the selection of optimal strategy parameters that can improve trading results.
Simple strategy
The simplest trading strategy is a strategy based on a simple moving average. Its idea is very simple: the price crosses the indicator line, and at that moment a position is opened. The type of position depends on the direction in which the intersection occurred: if the price moved from bottom to top – Buy, from top to bottom – Sell.
Let's take a closer look at this strategy. First, let's try to understand what the intersection is from a mathematical point of view. Essentially it indicates tracking the sign of the difference:
![]()
When the sign difference changes to the opposite one, intersection has occurred.
Now, let's try to look at this difference differently. According to its calculation, SMA is a sum of prices divided by the number of prices. Therefore, our first step is to bring the difference down to a common denominator:
![]()
Let's remove the denominator. We do this because by eliminating the denominator, we can convert the difference into integers. Working with integers is easier and more convenient. Let's multiply our difference by a scaling factor equal to N, and then divide by the point value. Thus, we get the following formula:
![]()
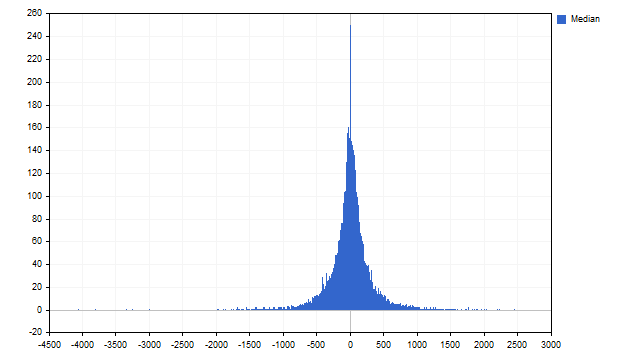
But we are not interested in simple differences. What we need to know is how often this difference occurs on a given symbol and timeframe. For this case, I used EURUSD with the H1 timeframe. Here is the statistics for N=24.
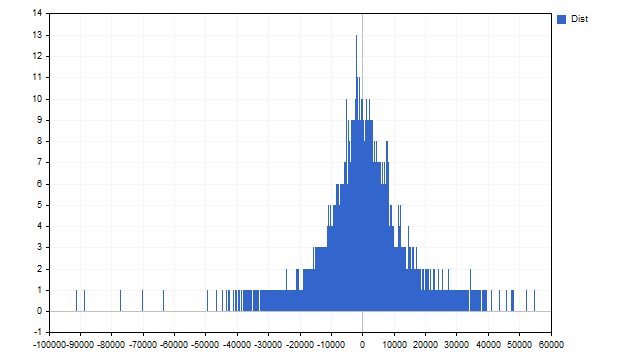
Do you like this image? If your answer to this question is "ugh, I've seen better", then you are not a trader. A real trader should be happy with this picture. The first thing a trader might like is asymmetry. The second one is that the distribution of differences does not seem to be uniform.
Let's take a little break. What nightmares do ordinary people have? I guess these can be some kind of vampires, werewolves, or walking dead. Do you know what is the worst nightmare for a trader? It's uniform distribution.
Imagine a game: if it comes up heads, I pay you some amount; if it comes up tails, you pay me. We excitedly toss a coin, and... there is no point in this game. The coin is fair which means that heads and tails, on average, appear equally often (evenly). Neither you nor I can ill get rich from this game. There is only one way out of this situation: you need to break the coin so that one side falls out more often. This will allow us to move away from uniform distribution and achieve a change in profits; someone will begin to win more often.
Let's return to our strategy. The differences are distributed unevenly and skewed towards negative values. Obviously, strategies based on the intersections of the moving average and price do not work very well. In the classic version of this strategy, a position is opened when the sign of the difference changes, i.e. zero is used as the average. But due to the nature of the distribution, in our case it is better to use the median instead of zero. Accordingly, positions should be opened only when the difference overcomes the median value.
This option is possible but is not applicable for us. The median divides the sample in half: half of the sample is below the median, and the other half is above it. This indicates that, having reached the median, the difference can both increase and decrease with approximately equal probability.
We will do things a little differently and open positions when the difference reaches a maximum or minimum. These moments will correspond to the maximum price deviation from the SMA. It is likely that after this the price and SMA will begin to converge. Moreover, since the indicator is more inertial ("lagging"), we can hope that the price will travel a fairly long distance, and this will bring us profit.
How can this be implemented in practice? First, we collect the difference values on the history. We set some kind of trigger threshold. For example, I will use 15% of the largest and smallest values. If the current difference is less than the lower threshold, a Buy position is opened. If the current difference is above the upper threshold, a Sell position is opened.
Positions are closed following the same principle, but the trigger thresholds are set at 45% (slightly short of the median, the median level is 50%). If the difference is above the lower threshold, then we close Buy positions. If the difference is below the upper threshold, then Sell positions are closed.
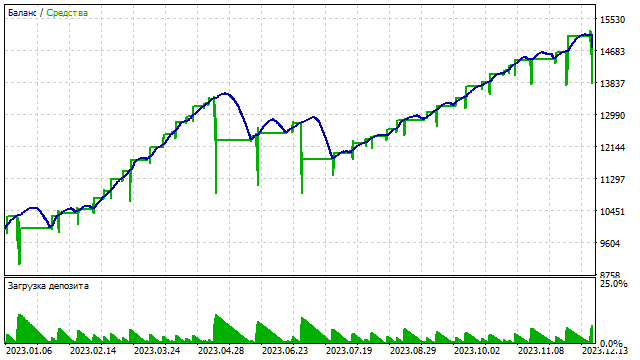
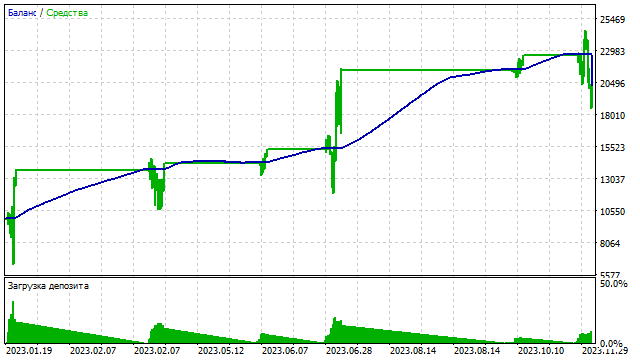
These are the rules of the trading strategy. Let's see how it behaves in the tester. For testing, we use the EURUSD symbol, H1 timeframe, testing interval from 01/01/2023 to 12/31/2023. We test it with default EA parameters.
The balance curve is as follows.
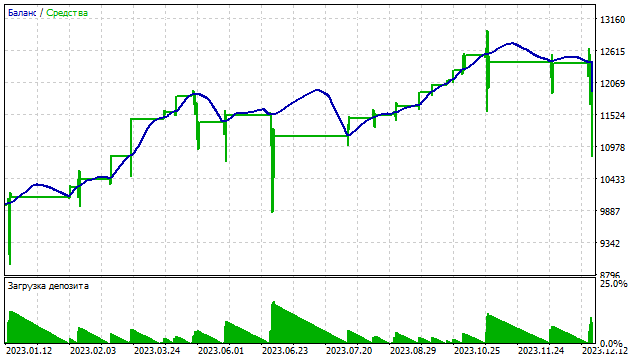
Not a bad result for such a simple strategy. But you can improve it. First, you can set separate trigger thresholds for Buy and Sell positions. The distribution is asymmetrical, so this approach can have a positive effect.
It is possible that you need to monitor not only the difference, but also the change in the values of the moving average. For example, the value of the difference increases, while the value of the moving average decreases. In this case, the signal to open a position may be stronger.
A more complex strategy
To generate position opening signals, you can use two SMAs with different periods. In the previous example we used the current price. Well, the price can be considered as an SMA with a period of 1. The idea behind this strategy is quite simple. A moving average with a long period reveals the main trend, and an average with a small period reveals moments of trend change.
All necessary calculations are done as in the previous strategy. The only difference is that instead of the price value, you need to substitute the SMA value with a shorter period.
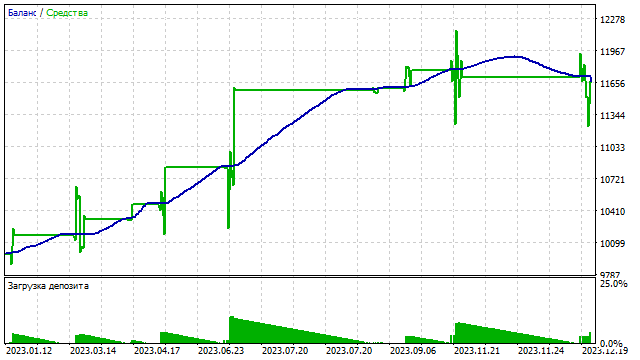
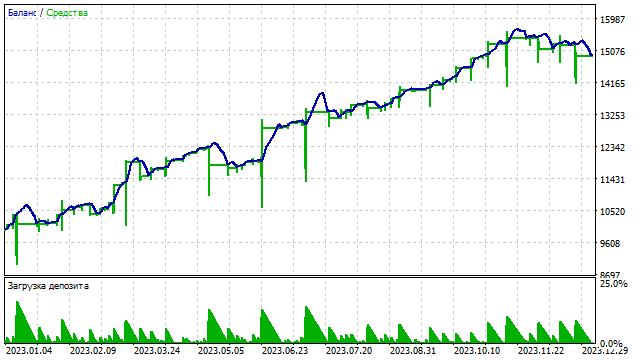
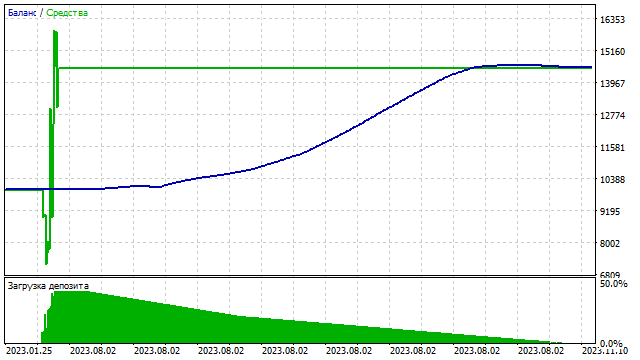
Using two SMAs makes it possible to more accurately configure the strategy parameters. Intuitively, the profitability of the strategy depends not only on the position opening and closing levels but also on the periods of SMAs. This is what the balance curve looks like in one of the options.
Adding another parameter gives us the opportunity to include an additional filter in the strategy. In our example, this filter will only work when opening positions. For example, Buy positions can only be opened if the smaller-period SMA begins to rise. Accordingly, opening Sell positions is allowed only when the value of this SMA decreases. What can we achieve with this filter? The number of open positions will definitely decrease. This will help reduce the load on the deposit. Let's check how this filter works.
| Filter | Tot. Net Prof. | Gross Profit | Gross Loss | Profit Factor | Expected Payoff | Recovery Factor | Sharpe Ratio | Z-Score |
|---|---|---|---|---|---|---|---|---|
| false | 1 670.84 | 2 039.73 | -368.89 | 5.53 | 4.49 | 1.78 | 2.91 | -17.52 |
| true | 379.20 | 607.75 | -228.55 | 2.66 | 2.92 | 0.92 | 1.95 | -10.26 |
The filter has greatly influenced the trading results. In this strategy, we use two SMAs. Each of them can serve as an independent filter or they can be used together. The filters can be used both for opening and closing positions.
A complex strategy
We have discussed the use of two SMAs. Is it possible to use three MAs? Yes, it is. Furthermore, you can use as many MAs as you wish in one strategy. Let's see how this can be implemented in practice.
Let's take several moving averages with different periods and find their sum, which in general looks like this:
![]()
In this case, the sum of the coefficients k must be equal to zero. This can be achieved in different ways. One of the easiest solutions is to use finite differences. A finite difference of any order can be obtained by taking the previous difference and subtracting its copy from it with the coefficient indices shifted by 1.
For example, the 1st order difference is equal to k1-k2.
Based in this, we can compute the 2nd order difference: (k1-k2)-(k2-k3)=k1-2*k2+k3.
Proceeding similarly, we can find the 3rd order difference: (k1-2*k2+k3)-(k2-2*k3+k4)=k1-3*k2+3*k3-k4. Etc.
If you don't want to bother with computations, you can just take the desired row from the Pascal's triangle. Just remember to change the signs in front of the coefficients.
I took three SMAs for this example. The 2nd order difference coefficients are applied to them. So, all calculations will be performed according to the formula:
![]()
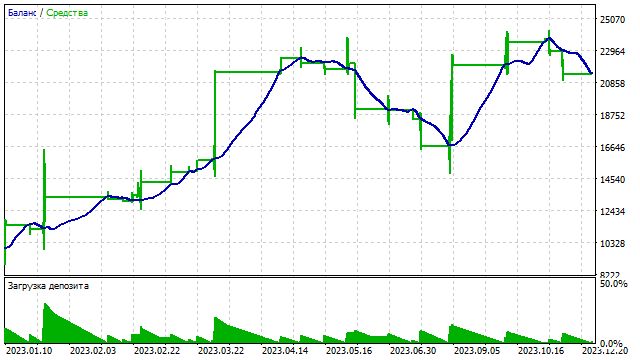
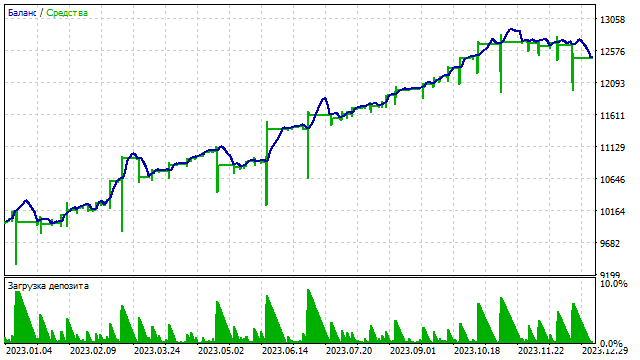
The result of such a strategy depends on three parameters. Changing the period of even one SMA can significantly affect the result. Here is an example of how such a strategy performs.
We can continue to increase the number of moving averages. At first glance, this decision may seem quite reasonable. However, this approach leads to a dead end. We can use any number of SMAs, but we will still end up with one oscillator. Each new SMA that we can add is only a change in the coefficients and characteristics of this oscillator and nothing more. We could have done it simpler by immediately starting searching for the optimal coefficients of the optimal oscillator. Unfortunately, this task is not that simple.
New level of complexity
When developing a trading strategy, the main rule is not to give up and always to look for new opportunities. We have already seen what can be achieved by using one indicator. Now let's see how you can create a strategy using multiple indicators.
I will use classic moving averages in this strategy. Based on each indicator, you can build an oscillator as the difference between the current price and indicator values. We have already looked at how to do this with SMA. However, things are a little more complicated with other indicators.
Linear technical indicators are, at their core, a set of coefficients that are multiplied by the corresponding price reference. The resulting value of the indicator is the sum of these multiplications. For example, the SMA can be represented as follows:
![]()
However, it's not that simple with the EMA. First, for exponential smoothing, the coefficients are calculated using a geometric progression with an initial coefficient ranging from 0...1. Second, the EMA period is, generally speaking, infinite. To be more precise, the EMA period is equal to the number of price readings that the indicator managed to process.
Let's change the EMA a little: we will use powers of 2 as coefficients, and the indicator period will be set arbitrarily. Thus, the formula of our indicator will be as follows:
![]()
Our indicator will be similar to a standard EMA with a period of 3. The longer the period of our indicator, the closer they will be to each other.
After this modification, we will be able to build an oscillator whose output will be integer values. We have already considered all other actions, including bringing the difference to the same denominator, applying a scaling factor, etc.
The SMMA is constructed using the following algorithm. First, we calculate the SMA values and then apply another averaging to these values. The result is a triangular window function. We will use this function to build an oscillator.
LWMA coefficients are obtained from an arithmetic progression with a step of 1. Essentially, EMA and LWMA are different models of "forgetting" past data. EMA forgets past data faster than LWMA.
The next steps are very simple. Based on each indicator, we build our own separate oscillator. Each of these oscillators gives its own statistics. Based on these statistics, we generate signals to open and close positions.
Here we need to decide how our trading strategy will operate. Each of the four oscillators can produce only one of four possible signals:
- Open a Buy position
- Open a Sell position
- Close a Buy position
- Close a Sell position
The fifth signal is do nothing, but it is enabled by default, so we do not count it.
A situation may arise where each indicator will give its own signal. And these signals will contradict each other. For example
- SMA generates a signal to open Buy positions
- EMA generates a signal to close Sell positions
- SMMA generates a signal to open Sell positions
- LWMA generates signals to close Buy positions
What should a trader do in this case? First, the trader needs to remember Byzantine generals. The essence of the Byzantine generals problem is fact that different signals can be obtained from several sources. Some signals may be false, others may be true. To determine which signal is true, you need to follow a simple rule: A signal can be considered reliable if it came from more than two-thirds of the sources.
Let N be the total number of indicators. Then the minimum number of indicators that should give the same signal can be calculated using the formula:
![]()
We have a total of four indicators. This means that a trader can take any action only if the same signal comes from at least three indicators.
This is the theory. Let's describe how our trading strategy works. First, we need to collect separate statistics for each of the indicators. Based on these statistics, each of the indicators generates its own signal. If at least three signals match, then the EA considers the signal correct and executes it.
Now let's check if Byzantine generals can make a profit.
Well, this approach can be used in trading. In addition, such a trading strategy allows for an increase in the number of parameters. For each indicator, you can enter your own levels for opening and closing positions. This will make the strategy more flexible and can have a positive impact on trading performance.
Based on several indicators, you can build a trading system in another way.
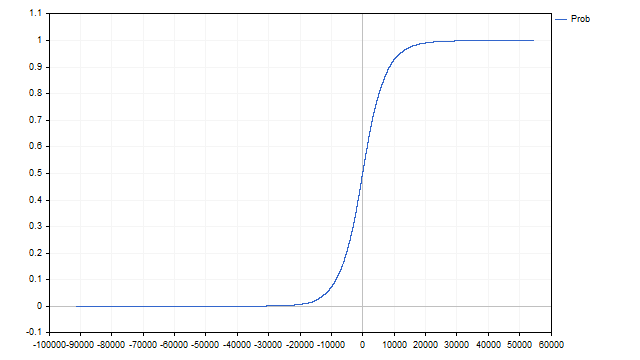
After collecting statistics, we can estimate how often a particular value of each indicator occurs. Using this frequency, we can construct an empirical distribution function.
Let N be the total sample size, and f[i] be the frequencies of each i-th indicator value. Then the empirical distribution function can be found using the following formula:
![]()
This function describes the probability that the next indicator value will be less than the current one. Graphically it looks like this.
So we have four different probabilities. But we need one value. We can get it using the naive Bayes classifier. The final probability is obtained from the probabilities of each indicator using the formula:
![]()
We will use this probability to generate signals. Positions will only be opened or closed when the probability reaches a certain value.
Let's see if this approach can be used in trading.
Now, let's try to add a filter for opening positions. The operating principle of this filter is quite simple:
- Opening Buy positions is allowed only when the final probability begins to increase;
- Opening Sell positions is allowed only when the probability begins to decrease.
As a result, we can reduce the number of positions and reduce the load on the deposit.
A similar filter can be added for position closing. It is possible that it can improve the profitability of this strategy a little.
We have considered the possibility of creating a trading strategy based on several unrelated indicators. The main feature of this approach is that all indicators should be as different from each other as possible. For example, if we used SMA and SMMA with periods equal to 2, then their coefficients would be equal. This would produce two copies of the same indicator. This must be avoided because the signals will shift and the strategy will not work correctly.
Increasing the complexity level
Let's go back to where we started - developing a strategy based on one indicator. However, this time we will increase the complexity of the strategy. We will use the CCI indicator as a basis.
The calculation of a classic CCI is simple: it is the difference between the price and the moving average normalized by the standard deviation.
![]()
With this approach, it is somewhat difficult to obtain integers for collecting statistics. Therefore, we will make small changes to this indicator. Instead of SMA and StDev, we will use medians of prices and absolute deviations.
Finding the median is quite simple. We need to sort the original set of values in ascending order. The value that will be in the center will be the median. The main advantage of the median is its resistance to outliers.
We will act as follows. First, we will take the required number of prices and find their median. Due to the specifics of our approach, the number of prices must be odd - only in this case we will be able to obtain an integer. Next, we will find the difference between the current price and the median to obtain the first statistic. I cut off the most frequently occurring value to make the diagram features more visible.
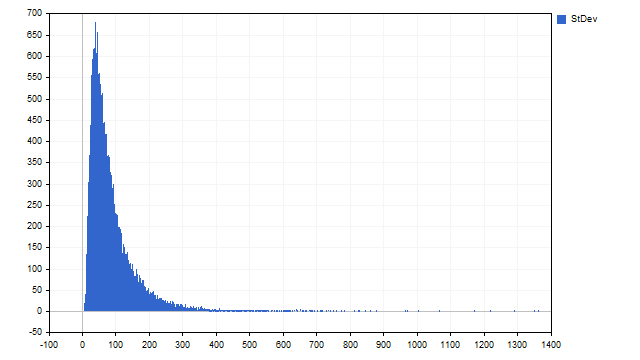
Now we need to find the absolute value of the difference between prices and the median. Let's find the median of these differences, which will be our estimate of the standard deviation and the second statistic.
We got quite nice distributions, with asymmetry and without uniformity. Let's see if they will help us in trading.
Our trading strategy will be quite simple. We will use statistics on the difference between the price and the median to generate signals to open and close positions. If the current difference deviates far from zero, then we will open positions expecting a return to the median.
The standard deviation statistic will be used as a filter. A large deviation may indicate some strong movements in the market. At these moments, we will prohibit the opening of positions.
Let's see if this strategy works.
We used the deviation filter in its simplest form. In fact, large deviations may mean that you need to change the market entering direction. For example, a signal indicates that you should open a Buy position, and a deviation indicates that you should change the position type to Sell.
Another possible filter can be built on the median. The median value can coincide with any price value. That is why the median is a non-linear indicator. Let's set the following condition: trading occurs only if the median and the price with a certain index coincide. For example, this is what the balance line looks like if the median should be equal to the price with index 5.
As we can see, even one indicator can provide a large number of options. The main task of a trader is to analyze all the possibilities and use the best of them in trading.
Conclusion
Writing a trading strategy may not be as difficult as it seems at first glance. However, to successfully implement a trading strategy, you should consider many factors and approach this process with understanding and experience. The article presents only some of the possible solutions and approaches that may be useful for developing a trading strategy. A trader must be very careful when choosing filters, signal sources, etc. Developing your own strategy is a very exciting activity that gives a lot of room for creativity.
The following programs were used when writing this article.
| Name | Type | Description |
|---|---|---|
| scr SMA1 | Script | Computes and displays the distribution of differences between the price and SMA
|
| EA SMA1 | EA | Trades using the 'price - SMA' strategy
|
| EA SMA2 | EA | Trades using a 'two SMAs' strategy
|
| EA SMA3 | EA | Trades using three SMAs |
| EA Byzantine Generals | EA | Trades using four indicators, signals are generated in accordance with the Byzantine generals problem |
| EA NBC | EA | Trades using four indicators, signals are computed using the Bayesian method |
| scr CCI | Script | Collects statistics on the CCI indicator |
| EA CCI | EA | Trades using the statistics of the CCI indicator
|
Translated from Russian by MetaQuotes Ltd.
Original article: https://www.mql5.com/ru/articles/14494
 Features of Custom Indicators Creation
 Features of Experts Advisors
- Free trading apps
- Over 8,000 signals for copying
- Economic news for exploring financial markets
You agree to website policy and terms of use