
Automating Trading Strategies in MQL5 (Part 14): Trade Layering Strategy with MACD-RSI Statistical Methods
Introduction
In our previous article (Part 13), we implemented a Head and Shoulders trading algorithm in MetaQuotes Language 5 (MQL5) to automate a classic reversal pattern for capturing market turns. Now, in Part 14, we pivot to developing a trade layering strategy with Moving Average Convergence Divergence (MACD) and Relative Strength Indicator (RSI), enhanced by statistical methods, to scale positions in trending markets dynamically. We will cover the following topics:
By the end of this article, you’ll have a robust Expert Advisor designed to layer trades with precision—let’s get started!
Strategy Architecture
The trade layering strategy we’re exploring in this article is designed to capitalize on sustained market trends by progressively adding positions as price moves in a favorable direction, a method often referred to as cascading. Unlike traditional single-entry strategies that aim for a fixed target, this approach leverages momentum by layering additional trades each time a profit threshold is reached, effectively compounding potential gains while maintaining controlled risk. At its core, the strategy combines two widely known technical indicators—MACD and RSI—with a statistical overlay to ensure entries are both timely and robust, making it suitable for markets with clear directional movement.
We will harness the strengths of MACD and RSI to establish a solid foundation for trade signals, setting clear rules for when to initiate the layering process. Our plan involves using MACD to confirm the trend’s direction and strength, ensuring we only enter trades when the market shows a consistent bias, while RSI will pinpoint optimal entry moments by detecting shifts from extreme price levels. By integrating these indicators, we aim to create a reliable trigger mechanism that launches the initial trade, which will then serve as the starting point for our cascading sequence, allowing us to build positions as the trend progresses. Here is a visualization of the strategy.
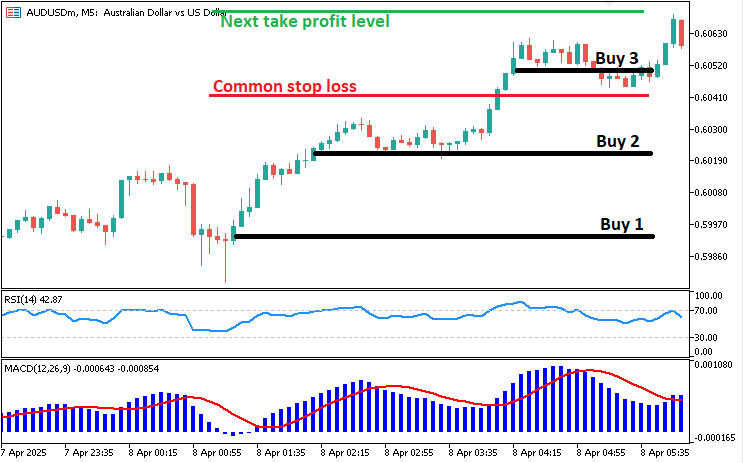
Next, we will enhance this setup by incorporating statistical methods to sharpen our entry precision and guide the layering process. We’ll explore how to apply statistical filters—such as analyzing RSI’s historical behavior—to validate signals, ensuring trades occur only under statistically significant conditions. The plan then extends to defining the layering rules, where we’ll outline how each new trade is added when profit targets are hit, alongside adjustments to risk levels to protect gains, culminating in a dynamic strategy that adapts to market momentum while maintaining disciplined execution. Let's get started.
Implementation in MQL5
To create the program in MQL5, open the MetaEditor, go to the Navigator, locate the Indicators folder, click on the "New" tab, and follow the prompts to create the file. Once it is made, in the coding environment, we will need to declare some global variables that we will use throughout the program.
//+------------------------------------------------------------------+
//|                                  MACD-RSI LAYERING STRATEGY.mq5  |
//|      Copyright 2025, ALLAN MUNENE MUTIIRIA. #@Forex Algo-Trader. |
//|                           https://youtube.com/@ForexAlgo-Trader? |
//+------------------------------------------------------------------+
#property copyright "Copyright 2025, ALLAN MUNENE MUTIIRIA. #@Forex Algo-Trader"
#property link      "https://youtube.com/@ForexAlgo-Trader?"
#property description "MACD-RSI-based layering strategy with adjustable Risk:Reward and visual levels"
#property version   "1.0"

#include <Trade\Trade.mqh>//---- Includes the Trade.mqh library for trading operations
CTrade obj_Trade;//---- Declares a CTrade object for executing trade operations

int rsiHandle = INVALID_HANDLE;//---- Initializes RSI indicator handle as invalid
double rsiValues[];//---- Declares an array to store RSI values

int handleMACD = INVALID_HANDLE;//---- Initializes MACD indicator handle as invalid
double macdMAIN[];//---- Declares an array to store MACD main line values
double macdSIGNAL[];//---- Declares an array to store MACD signal line values

double takeProfitLevel = 0;//---- Initializes the take profit level variable
double stopLossLevel = 0;//---- Initializes the stop loss level variable
bool buySequenceActive = false;//---- Flag to track if a buy sequence is active
bool sellSequenceActive = false;//---- Flag to track if a sell sequence is active

// Inputs with clear names
input int stopLossPoints = 300;        // Initial Stop Loss (points)
input double tradeVolume = 0.01;       // Trade Volume (lots)
input int minStopLossPoints = 100;     // Minimum SL for cascading orders (points)
input int rsiLookbackPeriod = 14;      // RSI Lookback Period
input double rsiOverboughtLevel = 70.0; // RSI Overbought Threshold
input double rsiOversoldLevel = 30.0;   // RSI Oversold Threshold
input bool useStatisticalFilter = true; // Enable Statistical Filter
input int statAnalysisPeriod = 20;      // Statistical Analysis Period (bars)
input double statDeviationFactor = 1.0; // Statistical Deviation Factor
input double riskRewardRatio = 1.0;     // Risk:Reward Ratio

// Object names for visualization
string takeProfitLineName = "TakeProfitLine";//---- Name of the take profit line object for chart visualization
string takeProfitTextName = "TakeProfitText";//---- Name of the take profit text object for chart visualization
We begin by setting up the essential framework for our trade layering strategy, starting with the inclusion of the "Trade.mqh" library and declaring a "CTrade" object named "obj_Trade" to handle all trading operations. We initialize key indicator handles—"rsiHandle" for RSI and "handleMACD" for MACD—both set to INVALID_HANDLE initially, alongside arrays like "rsiValues", "macdMAIN", and "macdSIGNAL" to store their respective data. To track the strategy’s state, we define variables such as "takeProfitLevel" and "stopLossLevel" for trade levels, and boolean flags "buySequenceActive" and "sellSequenceActive" to monitor whether a buy or sell layering sequence is in progress, ensuring the system knows when to cascade trades.
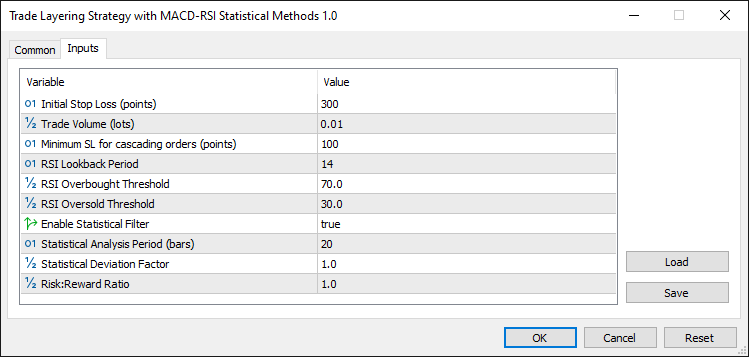
Next, we establish user-configurable inputs to make the strategy adaptable, including "stopLossPoints" for the initial stop loss distance, "tradeVolume" for lot size, and "minStopLossPoints" for tighter stops in cascading trades. For the indicators, we set "rsiLookbackPeriod" to define the RSI calculation window, "rsiOverboughtLevel" and "rsiOversoldLevel" as entry thresholds, and "riskRewardRatio" to control profit targets relative to risk. To incorporate statistical methods, we introduce "useStatisticalFilter" as a toggle, paired with "statAnalysisPeriod" and "statDeviationFactor", which will allow us to refine signals based on RSI’s statistical behavior, ensuring trades align with significant market deviations.
Finally, we prepare for visual feedback by defining "takeProfitLineName" and "takeProfitTextName" as object names for chart-based take-profit lines and labels, enhancing the trader’s ability to monitor levels in real time. Once we compile the program, we see the following output.
Next, we move on to the initialization (OnInit) event handler where we handle initialization properties.
//+------------------------------------------------------------------+
//| Expert initialization function                                   |
//+------------------------------------------------------------------+
int OnInit(){//---- Expert advisor initialization function
   rsiHandle = iRSI(_Symbol, _Period, rsiLookbackPeriod, PRICE_CLOSE);//---- Creates RSI indicator handle with specified parameters
   handleMACD = iMACD(_Symbol,_Period,12,26,9,PRICE_CLOSE);//---- Creates MACD indicator handle with standard 12,26,9 settings

   if(rsiHandle == INVALID_HANDLE){//---- Checks if RSI handle creation failed
      Print("UNABLE TO LOAD RSI, REVERTING NOW");//---- Prints error message if RSI failed to load
      return(INIT_FAILED);//---- Returns initialization failure code
   }
   if(handleMACD == INVALID_HANDLE){//---- Checks if MACD handle creation failed
      Print("UNABLE TO LOAD MACD, REVERTING NOW");//---- Prints error message if MACD failed to load
      return(INIT_FAILED);//---- Returns initialization failure code
   }

   ArraySetAsSeries(rsiValues, true);//---- Sets RSI values array as a time series (latest data at index 0)

   ArraySetAsSeries(macdMAIN,true);//---- Sets MACD main line array as a time series
   ArraySetAsSeries(macdSIGNAL,true);//---- Sets MACD signal line array as a time series

   return(INIT_SUCCEEDED);//---- Returns successful initialization code
}
Here, we begin implementing our trade layering strategy in the OnInit function, the starting point where we initialize key components before the EA engages with market data. We set up the RSI indicator by using the iRSI function to assign a handle to "rsiHandle", passing _Symbol for the current chart, _Period for the timeframe, "rsiLookbackPeriod" for the lookback window, and "PRICE_CLOSE" to use closing prices, followed by the MACD setup with the iMACD function storing its handle in "handleMACD" using standard 12, 26, 9 periods on "PRICE_CLOSE" for trend analysis.
To ensure robustness, we check if "rsiHandle" equals INVALID_HANDLE, and if so, we use the Print function to log "UNABLE TO LOAD RSI, REVERTING NOW" and return INIT_FAILED, repeating this for "handleMACD" with "UNABLE TO LOAD MACD, REVERTING NOW" to halt on failure. Once confirmed, we configure "rsiValues", "macdMAIN", and "macdSIGNAL" as time series arrays using the ArraySetAsSeries function with true, aligning the latest data at index zero, then return INIT_SUCCEEDED to signal a successful setup ready for trading. Next, we can go to the OnTick event handler and define our actual trading logic.
//+------------------------------------------------------------------+
//| Expert tick function                                             |
//+------------------------------------------------------------------+
void OnTick(){//---- Function called on each price tick
   double askPrice = NormalizeDouble(SymbolInfoDouble(_Symbol, SYMBOL_ASK), _Digits);//---- Gets and normalizes current ask price
   double bidPrice = NormalizeDouble(SymbolInfoDouble(_Symbol, SYMBOL_BID), _Digits);//---- Gets and normalizes current bid price

   if(CopyBuffer(rsiHandle, 0, 1, 3, rsiValues) < 3){//---- Copies 3 RSI values into array, checks if successful
      Print("INSUFFICIENT RSI DATA FOR ANALYSIS, SKIPPING TICK");//---- Prints error if insufficient RSI data
      return;//---- Exits function if data copy fails
   }

   if (!CopyBuffer(handleMACD,MAIN_LINE,0,3,macdMAIN))return;//---- Copies 3 MACD main line values, exits if fails
   if (!CopyBuffer(handleMACD,SIGNAL_LINE,0,3,macdSIGNAL))return;//---- Copies 3 MACD signal line values, exits if fails
}
Here, we advance our trade layering strategy by implementing the OnTick function, which activates on every price update to drive real-time decision-making in the Expert Advisor. We start by capturing current market prices, using the NormalizeDouble function to set "askPrice" with SymbolInfoDouble for _Symbol and "SYMBOL_ASK", adjusted to "_Digits" precision, and "bidPrice" with "SYMBOL_BID", ensuring accurate price data for trade calculations. This step establishes the foundation for monitoring price movements that will trigger our layering logic based on the latest market conditions.
Next, we gather indicator data to analyze signals, beginning with RSI by using the CopyBuffer function to load three values into "rsiValues" from "rsiHandle", starting at index 1 with buffer 0, and checking if fewer than 3 values are copied—if so, we use the "Print" function to log "INSUFFICIENT RSI DATA FOR ANALYSIS, SKIPPING TICK" and return to exit the tick, preventing decisions with incomplete data. We then apply the same approach for MACD, using "CopyBuffer" to fill "macdMAIN" with three mainline values from "handleMACD" at MAIN_LINE, and "macdSIGNAL" with signal line values at SIGNAL_LINE, returning immediately if either fails, ensuring we only proceed with full sets of RSI and MACD data. However, we will need to fetch statistical data and incorporate it here too. So let's have the functions.
//+------------------------------------------------------------------+
//| Calculate RSI Average                                            |
//+------------------------------------------------------------------+
double CalculateRSIAverage(int bars){//---- Function to calculate RSI average
   double sum = 0;//---- Initializes sum variable
   double buffer[];//---- Declares buffer array for RSI values
   ArraySetAsSeries(buffer, true);//---- Sets buffer as time series
   if(CopyBuffer(rsiHandle, 0, 0, bars, buffer) < bars) return 0;//---- Copies RSI values, returns 0 if fails

   for(int i = 0; i < bars; i++){//---- Loops through specified number of bars
      sum += buffer[i];//---- Adds each RSI value to sum
   }
   return sum / bars;//---- Returns average RSI value
}

//+------------------------------------------------------------------+
//| Calculate RSI STDDev                                             |
//+------------------------------------------------------------------+
double CalculateRSIStandardDeviation(int bars){//---- Function to calculate RSI standard deviation
   double average = CalculateRSIAverage(bars);//---- Calculates RSI average
   double sumSquaredDiff = 0;//---- Initializes sum of squared differences
   double buffer[];//---- Declares buffer array for RSI values
   ArraySetAsSeries(buffer, true);//---- Sets buffer as time series
   if(CopyBuffer(rsiHandle, 0, 0, bars, buffer) < bars) return 0;//---- Copies RSI values, returns 0 if fails

   for(int i = 0; i < bars; i++){//---- Loops through specified number of bars
      double diff = buffer[i] - average;//---- Calculates difference from average
      sumSquaredDiff += diff * diff;//---- Adds squared difference to sum
   }
   return MathSqrt(sumSquaredDiff / bars);//---- Returns standard deviation
}
We implement two key functions—"CalculateRSIAverage" and "CalculateRSIStandardDeviation"—to introduce statistical analysis of RSI data, strengthening signal precision. In "CalculateRSIAverage", we define a function that takes "bars" as input, initializing "sum" to 0 and declaring a "buffer" array, which we configure as a time series using the ArraySetAsSeries function with true, ensuring the latest RSI values align at index zero. We then use the CopyBuffer function to load the "bars" number of RSI values from "rsiHandle" into "buffer", returning 0 if fewer than "bars" are copied, and loop through the array to add each "buffer[i]" to "sum", finally returning "sum/bars" as the RSI average for use in statistical filtering.
Next, in "CalculateRSIStandardDeviation", we build on this by calculating the RSI’s standard deviation over the same "bars" period, starting with calling "CalculateRSIAverage" to store the result in "average" and setting "sumSquaredDiff" to 0 for squared differences. We again declare a "buffer" array, set it as a time series with ArraySetAsSeries, and use the "CopyBuffer" function to fetch RSI values from "rsiHandle", returning 0 if the copy fails, ensuring data integrity. We loop through "buffer", computing each "diff" as "buffer[i] - average", adding "diff * diff" to "sumSquaredDiff", and return the standard deviation using the MathSqrt function on "sumSquaredDiff/bars", providing a statistical measure to refine our trade layering decisions. We can now use this data for statistical analysis, but we will need to run it once per bar, to avoid ambiguity. So let's define a function for that.
//+------------------------------------------------------------------+
//| Is New Bar                                                       |
//+------------------------------------------------------------------+
bool IsNewBar(){//---- Function to detect a new bar
   static int previousBarCount = 0;//---- Stores the previous bar count
   int currentBarCount = iBars(_Symbol, _Period);//---- Gets current number of bars
   if(previousBarCount == currentBarCount) return false;//---- Returns false if no new bar
   previousBarCount = currentBarCount;//---- Updates previous bar count
   return true;//---- Returns true if new bar detected
}
Here, we add the "IsNewBar" function to our strategy to detect new bars, using a static "previousBarCount" set to 0 to track the last bar count and the iBars function to get "currentBarCount" for _Symbol and _Period, returning false if unchanged or true after updating "previousBarCount" when a new bar forms. Armed with this function, we can now define the trading rules.
// Calculate statistical measures if enabled
double rsiAverage = useStatisticalFilter ? CalculateRSIAverage(statAnalysisPeriod) : 0;//---- Calculates RSI average if filter enabled
double rsiStdDeviation = useStatisticalFilter ? CalculateRSIStandardDeviation(statAnalysisPeriod) : 0;//---- Calculates RSI std dev if filter enabled
We implement statistical enhancements by calculating "rsiAverage" using the "CalculateRSIAverage" function with "statAnalysisPeriod" if "useStatisticalFilter" is true, otherwise setting it to 0, and similarly computing "rsiStdDeviation" with the "CalculateRSIStandardDeviation" function or defaulting to 0, enabling refined signal filtering when activated. We then can use the results to define trading conditions. We will start with buy conditions.
if(PositionsTotal() == 0 && IsNewBar()){//---- Checks for no positions and new bar
   // Buy Signal
   bool buyCondition = rsiValues[1] <= rsiOversoldLevel && rsiValues[0] > rsiOversoldLevel;//---- Checks RSI crossing above oversold
   if(useStatisticalFilter){//---- Applies statistical filter if enabled
      buyCondition = buyCondition && (rsiValues[0] < (rsiAverage - statDeviationFactor * rsiStdDeviation));//---- Adds statistical condition
   }

   buyCondition = macdMAIN[0] < 0 && macdSIGNAL[0] < 0;//---- Confirms MACD below zero for buy signal
}
We define the buy signal logic by checking if PositionsTotal is 0 and using the "IsNewBar" function to confirm a new bar, ensuring trades only trigger at bar openings with no open positions. We set "buyCondition" to true if "rsiValues[1]" is below "rsiOversoldLevel" and "rsiValues[0]" rises above it, and if "useStatisticalFilter" is enabled, we refine it further by requiring "rsiValues[0]" to be less than "rsiAverage" minus "statDeviationFactor" times "rsiStdDeviation", adding statistical precision. Finally, we confirm the signal with "macdMAIN[0]" and "macdSIGNAL[0]" both below zero, aligning the buy with a bearish MACD zone for trend validation. If the conditions are met, we proceed to open the positions, initialize track variables, and draw the confirmed levels on the chart, specifically the take-profit level. So we will need a custom function to draw the levels.
//+------------------------------------------------------------------+
//| Draw TrendLine                                                   |
//+------------------------------------------------------------------+
void DrawTradeLevelLine(double price, bool isBuy){//---- Function to draw take profit line on chart
   // Delete existing objects first
   DeleteTradeLevelObjects();//---- Removes existing trade level objects

   // Create horizontal line
   ObjectCreate(0, takeProfitLineName, OBJ_HLINE, 0, 0, price);//---- Creates a horizontal line at specified price
   ObjectSetInteger(0, takeProfitLineName, OBJPROP_COLOR, clrBlue);//---- Sets line color to blue
   ObjectSetInteger(0, takeProfitLineName, OBJPROP_WIDTH, 2);//---- Sets line width to 2
   ObjectSetInteger(0, takeProfitLineName, OBJPROP_STYLE, STYLE_SOLID);//---- Sets line style to solid

   // Create text, above for buy, below for sell with increased spacing
   datetime currentTime = TimeCurrent();//---- Gets current time
   double textOffset = 30.0 * _Point;//---- Sets text offset distance from line
   double textPrice = isBuy ? price + textOffset : price - textOffset;//---- Calculates text position based on buy/sell

   ObjectCreate(0, takeProfitTextName, OBJ_TEXT, 0, currentTime + PeriodSeconds(_Period) * 5, textPrice);//---- Creates text object
   ObjectSetString(0, takeProfitTextName, OBJPROP_TEXT, DoubleToString(price, _Digits));//---- Sets text to price value
   ObjectSetInteger(0, takeProfitTextName, OBJPROP_COLOR, clrBlue);//---- Sets text color to blue
   ObjectSetInteger(0, takeProfitTextName, OBJPROP_FONTSIZE, 10);//---- Sets text font size to 10
   ObjectSetInteger(0, takeProfitTextName, OBJPROP_ANCHOR, isBuy ? ANCHOR_BOTTOM : ANCHOR_TOP);//---- Sets text anchor based on buy/sell
}
Here, we implement the "DrawTradeLevelLine" function to visualize take-profit levels, starting by calling "DeleteTradeLevelObjects" to clear existing objects, then using the ObjectCreate function to draw a horizontal line at "price" with "takeProfitLineName" as OBJ_HLINE, styled with ObjectSetInteger for blue "clrBlue", width 2, and "STYLE_SOLID". We add a text label by fetching "currentTime" with "TimeCurrent", setting "textOffset" to "30.0 * _Point", and calculating "textPrice" above or below "price" based on "isBuy", creating it with "ObjectCreate" as "takeProfitTextName" at "OBJ_TEXT". We configure the text using ObjectSetString to show "price" via DoubleToString with "_Digits", and "ObjectSetInteger" for blue "clrBlue", size 10, and "ANCHOR_BOTTOM" or "ANCHOR_TOP" depending on "isBuy", enhancing chart readability. We can now use the function to visualize the target levels.
if(buyCondition){//---- Executes if buy conditions are met
   Print("BUY SIGNAL - RSI: ", rsiValues[0],//---- Prints buy signal details
         useStatisticalFilter ? " Avg: " + DoubleToString(rsiAverage, 2) + " StdDev: " + DoubleToString(rsiStdDeviation, 2) : "");
   stopLossLevel = askPrice - stopLossPoints * _Point;//---- Calculates stop loss level for buy
   takeProfitLevel = askPrice + (stopLossPoints * riskRewardRatio) * _Point;//---- Calculates take profit level for buy
   obj_Trade.Buy(tradeVolume, _Symbol, askPrice, stopLossLevel, 0,"Signal Position");//---- Places buy order
   buySequenceActive = true;//---- Activates buy sequence flag
   DrawTradeLevelLine(takeProfitLevel, true);//---- Draws take profit line for buy
}
Here, we handle the buy trade execution when "buyCondition" is true, using the Print function to log "BUY SIGNAL - RSI: " with "rsiValues[0]", appending "rsiAverage" and "rsiStdDeviation" via DoubleToString function if "useStatisticalFilter" is enabled, for detailed feedback. We calculate "stopLossLevel" as "askPrice" minus "stopLossPoints * _Point" and "takeProfitLevel" as "askPrice" plus "stopLossPoints * riskRewardRatio * _Point", then use "obj_Trade.Buy" method to place a buy order with "tradeVolume", _Symbol, "askPrice", "stopLossLevel", and "takeProfitLevel", labeled "Signal Position". Finally, we set "buySequenceActive" to true and call "DrawTradeLevelLine" with "takeProfitLevel" and true to visualize the buy’s take-profit line. Upon running the program, we have the following outcome.
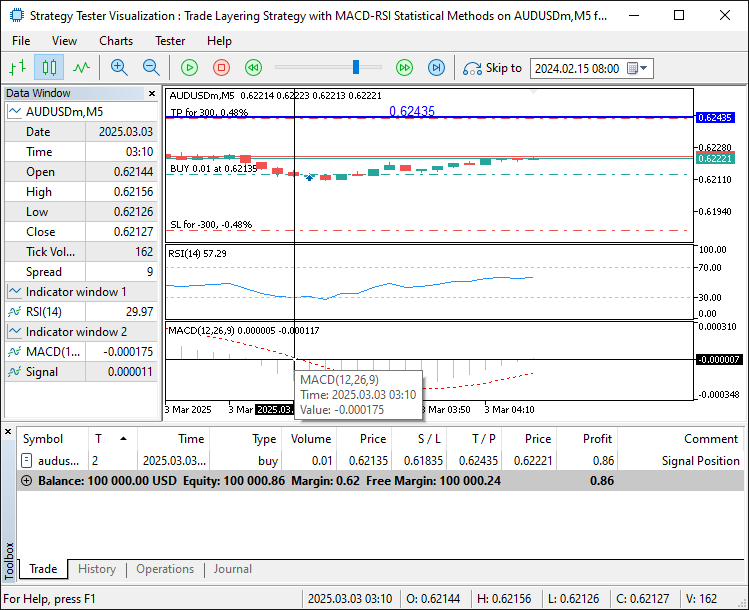
From the image, we can see that all the buy signal conditions are met, and we automatically mark the next level on the chart. Thus, we can continue to do the same for a sell signal.
// Sell Signal
bool sellCondition = rsiValues[1] >= rsiOverboughtLevel && rsiValues[0] < rsiOverboughtLevel;//---- Checks RSI crossing below overbought
if(useStatisticalFilter){//---- Applies statistical filter if enabled
   sellCondition = sellCondition && (rsiValues[0] > (rsiAverage + statDeviationFactor * rsiStdDeviation));//---- Adds statistical condition
}

sellCondition = macdMAIN[0] > 0 && macdSIGNAL[0] > 0;//---- Confirms MACD above zero for sell signal

if(sellCondition){//---- Executes if sell conditions are met
   Print("SELL SIGNAL - RSI: ", rsiValues[0],//---- Prints sell signal details
         useStatisticalFilter ? " Avg: " + DoubleToString(rsiAverage, 2) + " StdDev: " + DoubleToString(rsiStdDeviation, 2) : "");
   stopLossLevel = bidPrice + stopLossPoints * _Point;//---- Calculates stop loss level for sell
   takeProfitLevel = bidPrice - (stopLossPoints * riskRewardRatio) * _Point;//---- Calculates take profit level for sell
   obj_Trade.Sell(tradeVolume, _Symbol, bidPrice, stopLossLevel, 0,"Signal Position");//---- Places sell order
   sellSequenceActive = true;//---- Activates sell sequence flag
   DrawTradeLevelLine(takeProfitLevel, false);//---- Draws take profit line for sell
}
We do the opposite logic of the buy trade here, setting "sellCondition" if "rsiValues[1]" exceeds "rsiOverboughtLevel" and "rsiValues[0]" drops below, adding "useStatisticalFilter" to check "rsiValues[0]" above "rsiAverage + statDeviationFactor * rsiStdDeviation", and confirming with "macdMAIN[0]" and "macdSIGNAL[0]" above zero. If true, we use "Print" for "SELL SIGNAL - RSI: " with "rsiValues[0]" and stats via DoubleToString, set "stopLossLevel" as "bidPrice + stopLossPoints * _Point" and "takeProfitLevel" as "bidPrice - (stopLossPoints * riskRewardRatio) * _Point", then call "obj_Trade.Sell" and "DrawTradeLevelLine" with false, activating "sellSequenceActive". Now that the positions are opened, we need to cascade the winning positions, by following the trend and modifying the positions. Here is a function to modify the trades.
//+------------------------------------------------------------------+
//| Modify Trades                                                    |
//+------------------------------------------------------------------+
void ModifyTrades(ENUM_POSITION_TYPE positionType, double newStopLoss){//---- Function to modify open trades
   for(int i = 0; i < PositionsTotal(); i++){//---- Loops through all open positions
      ulong ticket = PositionGetTicket(i);//---- Gets ticket number of position
      if(ticket > 0 && PositionSelectByTicket(ticket)){//---- Checks if ticket is valid and selectable
         ENUM_POSITION_TYPE type = (ENUM_POSITION_TYPE)PositionGetInteger(POSITION_TYPE);//---- Gets position type
         if(type == positionType){//---- Checks if position matches specified type
            obj_Trade.PositionModify(ticket, newStopLoss, PositionGetDouble(POSITION_TP));//---- Modifies position with new stop loss
         }
      }
   }
}
Here, we implement the "ModifyTrades" function to update open trades, taking "positionType" and "newStopLoss" as inputs, then using the PositionsTotal function to loop through all positions with a for loop from 0 to "i". For each, we use the PositionGetTicket function to get the "ticket" number, check if it’s valid and selectable with PositionSelectByTicket, and use "PositionGetInteger" to fetch the "type" as ENUM_POSITION_TYPE, comparing it to "positionType". If matched, we use "obj_Trade.PositionModify" to adjust the trade’s stop loss to "newStopLoss" while keeping the take-profit from PositionGetDouble with "POSITION_TP", ensuring precise trade management. We can then use the function to cascade the trades.
else {//---- Handles cascading logic when positions exist
   // Cascading Buy Logic
   if(buySequenceActive && askPrice >= takeProfitLevel){//---- Checks if buy sequence active and price hit take profit
      double previousTakeProfit = takeProfitLevel;//---- Stores previous take profit level
      takeProfitLevel = previousTakeProfit + (stopLossPoints * riskRewardRatio) * _Point;//---- Sets new take profit level
      stopLossLevel = askPrice - minStopLossPoints * _Point;//---- Sets new stop loss level
      obj_Trade.Buy(tradeVolume, _Symbol, askPrice, stopLossLevel, 0,"Cascade Position");//---- Places new buy order
      ModifyTrades(POSITION_TYPE_BUY, stopLossLevel);//---- Modifies existing buy trades with new stop loss
      Print("CASCADING BUY - New TP: ", takeProfitLevel, " New SL: ", stopLossLevel);//---- Prints cascading buy details
      DrawTradeLevelLine(takeProfitLevel, true);//---- Updates take profit line for buy
   }
   // Cascading Sell Logic
   else if(sellSequenceActive && bidPrice <= takeProfitLevel){//---- Checks if sell sequence active and price hit take profit
      double previousTakeProfit = takeProfitLevel;//---- Stores previous take profit level
      takeProfitLevel = previousTakeProfit - (stopLossPoints * riskRewardRatio) * _Point;//---- Sets new take profit level
      stopLossLevel = bidPrice + minStopLossPoints * _Point;//---- Sets new stop loss level
      obj_Trade.Sell(tradeVolume, _Symbol, bidPrice, stopLossLevel, 0,"Cascade Position");//---- Places new sell order
      ModifyTrades(POSITION_TYPE_SELL, stopLossLevel);//---- Modifies existing sell trades with new stop loss
      Print("CASCADING SELL - New TP: ", takeProfitLevel, " New SL: ", stopLossLevel);//---- Prints cascading sell details
      DrawTradeLevelLine(takeProfitLevel, false);//---- Updates take profit line for sell
   }
}
Here, we handle cascading logic when positions exist, checking if "buySequenceActive" is true and "askPrice" hits "takeProfitLevel", then storing "previousTakeProfit", setting a new "takeProfitLevel" with "stopLossPoints * riskRewardRatio * _Point" added, and "stopLossLevel" as "askPrice - minStopLossPoints * _Point", using "obj_Trade.Buy" for a new order and "ModifyTrades" to update POSITION_TYPE_BUY stops, with "Print" logging "CASCADING BUY" details and "DrawTradeLevelLine" refreshing the buy line.
For sells, if "sellSequenceActive" is true and "bidPrice" reaches "takeProfitLevel", we mirror this by subtracting from "previousTakeProfit" for the new "takeProfitLevel", setting "stopLossLevel" as "bidPrice + minStopLossPoints * _Point", calling "obj_Trade.Sell" and "ModifyTrades" for POSITION_TYPE_SELL, logging with "Print", and updating the sell line with "DrawTradeLevelLine". Upon running the system, we get the following outcome.
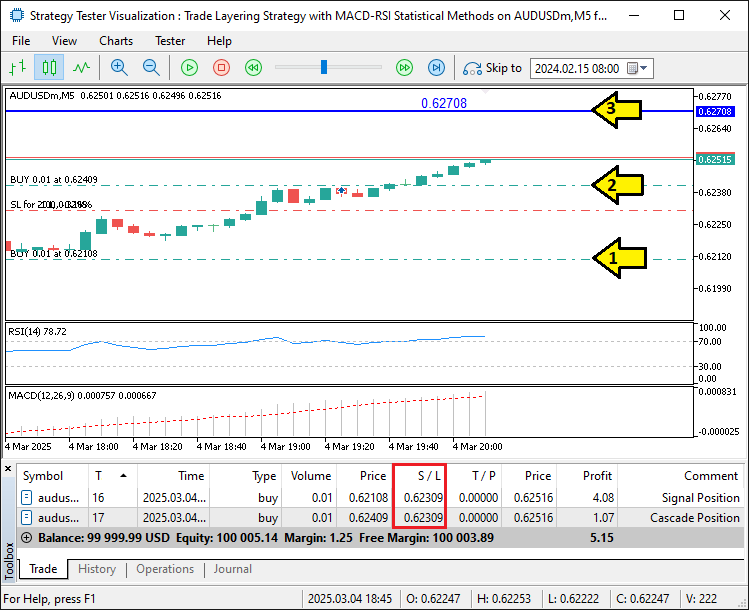
From the image, we can confirm the positions cascade and modify the stop loss for all the positions. Now what we need to do is make sure to do a cleanup of the objects we add when we don't need the system. We can achieve that via the OnDeinit event handler, but first, we will need a clean-up function.
//+------------------------------------------------------------------+
//| Delete Level Objects                                             |
//+------------------------------------------------------------------+
void DeleteTradeLevelObjects(){//---- Function to delete trade level objects
   ObjectDelete(0, takeProfitLineName);//---- Deletes take profit line object
   ObjectDelete(0, takeProfitTextName);//---- Deletes take profit text object
}
Here, we implement the "DeleteTradeLevelObjects" function to clean up chart visuals, using the ObjectDelete function to remove the "takeProfitLineName" line object and the "takeProfitTextName" text object, ensuring old take-profit levels are cleared before new ones are drawn. We now call this fucntion in the OnDeinit event handler.
//+------------------------------------------------------------------+
//| Expert deinitialization function                                 |
//+------------------------------------------------------------------+
void OnDeinit(const int reason){//---- Expert advisor deinitialization function
   DeleteTradeLevelObjects();//---- Removes trade level visualization objects from chart
}
Here, we just call the function for deleting the objects from the chart ensuring we clean the chart once we remove the program, hence achieving our objective. The thing that remains is backtesting the program, and that is handled in the next section.
Backtesting
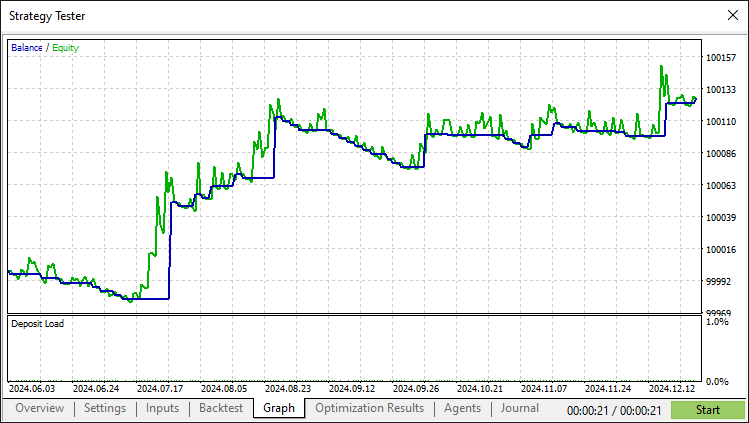
After thorough backtesting, we have the following results.
Backtest graph:
Backtest report:
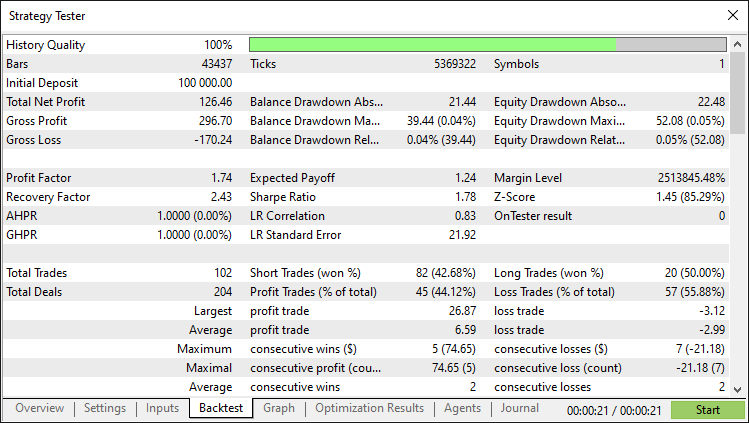
Conclusion
In conclusion, we have successfully crafted a trade layering strategy in MQL5, blending MACD and RSI with statistical methods to automate dynamic position scaling in trending markets. The program features robust signal detection, cascading trade logic, and visual take-profit levels, adapting to momentum shifts with precision. You can use this foundation to enhance it further with tweaks like optimizing "rsiLookbackPeriod" or adjusting "riskRewardRatio" for better performance.
Disclaimer: This article is for educational purposes only. Trading carries significant financial risk, and market behavior can be volatile. Thorough backtesting and risk management are crucial before live use.
With this illustration, you can sharpen your automation skills and refine the strategy. Experiment and optimize. Happy trading!
Warning: All rights to these materials are reserved by MetaQuotes Ltd. Copying or reprinting of these materials in whole or in part is prohibited.
This article was written by a user of the site and reflects their personal views. MetaQuotes Ltd is not responsible for the accuracy of the information presented, nor for any consequences resulting from the use of the solutions, strategies or recommendations described.
 Developing a Replay System (Part 63): Playing the service (IV)
 Neural Networks in Trading: Hierarchical Feature Learning for Point Clouds
 Developing a multi-currency Expert Advisor (Part 18): Automating group selection considering forward period
 Creating a Trading Administrator Panel in MQL5 (Part IX): Code Organization (V): AnalyticsPanel Class
- Free trading apps
- Over 8,000 signals for copying
- Economic news for exploring financial markets
You agree to website policy and terms of use