
A Step-by-Step Guide on Trading the Break of Structure (BoS) Strategy
Introduction
In this article, we will discuss the Break of Structure (BoS), a term that signifies a significant shift in the market’s trend or direction, forex trading strategy, in the context of the Smart Money Concept (SMC), and the creation of an Expert Advisor (EA) based on it.
We are going to explore the definition, types, trading strategy applications, and development in MetaQuotes Language 5 (MQL5) for MetaTrader 5 (MT5) as we delve into the nuances of the Break of Structure. The Break of Structure notion is a useful tool for traders to learn in order to increase their ability to predict market moves, make better decisions, and eventually become proficient in risk management. Using the following subjects, we shall accomplish the above:
- Break of Structure (BoS) definition
- Break of Structure (BoS) description
- Types of Breaks of Structure (BoS)
- Trading strategy description
- Trading strategy blueprint
- Implementation in MetaQuotes Language 5 (MQL5)
- Strategy tester results
- Conclusion
On this journey, we will extensively use MetaQuotes Language 5 (MQL5) as our base IDE coding environment, and execute the files on MetaTrader 5 (MT5) trading terminal. Thus, having the aforementioned versions will be of prime importance. Let's get started then.
Break of Structure (BoS) Definition
Break of Structure (BoS) is a key concept in technical analysis that utilizes Smart Money Concepts (SMCs) to identify significant changes in market trends or directions. It typically occurs when the price decisively moves through swing lows or swing highs that had been established by previous price action. When prices rise above the swing highs or fall below the swing lows, they simply break the previously formed market structure and hence their name “Break” of structure. This usually indicates a change in market sentiment and trend direction, signaling a continuation of the existing trend or the beginning of a new trend.
Break of Structure (BoS) Description
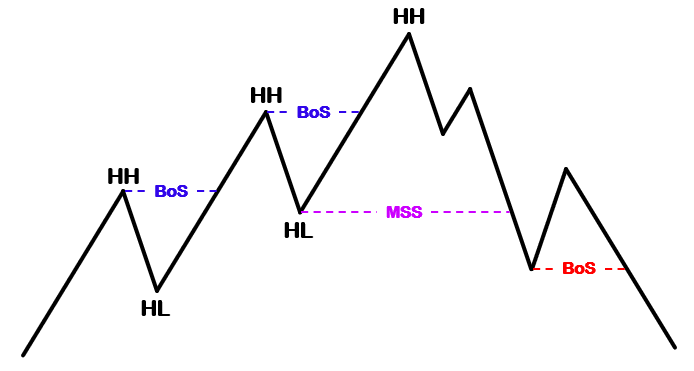
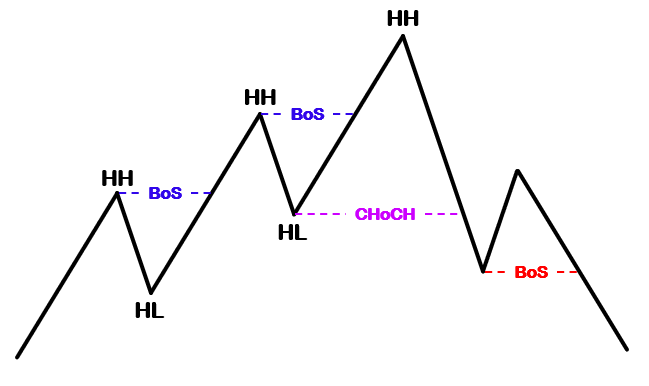
To effectively describe a Break of Structure (BoS), let us first distinguish it from the other elements of the Smart Money Concept, which are Market Structure Shift (MSS) and Change of Character (CHoCH).
- Market Structure Shift (MSS)
Market Structure Shift, which you might also have heard as Market Momentum Shift (MMS), occurs due to a price break on the most recent high regarding a downtrend or inversely the most recent high about an uptrend without first breaking the most recent swing low or swing high respectively. This signifies a trend reversal due to the change of structure, hence its name “shift” in the market structure.
- Change of Character (CHoCH)
Change of Character, on the other hand, occurs due to the price break of the most recent high in a downtrend after first breaking the most recent swing low, or due to the price break of the most recent low in an uptrend, after first breaking the most recent swing high.
- Break of Structure (BoS)
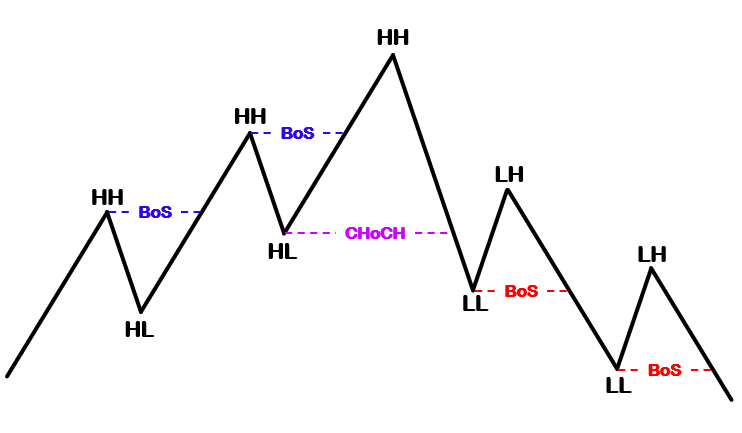
Now that we know the key differences among the three main elements of the Smart Money Concept approach based on market structure, let’s delve into the main theme of the article, which is its break. From the prior definition provided, you should have noticed that a Break of Structure means breaking past old highs or lows to make new highs or lows respectively. Each instance of a Break of Structure aids the market trend upwards making a new Higher High (HH) and a new Higher Low (HL) or downwards, making a new Lower High (LH) and a new Lower Low (LL), usually described as the price’s swing high and swing low points.
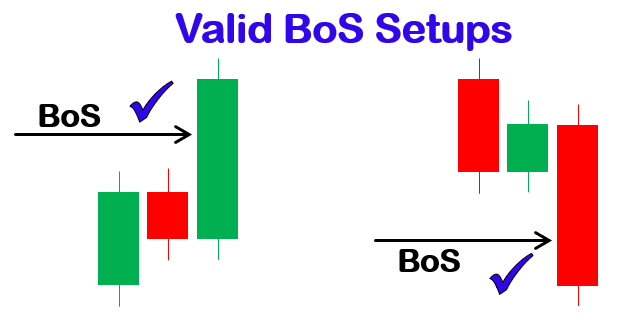
One rule only prevails: the break must be with the candle’s close. This means that in the case of a break regarding the swing high, the closing price should be above the swing point, while in the case of a break regarding the swing low, the closing price should be below the swing point as well. Simply put, only breaks on candle or bar bodies are considered valid Breaks of Structures, meaning that breaks on candle tails, shadows, or wicks, are considered invalid Breaks of Structures.
- Invalid BoS setups:
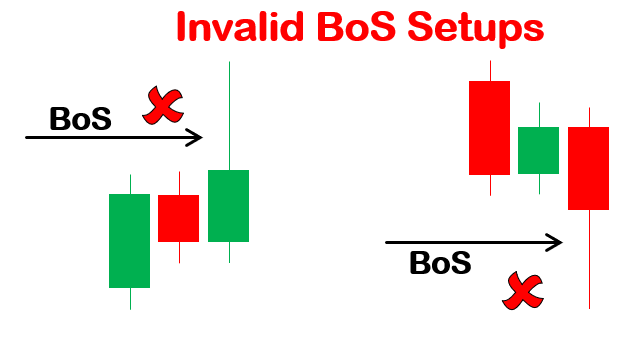
- Valid BoS setups:
Types of Breaks of Structure
As already said, Break of Structures occurs in trending markets, which means they occur either in uptrends or downtrends. This already suggests that we have only two types of Breaks of Structures.
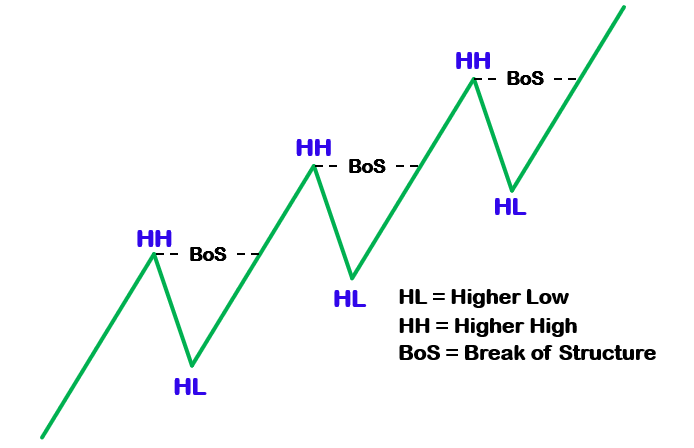
- Bullish Break of Structure
These occur in uptrends which are characterized by higher highs (HH) and higher lows (HL). Technically, a Break of Structure results from the price breaking the recent higher high in the uptrend, and forming a new higher high.
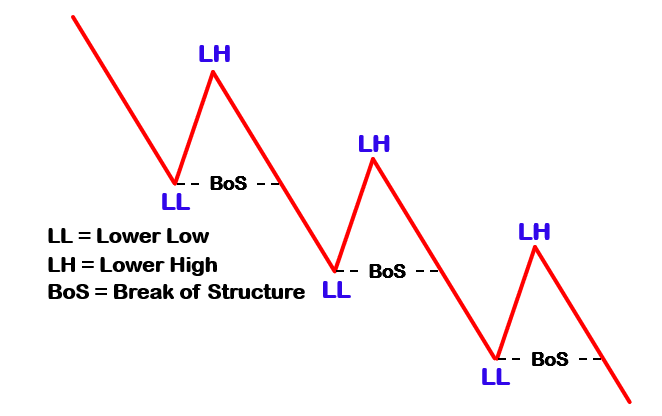
- Bearish Break of Structure
Here, bearish Break of Structure occurs in downtrends, composed of lower lows (LL) and lower highs (LH). A Break of Structure results from price breaking the recent lower low in the downtrend, and forming a new lower low.
Trading strategy description
To effectively trade using this strategy, you need a series of steps but don’t worry. We’ll cover them step-by-step.
Lay basis on higher time frames (HTF): Firstly, for a comprehensive analysis, examine higher timeframes for a selected asset, as it provides an overall overview of market trends. This can include a four-hour, or daily timeframe as they tend to reveal the long-term trajectory of the market. We avoid using a lower timeframe as it contains many swing points due to the manipulations, liquidity sweeps, and zigzags like a tipsy driver, resulting in more insignificant breaks.
Identify the underlying market trend: Secondly, you need to identify the current market trend on your chart. Uptrends contain patterns of higher highs and higher lows in price action, while downtrends consist of lower lows and lower highs patterns.
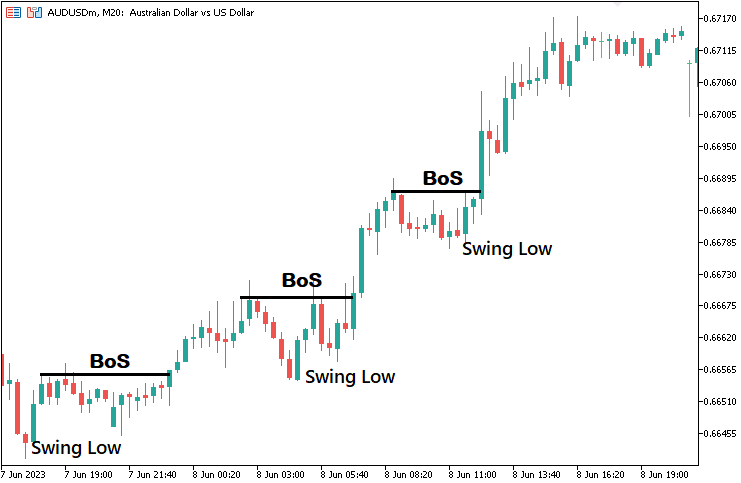
Identify entry points: After you identify the current trend on a higher timeframe, you can infiltrate the market on the break of a swing high or a swing low which closes with the body of the breaking candlestick. The stronger the candlestick, the more reassuring the signal confirmation.
Uptrend example:
Downtrend example:
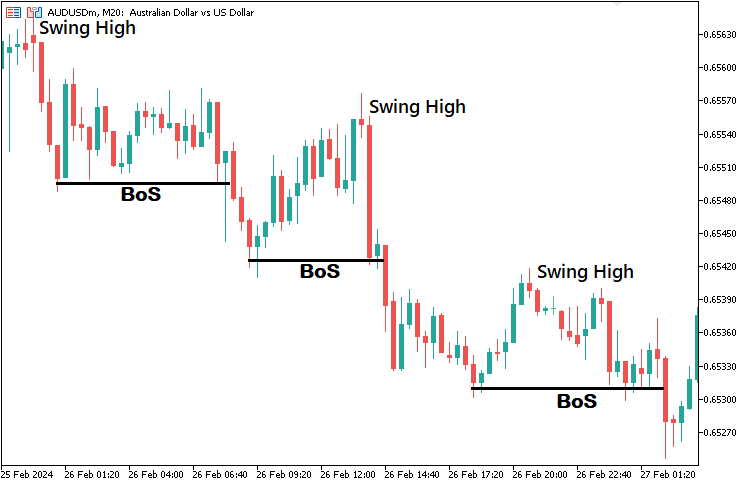
On a smaller timeframe, like a five-minute timeframe, you can use extra confirmation strategies like supply and demand, technical indicators like Relative Strength Index (RSI) and MACD (Moving Average Convergence Divergence), or Japanese candlestick patterns like engulfing or inside bar patterns.
Identify exit points: Upon entering the market, we need a solid strategy also to exit the market while managing our risks. For the stop loss, we place it at the previous swing point, provided it is close to the position’s entry point while leaving a meaningful profit catch for us. If that is not the case then, we use a risk-to-reward ratio of fixed pips. Conversely, we take profit at the next swing point, but since it is difficult to determine the future swing point for the take profit level, we use the risk-to-reward ratio as a beacon for the take profit.
Trading strategy blueprint
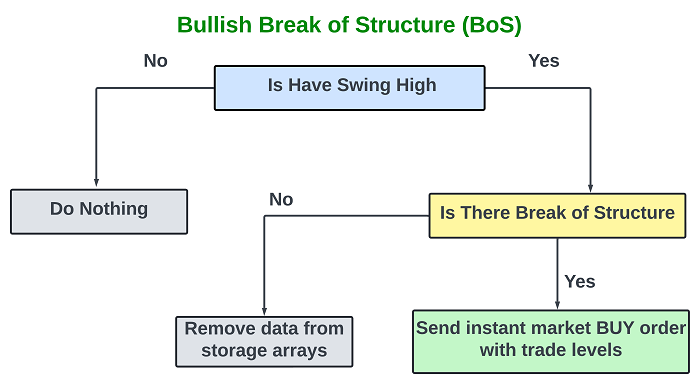
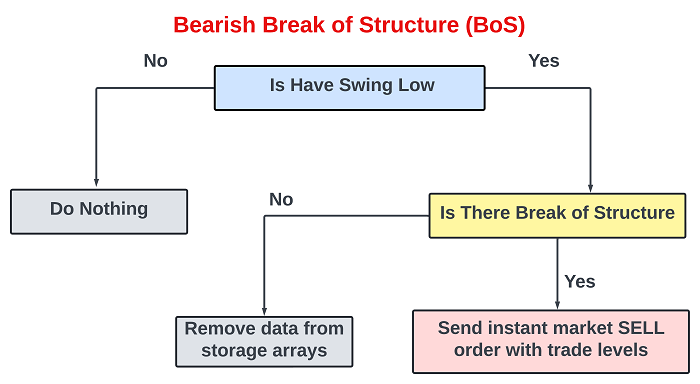
To easily understand the concept that we have relayed, let us visualize it in a blueprint.
Bullish Break of Structure:
Bearish Break of Structure:
Implementation in MetaQuotes Language 5 (MQL5) for MetaTrader 5 (MT5)
After learning all the theories about the Break of Structure trading strategy, let us then automate the theory and craft an Expert Advisor (EA) in MetaQuotes Language 5 (MQL5) for MetaTrader 5.
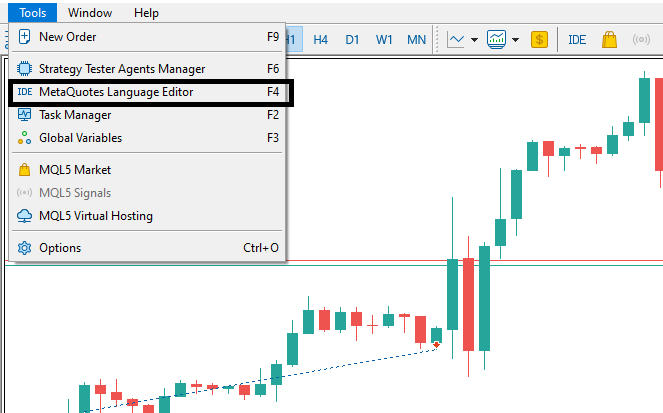
To create an EA, on your MetaTrader 5 terminal, click the Tools tab and check MetaQuotes Language Editor, or simply press F4 on your keyboard. This will open the MetaQuotes Language Editor environment, which allows the writing of trading robots, technical indicators, scripts, and libraries of functions.
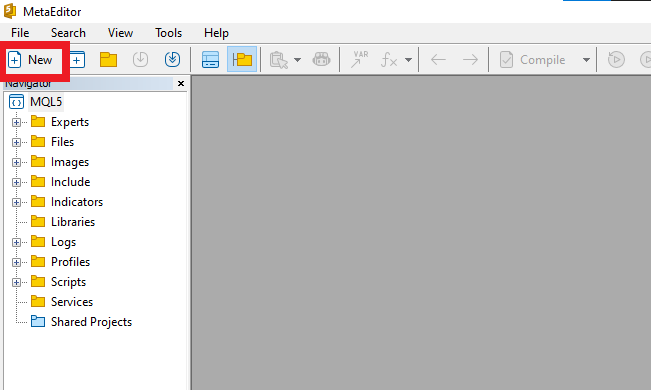
Once the MetaEditor is opened, click on New, and on the wizard that pops, check Expert Advisor (template) and click Next.
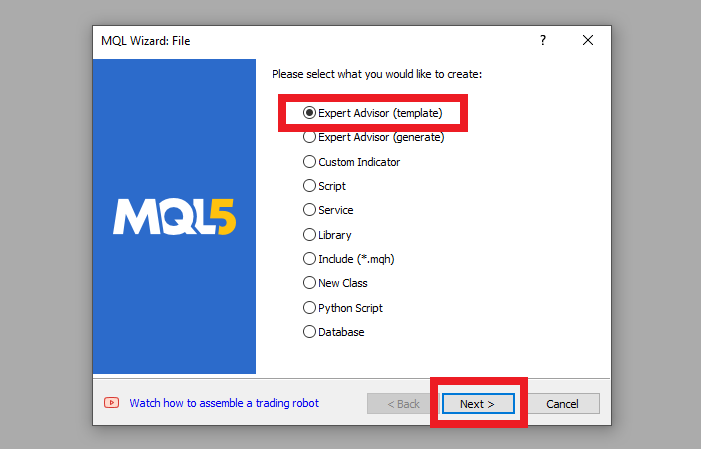
Then provide your desired expert advisor file name, click Next, click Next, and then click Finish. After doing all that, we are now ready to code and program our Break of Structure (BoS) strategy.
First, we include a trade instance by using #include at the beginning of the source code. This gives us access to the CTrade class, which we will use to create a trade object. This is crucial as we need it to open trades.
#include <Trade/Trade.mqh>
CTrade obj_Trade;
Most of our activities will be executed on the OnTick event handler. Since it is just pure price action, we will not need to use the OnInit event handler for indicator handle initialization. Thus, the whole of our code will be executed only on the OnTick event handler. First, let us have a look at the parameters the function takes besides its functions, since it is the heart of this code:
void OnTick(){

}
As it is already seen, this is a simple yet crucial function that does not take any arguments or return anything. It is just a void function, meaning it does not have to return anything. This function is used in Expert Advisors and is executed when there is a new tick, that is, a change in price quotes for the particular commodity.
So now that we have seen that the OnTick function is generated on every change in price quotes, we need to define some control logic that we will later on use to control the execution of specific code snippets, such that they are executed once per bar and not on every tick, at least to avoid unnecessary code runs, hence saving the device memory. That will be necessary when looking for swing highs and swing lows. We don't need to search for each tick, yet we will always get the same results, provided we are still on the same candlestick. Here is the logic:
   static bool isNewBar = false;
   int currBars = iBars(_Symbol,_Period);
   static int prevBars = currBars;
   if (prevBars == currBars){isNewBar = false;}
   else if (prevBars != currBars){isNewBar = true; prevBars = currBars;}
First, we declare a static boolean variable named "isNewBar" and initialize it with the value "false". The purpose of this variable is to track whether a new bar has formed on the chart. We declare the local variable with the keyword "static" so that it can retain its value throughout the function lifetime. This means it will not be dynamic. Typically, our variable will always be equal to false not unless we change it later on to true, and when changed, it will retain its value and not be updated on the next tick, contrary to when it is dynamic, where it will be always updated to the initialization value.
Then, we declare another integer variable "currBars" which stores the calculated number of current bars on the chart for the specified trading symbol and period or rather timeframe as you might have heard it. This is achieved by the use of the iBars function, which takes just two arguments, that is, symbol and period.
Again, we declare another static integer variable "prevBars" to store the total number of previous bars on the chart when a new bar is generated, and still initialize it with the value of current bars on the chart for the first run of the function. We will use it to compare the current number of bars with the previous number of bars, to determine the instance of a new bar generation on the chart.
Finally, we use a conditional statement to check whether the current number of bars is equal to the previous number of bars. If they are equal, it means that no new bar has formed, so the "isNewBar" variable remains false. Otherwise, if the current and previous bar counts are not equal, it indicates that a new bar has formed. In this case, we set the "isNewBar" variable to true, and update the "prevBars" to match the current bar count. Thus, with this code snippet, we can keep track of whether a new bar has formed, and use the result later on to make sure we only execute an instance once per bar.
Now, we can proceed to look for swing points on our chart. We will need a range of scans for the points. We plan to achieve this by selecting a particular bar and scanning all the neighboring bars, to the right and the left, of course within the pre-defined range of bars, and determining if the current bar is the highest within the range in case of a swing high, or lowest in case of a swing low. So first, let us define the variables that we will need to store this logic.
   const int length = 20;
   const int limit = 20;
Here, we declare two integer variables "length" and "limit". Length represents the range of bars to be considered when identifying swing highs and lows, while limit represents the index of the current bar that is being scanned at that particular instance. For example, let us assume we have selected a bar at index 10 for scanning to identify if it is a swing high. We then loop via all the neighboring bars to the right and left and find if there is another bar that is higher than the current bar, which is at index 10. Therefore, the bar to the left is the bar before the current bar and is thus found at index (limit, which is equal to 10, + 1) 11. The same case happens when proceeding to the right.
By default, we initialize the variables to 20. Also, you should have noticed that we declare them as "const" to make them constant. This is made to ensure that their value remains fixed throughout the program execution, resulting in consistency which helps maintain the same analysis range for swing points across different bars. Keeping the values constant also helps prevent accidental modification of the variables during program execution.
Let us then quickly define the other crucial variables of the program. We need to keep track of the current bar being analyzed and assess its relationship with neighboring bars within the predefined range. We achieve this by the declaration of the following variables.
   int right_index, left_index;
   bool isSwingHigh = true, isSwingLow = true;
   static double swing_H = -1.0, swing_L = -1.0;
   int curr_bar = limit;
We first declare two integer variables "right_index" and "left_index" to keep track of indices of neighboring bars. The right index represents the index of the bar to the right of the current bar while the left index represents the index of the bar to the left of the current bar, which is the bar selected for analysis. Again, we declare two boolean variables "isSwingHigh" and "isSwingLow" which serve as flags to determine whether the current bar is a potential swing high or low respectively, and initialize them to true. After analysis, if either of the flags remains true, it will indicate the presence of a swing point. Moreover, we declare static double variables "swing_H" and "swing_L" which will store the price levels of the swing highs and lows respectively. We initialize them to values of -1 to simply indicate that no swing high or low has been detected yet. They are made static to ensure that once we have the swing points, they remain unchanged and we can store them for future reference, to identify later on if they are broken by a change of structure. We will change them to -1 if we have a break of structure, or they will be replaced by new swing points that are generated. Finally, we have the "curr_bar" variable which determines the starting point for the analysis.
To this point, we have perfectly and sufficiently declared all the variables that are crucial to the program and we can begin our analysis loop. To analyze and map the swing points, we only need to do it once per bar. Thus, the analysis for the swing points will only be done once per bar, and this is where our "isNewBar" variable comes in handy.
if (isNewBar){ ... } We then instantiate a for loop to find the swing highs and lows.
      for (int j=1; j<=length; j++){
         right_index = curr_bar - j;
         left_index = curr_bar + j;
         if ( (high(curr_bar) <= high(right_index)) || (high(curr_bar) < high(left_index)) ){
            isSwingHigh = false;
         }
         if ( (low(curr_bar) >= low(right_index)) || (low(curr_bar) > low(left_index)) ){
            isSwingLow = false;
         }
      }
We declare a loop integer variable "j" to represent the number of bars to consider when comparing the current bar with its neighbors. We then calculate the index of the bar to the right of the current bar by subtracting "j" from the current bar. Using the same logic, we get the index of the neighboring bar on the left side by adding "j" to the current bar. If we were to print the results for visuality reasons, this is what we get:
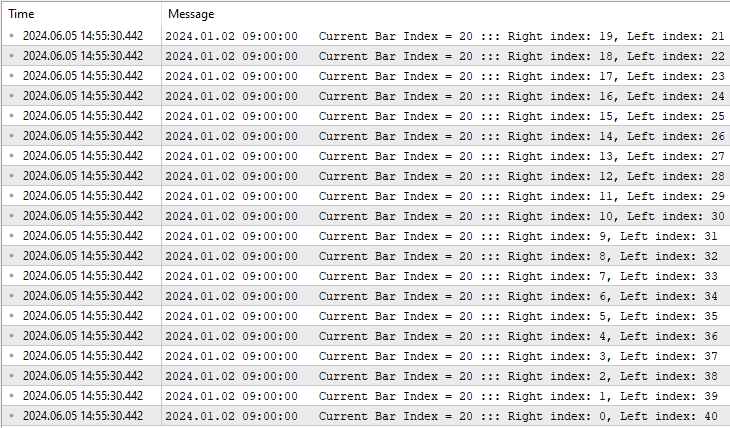
The print statements were achieved by the use of the following in-built function:
Print("Current Bar Index = ",curr_bar," ::: Right index: ",right_index,", Left index: ",left_index);
Up to this extent, it is crystal clear that for the selected bar index, in this case, 20, we assess all the neighboring bars to the left and right within the specified length. It is evident that on each iteration, we negate one to the right and add one to the left, which results in the right index attaining the value zero, typically signifying the current bar, and the left index doubling the predefined length. Now that we are certain we have done the bar assessment correctly, we proceed to determine the presence of the swing points on each iteration.
To determine if there is a swing high, we use a conditional statement to check whether the high price of the current bar is less than or equal to the high price of the bar at the right index or less than the high price of the bar at the left index. If either condition is true, it means the current bar does not have a higher high compared to its neighbors, so "isSwingHigh" is set to false. To determine if there is a swing low, the same logic prevails, but with inverse conditions.
By the end of the loop, if "isSwingHigh" is still true, it suggests that the current bar has a higher high than the surrounding bars within the length range, marking a potential swing high. The same logic still applies to the swing low flag. If that is true, we fill the swing point variables with the respective prices and draw the swing points.
      if (isSwingHigh){
         swing_H = high(curr_bar);
         Print("UP @ BAR INDEX ",curr_bar," of High: ",high(curr_bar));
         drawSwingPoint(TimeToString(time(curr_bar)),time(curr_bar),high(curr_bar),77,clrBlue,-1);
      }
      if (isSwingLow){
         swing_L = low(curr_bar);
         Print("DOWN @ BAR INDEX ",curr_bar," of Low: ",low(curr_bar));
         drawSwingPoint(TimeToString(time(curr_bar)),time(curr_bar),low(curr_bar),77,clrRed,1);
      }
Custom functions are used to get the high prices of the swing high points and low prices of the swing low points. The functions are declared as below:
double high(int index){return (iHigh(_Symbol,_Period,index));}
double low(int index){return (iLow(_Symbol,_Period,index));}
double close(int index){return (iClose(_Symbol,_Period,index));}
datetime time(int index){return (iTime(_Symbol,_Period,index));}
The high function takes a single parameter or argument, which represents the index of the bar within the price data series, from which the high price of the specified bar at the given index is to be retrieved. The same logic applies to the low, close, and time functions.
To draw the swing point on the chart to the respective bar for visualization purposes, we use the following custom function:
void drawSwingPoint(string objName,datetime time,double price,int arrCode,
   color clr,int direction){

   if (ObjectFind(0,objName) < 0){
      ObjectCreate(0,objName,OBJ_ARROW,0,time,price);
      ObjectSetInteger(0,objName,OBJPROP_ARROWCODE,arrCode);
      ObjectSetInteger(0,objName,OBJPROP_COLOR,clr);
      ObjectSetInteger(0,objName,OBJPROP_FONTSIZE,10);
      if (direction > 0) ObjectSetInteger(0,objName,OBJPROP_ANCHOR,ANCHOR_TOP);
      if (direction < 0) ObjectSetInteger(0,objName,OBJPROP_ANCHOR,ANCHOR_BOTTOM);

      string txt = " BoS";
      string objNameDescr = objName + txt;
      ObjectCreate(0,objNameDescr,OBJ_TEXT,0,time,price);
      ObjectSetInteger(0,objNameDescr,OBJPROP_COLOR,clr);
      ObjectSetInteger(0,objNameDescr,OBJPROP_FONTSIZE,10);
      if (direction > 0) {
         ObjectSetInteger(0,objNameDescr,OBJPROP_ANCHOR,ANCHOR_LEFT_UPPER);
         ObjectSetString(0,objNameDescr,OBJPROP_TEXT, " " + txt);
      }
      if (direction < 0) {
         ObjectSetInteger(0,objNameDescr,OBJPROP_ANCHOR,ANCHOR_LEFT_LOWER);
         ObjectSetString(0,objNameDescr,OBJPROP_TEXT, " " + txt);
      }
   }
   ChartRedraw(0);
}
The custom function "drawSwingPoint" takes six parameters to ease its re-usability. The functions of the parameters are as follows:
- objName: A string representing the name of the graphical object to be created.
- time: A datetime value indicating the time coordinate where the object should be placed.
- price: A double value representing the price coordinate where the object should be placed.
- arrCode: An integer specifying the arrow code for the arrow object.
- clr: A color value (e.g., clrBlue, clrRed) for the graphical objects.
- direction: An integer indicating the direction (up or down) for positioning the text label.
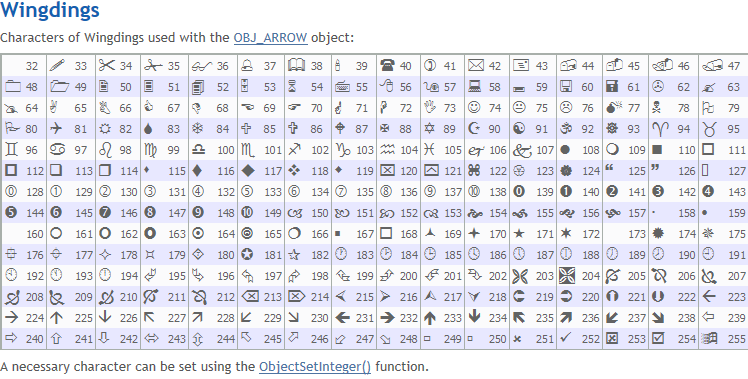
The function first checks whether an object with the specified objName already exists on the chart. If not, it proceeds to create the objects. The creation of the object is achieved by the use of the in-built "ObjectCreate" function, which requires specification of the object to be drawn, in this case, the arrow object identified as "OBJ_ARROW", as well as the time and price, which forms the ordinates of the object creation point. Afterward, we set the object properties arrow code, color, font size, and anchoring point. For the arrow code, MQL5 has some already predefined characters of the wingdings font that can be directly used. Here is a table specifying the characters:
Up to this point, we only draw the specified arrow to the chart as follows:
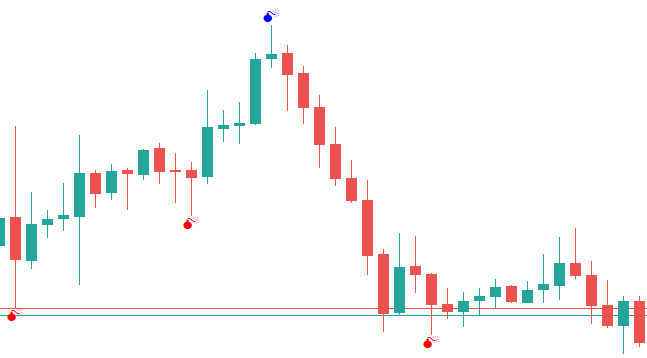
We can see that we managed to draw the swing points with the specified arrow code, in this case, we used arrow code 77, but there is no description of them. Therefore, to add the respective description, we proceed to concatenate the arrow with a text. We create another text object specified as "OBJ_TEXT" and set its respective properties as well. The text label serves as a descriptive annotation associated with the swing point, by providing additional context or information about the swing point, making it more informative for traders and analysts. We choose the value of the text to be "BoS", signifying that it is a swing point.
The variable "objNameDescr" is then created by concatenating the original "objName" with the descriptive text. This combined name ensures that the arrow and its associated text label are linked together. This specific code snippet is used to achieve that.
      string txt = " BoS";
      string objNameDescr = objName + txt;
      ObjectCreate(0,objNameDescr,OBJ_TEXT,0,time,price);
      ObjectSetInteger(0,objNameDescr,OBJPROP_COLOR,clr);
      ObjectSetInteger(0,objNameDescr,OBJPROP_FONTSIZE,10);
      if (direction > 0) {
         ObjectSetInteger(0,objNameDescr,OBJPROP_ANCHOR,ANCHOR_LEFT_UPPER);
         ObjectSetString(0,objNameDescr,OBJPROP_TEXT, " " + txt);
      }
      if (direction < 0) {
         ObjectSetInteger(0,objNameDescr,OBJPROP_ANCHOR,ANCHOR_LEFT_LOWER);
         ObjectSetString(0,objNameDescr,OBJPROP_TEXT, " " + txt);
      }
This is what we get as a result of the swing point concatenation with its description.
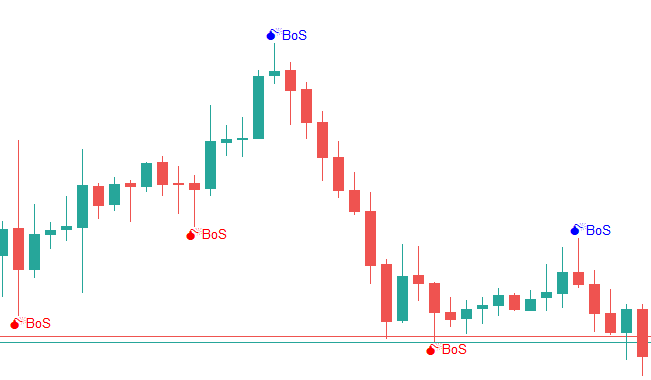
The full code responsible for the analysis of the bars, identification of the swing highs and lows, data documentation, and the respective mapping of the objects to the chart swing points is as below:
   if (isNewBar){
      for (int j=1; j<=length; j++){
         right_index = curr_bar - j;
         left_index = curr_bar + j;

         if ( (high(curr_bar) <= high(right_index)) || (high(curr_bar) < high(left_index)) ){
            isSwingHigh = false;
         }
         if ( (low(curr_bar) >= low(right_index)) || (low(curr_bar) > low(left_index)) ){
            isSwingLow = false;
         }
      }

      if (isSwingHigh){
         swing_H = high(curr_bar);
         Print("UP @ BAR INDEX ",curr_bar," of High: ",high(curr_bar));
         drawSwingPoint(TimeToString(time(curr_bar)),time(curr_bar),high(curr_bar),77,clrBlue,-1);
      }
      if (isSwingLow){
         swing_L = low(curr_bar);
         Print("DOWN @ BAR INDEX ",curr_bar," of Low: ",low(curr_bar));
         drawSwingPoint(TimeToString(time(curr_bar)),time(curr_bar),low(curr_bar),77,clrRed,1);
      }
   }
Next, we just identify the instances of the break of the swing points as described in the theory part, and if there exists an instance, we visualize the break and open market positions respectively. This requires to be done on every tick, so we do it without the new bars restriction. We first declare the Ask and Bid prices that we will use to open the positions once the respective conditions are met. Note that this needs to also be done on every tick so that we get the latest price quotes.
   double Ask = NormalizeDouble(SymbolInfoDouble(_Symbol,SYMBOL_ASK),_Digits);
   double Bid = NormalizeDouble(SymbolInfoDouble(_Symbol,SYMBOL_BID),_Digits);
Here, we declare the double data type variables for storing the recent prices and normalize them to the digits of the symbol currency by rounding the floating point number to maintain accuracy.
To determine if there has been a price advance and break of the swing high point level, we use a conditional statement. First, we check whether a swing high point is in existence, by the logic that it is greater than zero, simply because we cannot be breaking above some swing high that we do not already have. Then, if we do have a swing high point already, we check that the bid price is above the swing high level, to ensure that the buy position is opened at the asking price and the trade levels, that is stop loss and take profit which are associated with the bid price, are correctly mapped at a point above the breaking level. Finally, we check if the closing price of the previous bar is above the swing high level, to ensure we have a valid break that meets the requirements. If all the conditions are met, we then have a valid Break of Structure (BoS), and we print the instance to the journal.
   if (swing_H > 0 && Bid > swing_H && close(1) > swing_H){
      Print("BREAK UP NOW");
      ...
   }
To visualize the break setup, we will need to draw an arrow that spans from the swing high point to the candle where the break occurs. This means that we will need two coordinates for the two points of the arrow to be created, typically the beginning of the arrow which is to be attached to the swing point, and the end of the arrow which is the candle where the break occurs. This is much easier represented on an image as below:
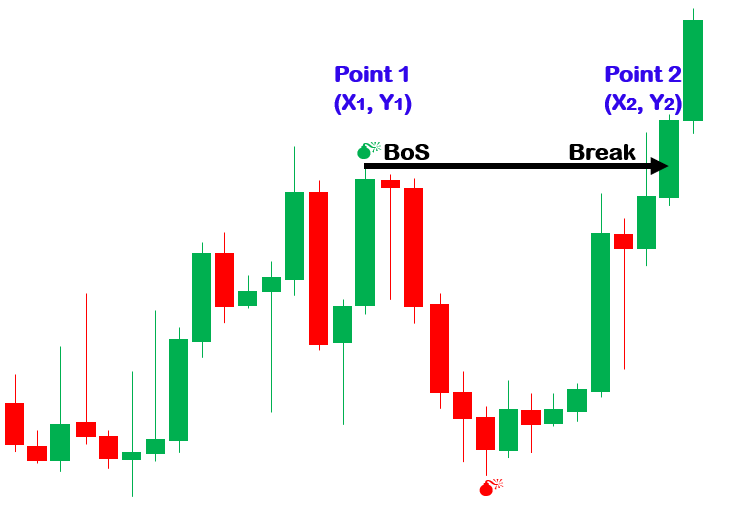
The two coordinates that we do need are the time, shown as X and represented on the x-axis, and price, shown as Y and represented on the y-axis. To get the second coordinates, that is the candle where the break of structure occurs, we use the current bar index, which is typically 0. However, to get the index of the bar that contains the swing high point is a bit tricky. Recall that we only stored the price of the swing-high candle. We could also store the bar index during the same time we store the price, but it would be completely of no use since new bars become generated afterward. This does not mean that we cannot find the index of the bar that contains the swing point. We can loop via the prior bars' high prices and find one that matches our swing high point. Below is how that is achieved.
      int swing_H_index = 0;
      for (int i=0; i<=length*2+1000; i++){
         double high_sel = high(i);
         if (high_sel == swing_H){
            swing_H_index = i;
            Print("BREAK HIGH @ BAR ",swing_H_index);
            break;
         }
      }
We first declare an integer variable "swing_H_index" which will hold our swing high index and initialize it to zero. Then use for loop to loop via the double of all the predefined bars plus an extra bar range of 1000, just an arbitrary number of bars that the swing point could be found, this can be any value, and compare the high of the selected bar with the stored swing high point. So if we find a match, we store the index and break out of the loop prematurely since we have already found our swing high bar index.
Using the swing high bar index, we can now retrieve the bar's properties, in this case, we are only interested in the time to mark the x coordinates of the arrow starting point. We use a custom function that is not much different from the previous function that we used to map the arrow code.
void drawBreakLevel(string objName,datetime time1,double price1,
   datetime time2,double price2,color clr,int direction){
   if (ObjectFind(0,objName) < 0){
      ObjectCreate(0,objName,OBJ_ARROWED_LINE,0,time1,price1,time2,price2);
      ObjectSetInteger(0,objName,OBJPROP_TIME,0,time1);
      ObjectSetDouble(0,objName,OBJPROP_PRICE,0,price1);
      ObjectSetInteger(0,objName,OBJPROP_TIME,1,time2);
      ObjectSetDouble(0,objName,OBJPROP_PRICE,1,price2);
      ObjectSetInteger(0,objName,OBJPROP_COLOR,clr);
      ObjectSetInteger(0,objName,OBJPROP_WIDTH,2);

      string txt = " Break   ";
      string objNameDescr = objName + txt;
      ObjectCreate(0,objNameDescr,OBJ_TEXT,0,time2,price2);
      ObjectSetInteger(0,objNameDescr,OBJPROP_COLOR,clr);
      ObjectSetInteger(0,objNameDescr,OBJPROP_FONTSIZE,10);
      if (direction > 0) {
         ObjectSetInteger(0,objNameDescr,OBJPROP_ANCHOR,ANCHOR_RIGHT_UPPER);
         ObjectSetString(0,objNameDescr,OBJPROP_TEXT, " " + txt);
      }
      if (direction < 0) {
         ObjectSetInteger(0,objNameDescr,OBJPROP_ANCHOR,ANCHOR_RIGHT_LOWER);
         ObjectSetString(0,objNameDescr,OBJPROP_TEXT, " " + txt);
      }
   }
   ChartRedraw(0);
}
Here are the differences in the function from the previous one.
- We declare the function name as "drawBreakLevel".
- The object we create is an arrowed line identified as "OBJ_ARROWED_LINE".
- Our arrowed line contains two coordinates with time 1 and price 1 for the first, and time 2 and price 2 for the second coordinate.
- The concatenation text is "Break", signaling that a Break of Structure (BoS) occurred.
We then use the function to draw the break-level arrowed line on the chart. For time 2 of the second coordinate, we just add 1, which takes us to the bar before the current bar for accuracy. We then reset the value of the swing high variable to -1, to signify that we already have broken the structure, and the setup does not exist anymore. This helps to avoid looking for the break of the swing high on the preceding ticks as we have already broken the swing high point. Thus, we just wait to form another swing high point, and the variable is filled again and the loop continues.
      drawBreakLevel(TimeToString(time(0)),time(swing_H_index),high(swing_H_index),
      time(0+1),high(swing_H_index),clrBlue,-1);

      swing_H = -1.0;
Finally, we open a buy position once we have the break of the swing high point.
      //--- Open Buy
      obj_Trade.Buy(0.01,_Symbol,Ask,Bid-500*7*_Point,Bid+500*_Point,"BoS Break Up BUY");

      return;
We use our object "obj_Trade" and the dot operator to get access to all the methods contained in the class. In this case, we just need to buy and thus use the "Buy" method, providing the volume, trade levels, and trade comment. Finally, we just return since everything is all set and we do not have any more code to execute. However, if you have further code, just avoid using the return operator, as it terminates the current function execution and returns control to the calling program. The full code that makes sure we find the breaks of the structure, draw the arrowed lines, and open buy positions are as follows:
   if (swing_H > 0 && Bid > swing_H && close(1) > swing_H){
      Print("BREAK UP NOW");
      int swing_H_index = 0;
      for (int i=0; i<=length*2+1000; i++){
         double high_sel = high(i);
         if (high_sel == swing_H){
            swing_H_index = i;
            Print("BREAK HIGH @ BAR ",swing_H_index);
            break;
         }
      }
      drawBreakLevel(TimeToString(time(0)),time(swing_H_index),high(swing_H_index),
      time(0+1),high(swing_H_index),clrBlue,-1);

      swing_H = -1.0;

      //--- Open Buy
      obj_Trade.Buy(0.01,_Symbol,Ask,Bid-500*7*_Point,Bid+500*_Point,"BoS Break Up BUY");

      return;
   }
For the break of swing lows, the concurrent drawing of the arrowed break lines, and the opening of sell positions, the same logic prevails only with inverse conditions. Its full code is as below:
   else if (swing_L > 0 && Ask < swing_L && close(1) < swing_L){
      Print("BREAK DOWN NOW");
      int swing_L_index = 0;
      for (int i=0; i<=length*2+1000; i++){
         double low_sel = low(i);
         if (low_sel == swing_L){
            swing_L_index = i;
            Print("BREAK LOW @ BAR ",swing_L_index);
            break;
         }
      }
      drawBreakLevel(TimeToString(time(0)),time(swing_L_index),low(swing_L_index),
      time(0+1),low(swing_L_index),clrRed,1);

      swing_L = -1.0;

      //--- Open Sell
      obj_Trade.Sell(0.01,_Symbol,Bid,Ask+500*7*_Point,Ask-500*_Point,"BoS Break Down SELL");

      return;
   }
Here is the representation of the milestone.
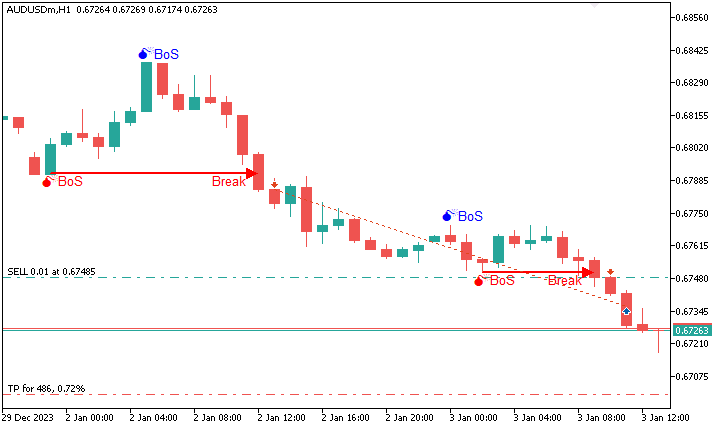
The following is the full code that is needed to create a Break of Structure (BoS) forex trading strategy in MQL5 that identifies the breaks and opens positions respectively.
//+------------------------------------------------------------------+
//|                                                          BOS.mq5 |
//|                                  Copyright 2024, MetaQuotes Ltd. |
//|                                             https://www.mql5.com |
//+------------------------------------------------------------------+
#property copyright "Copyright 2024, MetaQuotes Ltd."
#property link      "https://www.mql5.com"
#property version   "1.00"

#include <Trade/Trade.mqh>
CTrade obj_Trade;

//+------------------------------------------------------------------+
//| Expert initialization function                                   |
//+------------------------------------------------------------------+
int OnInit(){return(INIT_SUCCEEDED);}
//+------------------------------------------------------------------+
//| Expert deinitialization function                                 |
//+------------------------------------------------------------------+
void OnDeinit(const int reason){}
//+------------------------------------------------------------------+
//| Expert tick function                                             |
//+------------------------------------------------------------------+
void OnTick(){

   static bool isNewBar = false;
   int currBars = iBars(_Symbol,_Period);
   static int prevBars = currBars;
   if (prevBars == currBars){isNewBar = false;}
   else if (prevBars != currBars){isNewBar = true; prevBars = currBars;}

   const int length = 5;
   const int limit = 5;

   int right_index, left_index;
   bool isSwingHigh = true, isSwingLow = true;
   static double swing_H = -1.0, swing_L = -1.0;
   int curr_bar = limit;

   if (isNewBar){
      for (int j=1; j<=length; j++){
         right_index = curr_bar - j;
         left_index = curr_bar + j;
         //Print("Current Bar Index = ",curr_bar," ::: Right index: ",right_index,", Left index: ",left_index);
         //Print("curr_bar(",curr_bar,") right_index = ",right_index,", left_index = ",left_index);
         // If high of the current bar curr_bar is <= high of the bar at right_index (to the left),
         //or if it’s < high of the bar at left_index (to the right), then isSwingHigh is set to false
         //This means that the current bar curr_bar does not have a higher high compared
         //to its neighbors, and therefore, it’s not a swing high
         if ( (high(curr_bar) <= high(right_index)) || (high(curr_bar) < high(left_index)) ){
            isSwingHigh = false;
         }
         if ( (low(curr_bar) >= low(right_index)) || (low(curr_bar) > low(left_index)) ){
            isSwingLow = false;
         }
      }
      //By the end of the loop, if isSwingHigh is still true, it suggests that
      //current bar curr_bar has a higher high than the surrounding bars within
      //length range, marking a potential swing high.

      if (isSwingHigh){
         swing_H = high(curr_bar);
         Print("UP @ BAR INDEX ",curr_bar," of High: ",high(curr_bar));
         drawSwingPoint(TimeToString(time(curr_bar)),time(curr_bar),high(curr_bar),77,clrBlue,-1);
      }
      if (isSwingLow){
         swing_L = low(curr_bar);
         Print("DOWN @ BAR INDEX ",curr_bar," of Low: ",low(curr_bar));
         drawSwingPoint(TimeToString(time(curr_bar)),time(curr_bar),low(curr_bar),77,clrRed,1);
      }
   }

   double Ask = NormalizeDouble(SymbolInfoDouble(_Symbol,SYMBOL_ASK),_Digits);
   double Bid = NormalizeDouble(SymbolInfoDouble(_Symbol,SYMBOL_BID),_Digits);

   if (swing_H > 0 && Bid > swing_H && close(1) > swing_H){
      Print("BREAK UP NOW");
      int swing_H_index = 0;
      for (int i=0; i<=length*2+1000; i++){
         double high_sel = high(i);
         if (high_sel == swing_H){
            swing_H_index = i;
            Print("BREAK HIGH @ BAR ",swing_H_index);
            break;
         }
      }
      drawBreakLevel(TimeToString(time(0)),time(swing_H_index),high(swing_H_index),
      time(0+1),high(swing_H_index),clrBlue,-1);

      swing_H = -1.0;

      //--- Open Buy
      obj_Trade.Buy(0.01,_Symbol,Ask,Bid-500*7*_Point,Bid+500*_Point,"BoS Break Up BUY");

      return;
   }
   else if (swing_L > 0 && Ask < swing_L && close(1) < swing_L){
      Print("BREAK DOWN NOW");
      int swing_L_index = 0;
      for (int i=0; i<=length*2+1000; i++){
         double low_sel = low(i);
         if (low_sel == swing_L){
            swing_L_index = i;
            Print("BREAK LOW @ BAR ",swing_L_index);
            break;
         }
      }
      drawBreakLevel(TimeToString(time(0)),time(swing_L_index),low(swing_L_index),
      time(0+1),low(swing_L_index),clrRed,1);

      swing_L = -1.0;

      //--- Open Sell
      obj_Trade.Sell(0.01,_Symbol,Bid,Ask+500*7*_Point,Ask-500*_Point,"BoS Break Down SELL");

      return;
   }

}
//+------------------------------------------------------------------+

double high(int index){return (iHigh(_Symbol,_Period,index));}
double low(int index){return (iLow(_Symbol,_Period,index));}
double close(int index){return (iClose(_Symbol,_Period,index));}
datetime time(int index){return (iTime(_Symbol,_Period,index));}

void drawSwingPoint(string objName,datetime time,double price,int arrCode,
   color clr,int direction){

   if (ObjectFind(0,objName) < 0){
      ObjectCreate(0,objName,OBJ_ARROW,0,time,price);
      ObjectSetInteger(0,objName,OBJPROP_ARROWCODE,arrCode);
      ObjectSetInteger(0,objName,OBJPROP_COLOR,clr);
      ObjectSetInteger(0,objName,OBJPROP_FONTSIZE,10);
      if (direction > 0) ObjectSetInteger(0,objName,OBJPROP_ANCHOR,ANCHOR_TOP);
      if (direction < 0) ObjectSetInteger(0,objName,OBJPROP_ANCHOR,ANCHOR_BOTTOM);

      string txt = " BoS";
      string objNameDescr = objName + txt;
      ObjectCreate(0,objNameDescr,OBJ_TEXT,0,time,price);
      ObjectSetInteger(0,objNameDescr,OBJPROP_COLOR,clr);
      ObjectSetInteger(0,objNameDescr,OBJPROP_FONTSIZE,10);
      if (direction > 0) {
         ObjectSetInteger(0,objNameDescr,OBJPROP_ANCHOR,ANCHOR_LEFT_UPPER);
         ObjectSetString(0,objNameDescr,OBJPROP_TEXT, " " + txt);
      }
      if (direction < 0) {
         ObjectSetInteger(0,objNameDescr,OBJPROP_ANCHOR,ANCHOR_LEFT_LOWER);
         ObjectSetString(0,objNameDescr,OBJPROP_TEXT, " " + txt);
      }
   }
   ChartRedraw(0);
}

void drawBreakLevel(string objName,datetime time1,double price1,
   datetime time2,double price2,color clr,int direction){
   if (ObjectFind(0,objName) < 0){
      ObjectCreate(0,objName,OBJ_ARROWED_LINE,0,time1,price1,time2,price2);
      ObjectSetInteger(0,objName,OBJPROP_TIME,0,time1);
      ObjectSetDouble(0,objName,OBJPROP_PRICE,0,price1);
      ObjectSetInteger(0,objName,OBJPROP_TIME,1,time2);
      ObjectSetDouble(0,objName,OBJPROP_PRICE,1,price2);
      ObjectSetInteger(0,objName,OBJPROP_COLOR,clr);
      ObjectSetInteger(0,objName,OBJPROP_WIDTH,2);

      string txt = " Break   ";
      string objNameDescr = objName + txt;
      ObjectCreate(0,objNameDescr,OBJ_TEXT,0,time2,price2);
      ObjectSetInteger(0,objNameDescr,OBJPROP_COLOR,clr);
      ObjectSetInteger(0,objNameDescr,OBJPROP_FONTSIZE,10);
      if (direction > 0) {
         ObjectSetInteger(0,objNameDescr,OBJPROP_ANCHOR,ANCHOR_RIGHT_UPPER);
         ObjectSetString(0,objNameDescr,OBJPROP_TEXT, " " + txt);
      }
      if (direction < 0) {
         ObjectSetInteger(0,objNameDescr,OBJPROP_ANCHOR,ANCHOR_RIGHT_LOWER);
         ObjectSetString(0,objNameDescr,OBJPROP_TEXT, " " + txt);
      }
   }
   ChartRedraw(0);
}
Cheers to us! Now we created a smart money concept trading system based on the Break of Structure (BoS) forex trading strategy to not only generate trading signals but also open market positions based on the generated signals.
Strategy tester results
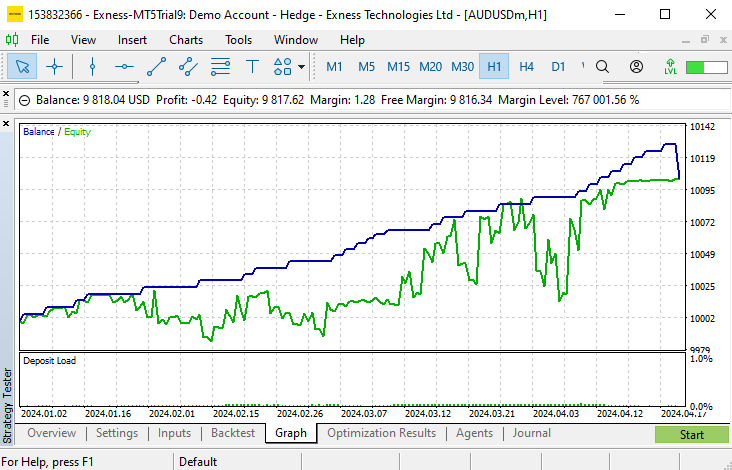
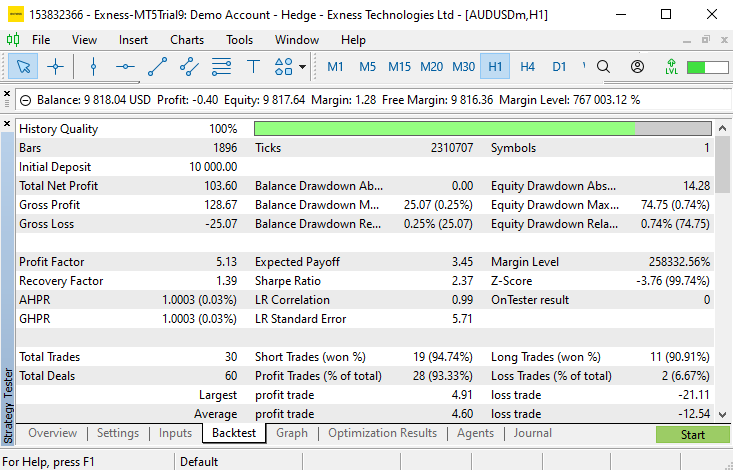
Upon testing on the strategy tester, here are the results.
- Balance/Equity graph:
- Backtest results:
Conclusion
In conclusion, we can confidently say that automation of the Break of Structure (BoS) strategy is not as complex as it is perceived once given the required thought. Technically, you can see that its creation required just a clear understanding of the strategy and the actual requirements, or rather the objectives that must be met to create a valid strategy setup.
Overall, the article emphasizes the theoretical part that must be taken into account and be clearly understood to create a BoS forex trading strategy. This involves its definition, description, and types besides its blueprint. Moreover, the coding aspect of the strategy highlights the steps that are taken to analyze the candlesticks, identify the swing points, track their breaks, visualize their outputs, and open trading positions based on the signals generated. In the long run, this enables automation of the BoS strategy, facilitating faster execution and the scalability of the strategy.
We do hope that you found the article helpful, fun, and easy to understand, in a way that you can make use of the presented knowledge in your development of future expert advisors. Technically, this eases your way of analyzing the market based on the Smart Money Concept (SMC) approach and particularly the Break of Structure (BoS) strategy.
 MQL5 Trading Toolkit (Part 1): Developing A Positions Management EX5 Library
 Building A Candlestick Trend Constraint Model (Part 4): Customizing Display Style For Each Trend Wave
 Developing a multi-currency Expert Advisor (Part 3): Architecture revision
 Integrating Hidden Markov Models in MetaTrader 5
- Free trading apps
- Over 8,000 signals for copying
- Economic news for exploring financial markets
You agree to website policy and terms of use
Thank you for the provided code base, it is actually very good.
With minimal changes I have adapted/changed.
The initial result without any filter added are really impressive.
I read it diagonally.
in the code, it caught my eye:
void function() {
const int localConst = 5; //
// some code follows
}
you can't do that. This is a disguise for "magic" constants
Author, I don't understand you. Your screenshot, which shows the upward trend, has HH and HL levels. But the screenshot that comes next creates confusion. Look:
So how to choose the right level to break?
Author, I don't understand you. Your screenshot, which shows the upward trend, has HH and HL levels. But the screenshot that comes next creates confusion. Look:
So how to choose the right level to break?
All such strategies work (and that is not a fact) only on days.
They do NOT work inside the day with its regular and sharp volatility spikes.
But it is convenient to select screenshots on intraday.
all such strategies work (and that's not a fact) only on daytrips.
Inside the day with its regular and sharp bursts of volatility DO NOT WORK.
But it is convenient to select screenshots on intraday.
The question was not about that