From Novice to Expert: Programming Candlesticks

Contents
- Introduction
- Understanding candlestick data and its fundamental programming mathematics.
- Building a collection of known candlestick patterns and a reusable candlestick pattern function library
- Testing
- Conclusion
Introduction
Over time, we have learned and memorized numerous candlestick pattern names. However, identifying them by eye on a chart is demanding and can be affected by parallax errors. The illusion of misinterpretation is highly possible due to how candlestick pattern logic is typically defined.
For example, a bullish engulfing pattern consists of a bearish candle followed by a bullish one. The bullish candle opens below the close of the bearish candle and closes above its open, completely covering the body of the bearish candle in a time series. The challenge lies in accurately judging the position of the bullish candle’s open in relation to the bearish candle’s close. The human eye is prone to occasional misjudgments, especially when analyzing charts visually.
Now, imagine backtesting this pattern manually across historical data—it would be tough and prone to multiple errors. However, if an algorithm is properly coded to detect these patterns and place strategic markers on the chart, identifying and backtesting them becomes significantly easier and more accurate.
Purpose of This Article
In this discussion, I aim to explore the programming of candlestick patterns, the fundamental mathematics behind them in MQL5, and ultimately, develop a candlestick pattern library, building upon existing ones.
Many investment websites list a vast number of candlestick patterns in natural language, but only a few go the extra mile to explore their algorithmic structure. Some might claim that all possible candlestick patterns have already been defined. However, I believe there is still room for innovation—new patterns can be discovered and named.
In this discussion, we will cover a few well-known patterns while equipping you with the ability to code any candlestick pattern you observe on a chart and name it in your own way. To keep things straightforward, we will focus on popular patterns for better comprehension.
It’s important to recognize that coding and inventing new patterns can be a tedious process, but the reward is significant—creating an algorithm that automates pattern recognition will free you from repetitive manual analysis for life.
What’s Next?
The next section is packed with my research and key concepts that I have compiled to give structure to this discussion. Follow along carefully, and I’m confident you will find great value in this reading.
Understanding candlestick data and its fundamental programming operations
I assume you are already familiar with the basics of candlestick patterns from various sources, including the MQL5 Community, other websites, and books. If you need a refresher, you can take a brief look at this link to get some background information before continuing. My goal here is not to reinvent the wheel, but to demonstrate how we can apply the MQL5 language to translate traditional candlestick analysis into an algorithmic framework. This approach helps those who understand candlestick patterns conceptually develop a more structured, algorithmic mindset—potentially enabling them to start automating their own trading strategies in MQL5.
For a beginner, it is important to start with simple concepts and gradually build up your coding skills. Begin by learning to define bullish and bearish candles using basic relational operators. Once you are comfortable with these comparisons, move on to single-candle patterns by integrating arithmetic operations to measure body sizes and wick lengths. After mastering single-candle analysis, proceed to multi-candle patterns, where you learn to use indexing to compare data from multiple candles. Testing your work with functions like Print() helps verify that your logic is working as expected.
In a quick review, candlesticks are a visual tool used in trading to show how prices move over a specified period, such as an hour or a day. Each candlestick is defined by four key prices: the open (the price at the beginning of the period), high (the maximum price during the period), low (the minimum price), and close (the price at the end of the period). The “body” of the candlestick represents the range between the open and the close, while the “wicks” or shadows extend from the body to the high and low prices. This structure allows you to quickly assess market sentiment. For example, if the closing price is higher than the opening price, the candle is considered bullish, indicating upward momentum. Conversely, if the closing price is lower than the opening price, it is bearish, indicating a downtrend.
I want to introduce you to a few key terms that, I believe, are essential as you start working with time series data. These concepts are fundamental for understanding and implementing candlestick pattern recognition in MQL5. I've explained them in my own words based on my research to provide a clear and practical interpretation:
These are comparison operators, similar to the inequalities you may have learned in high school. However, in MQL5, they are applied from a different perspective within programming logic. They are thoroughly explained in the MQL5 documentation, along with other commonly used operations. Below is a list of the relational operators we use in our discussion.
- < (less than)
- > (greater than)
- == (equal to)
- != (not equal to)
- <= (less than or equal to)
- >= (greater than or equal to)
It's important to note that these operators are not limited to candlestick pattern programming alone. They can also be used to compare various market values, playing a crucial role in decision-making for algorithmic trading.
In time series data, each candlestick (or bar) is referenced by an index. The most recent bar has an index of 0, while older bars are referenced using increasing index values (e.g., 1, 2, 3, etc.). Understanding this helps in iterating through historical price data correctly.
3. Timeseries
A timeseries is a special type of array used to store historical price or indicator data, where the indexing is reversed. In a timeseries, the latest data (such as the current or most recent bar) is accessed at index 0, with older data following at higher index numbers.
ATR is a volatility indicator, which defines dynamic thresholds for candlestick patterns, ensuring adaptability to market conditions. For example, a Hammer pattern requires a small body (less than 30% of ATR) and a lower wick at least twice the body size, enabling flexible detection across different assets and timeframes.
The challenge is defining what “small,” “long,” or “large” means. A fixed value (e.g., 10 pips for a small body) won’t work consistently across different assets or market conditions. A 10-pip move might be significant for a low-volatility pair like EUR/USD on a 5-minute chart, but trivial for a volatile pair like GBP/JPY on a daily chart. This is where ATR shines—it provides a dynamic, volatility-adjusted threshold tailored to the asset and timeframe.
By using ATR, the conditions for identifying candlestick patterns become adaptive:
- In high-volatility markets (high ATR), a “small body” might be larger in absolute terms but still small relative to recent price swings.
- In low-volatility markets (low ATR), even a tiny absolute move could be considered significant.
5. MathAbs
MathAbs is a built-in function in MQL5 that calculates the absolute value (or modulus) of a number. The absolute value is simply the number’s distance from zero, always resulting in a non-negative (positive or zero) value.
How It Works in this context:
- If you give it a negative number, it flips it to positive. For example, MathAbs(-5) returns 5.
- If the number is already positive or zero, it stays the same. For example, MathAbs(5) returns 5, and MathAbs(0) returns 0.
In a candlestick pattern, MathAbs is used to measure the size of a candle’s body, which is the difference between the closing price (Close[1]) and the opening price (Open[1]), i.e., Close[1] - Open[1].
Why use MathAbs?
1. Because the body size needs to be a positive value, whether the candle is bullish (close > open) or bearish (close < open). For example:
- Bullish candle: Close[1] = 10, open[1] = 8 → 10 - 8 = 2.
- Bearish candle: Close[1] = 8, open[1] = 10 → 8 - 10 = -2, but MathAbs(8 - 10) = 2.
2. This ensures the body size is always positive for consistent comparison in pattern rules.
Comparing Prices with Relational Operators in MQL5
In MQL5, relational operators are essential tools that allow you to compare values, such as the open and close prices of a candlestick. The operators we mentioned above <, >, ==, !=, <=, and >= return either true (1) or false (0) and help determine whether a candle is bullish or bearish.
For instance,
- a bullish candleis identified when the condition close[0] > open[0] holds true, where [0] refers to the latest candle index.
On the other hand,
- a bearish candle is indicated by close[0] < open[0].
This basic comparison is the cornerstone of candlestick pattern recognition. Think of these comparisons as simple questions about the price: “Did the candle close higher than it opened?” If yes, you’re looking at a bullish signal.
Candlestick patterns
Based on my research, we can categorize candlestick patterns into two main types: single candlestick patterns and multiple candlestick patterns. Now, everything we've discussed so far will start coming together. To give you a clearer understanding, let’s briefly compare the two. I have prepared two tables with detailed information to highlight their difference
Single-Candlestick Pattern
When working with single-candle patterns, arithmetic operations are essential for measuring various aspects of a candlestick, such as its body size, wick lengths, and overall range. Single-candle patterns, like the Doji, which occurs when the open and close prices are nearly equal, are significant because they signal market indecision or potential reversals. By analyzing the differences between the open, high, low, and close, you can derive these patterns and gain insights into important market changes.
Doji candle
| Candlestick Name | Logical Description | Reference Image |
|---|---|---|
| Doji | A Doji candlestick pattern is identified when the open and close prices are very close or equal, indicating market indecision. This means open[1] ≈ close[1], while the high and low may vary significantly. A Doji can appear in different forms, such as a Long-Legged Doji, Dragonfly Doji, or Gravestone Doji, depending on the placement of wicks.// Check for Doji pattern if( MathAbs(Open[1] - Close[1]) < Point * 2 ) // Open and close are almost equal { Print("Doji pattern detected"); } |  |
Multi-Candlestick patterns
Multi-candlestick patterns require us to analyze the relationships between consecutive candlesticks. In MQL5, we use indexing to refer to past candles: close[1] represents the previous candle close price, while close[2] represents the one before it. A popular multi-candle pattern is the Bullish Engulfing, where a small bearish candle is followed by a larger bullish candle that completely "engulfs" the previous one.
To code this pattern, you would verify that the previous candle is bearish (using close[1] < open[1]), and then check that the current candle is bullish (using close[0] > open[0]) while also confirming that the current candle’s body extends beyond the boundaries of the previous candle. The conditions in your code ensure that the pattern follows the expected sequence and size relationships, which is critical for accurately detecting a Bullish Engulfing pattern.
| Candlestick Pattern | Logical Description | Reference image |
|---|---|---|
| Bullish Engulfing | A bullish engulfing pattern is identified when the candle at index 2 is bearish (its close is lower than its open, i.e., Close[2] < Open[2]), and the candle at index 1 is bullish (its close is higher than its open, i.e., Close[1] > Open[1]). In addition, the candle at index 1 must engulf the body of the candle at index 2 by opening below its close (Open[1] < Close[2]) and closing above its open (Close[1] > Open[2])// Check for bullish engulfing pattern if( Close[2] < Open[2] && // Candle at index 2 is bearish Close[1] > Open[1] && // Candle at index 1 is bullish Open[1] < Close[2] && // Candle at index 1 opens below candle at index 2 close Close[1] > Open[2] ) // Candle at index 1 closes above candle at index 2 open { Print("Bullish engulfing pattern detected"); } |  |
Building a collection of known candlestick patterns and a reusable candlestick pattern function library
To simplify the process, I have compiled two tables featuring a collection of well-known candlestick patterns and created a comprehensive reference table with a description column and a reference image column. This table will serve as a valuable resource both during development and for future readers. Additionally, it can be expanded and refined over time with new discoveries, making it easier to build a more complete and sophisticated candlestick pattern library.
Single-Candlestick Pattern Collection
| Candlestick Pattern | Logical Description | Reference image |
|---|---|---|
| Hammer | A hammer pattern is identified when the candle at index 1 has a small body (the absolute difference between its close and open is less than 0.3 times the ATR, i.e., MathAbs(Close[1] - Open[1]) < 0.3 * ATR), a long lower wick (the distance from the lower of open or close to the low is at least twice the body size, i.e., MathMin(Open[1], Close[1]) - Low[1] >= 2 * MathAbs(Close[1] - Open[1])), and a small or no upper wick (the distance from the higher of open or close to the high is less than or equal to half the body size, i.e., High[1] - MathMax(Open[1], Close[1]) <= 0.5 * MathAbs(Close[1] - Open[1]))// Check for Hammer pattern if( MathAbs(Close[1] - Open[1]) < 0.3 * ATR[1] && // Small body // Long lower wick (MathMin(Open[1], Close[1]) - Low[1]) >= 2 * MathAbs(Close[1] - Open[1]) && // Small or no upper wick (High[1] - MathMax(Open[1], Close[1]) <= 0.5 * MathAbs(Close[1] - Open[1])) { Print("Hammer pattern detected"); } |  |
| Shooting Star | A shooting star pattern is identified when the candle at index 1 has a small body (the absolute difference between its close and open is less than 0.3 times the ATR, i.e., MathAbs(Close[1] - Open[1]) < 0.3 * ATR), a long upper wick (the distance from the higher of open or close to the high is at least twice the body size, i.e., High[1] - MathMax(Open[1], Close[1]) >= 2 * MathAbs(Close[1] - Open[1])), and a small or no lower wick (the distance from the lower of open or close to the low is less than or equal to half the body size, i.e., MathMin(Open[1], Close[1]) - Low[1] <= 0.5 * MathAbs(Close[1] - Open[1]))// Check for Shooting Star pattern if( MathAbs(Close[1] - Open[1]) < 0.3 * ATR[1] && // Small body // Long upper wick (High[1] - MathMax(Open[1], Close[1]) >= 2 * MathAbs(Close[1] - Open[1]) && // Small or no lower wick (MathMin(Open[1], Close[1]) - Low[1]) <= 0.5 * MathAbs(Close[1] - Open[1]) ) { Print("Shooting Star pattern detected"); } |  |
| Standard Doji | A standard doji pattern is identified when the candle at index 1 has a minimal body, meaning the open and close are nearly equal (the absolute difference between its close and open is less than 0.1 times the ATR, i.e., MathAbs(Close[1] - Open[1]) < 0.1 * ATR)// Check for Standard Doji pattern if( MathAbs(Close[1] - Open[1]) < 0.1 * ATR[1] ) // Open and close are nearly equal { Print("Standard Doji pattern detected"); } | 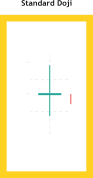 |
| Dragonfly Doji | A dragonfly doji pattern is identified when the candle at index 1 has a small body (the absolute difference between its close and open is less than 0.1 times the ATR, i.e., MathAbs(Close[1] - Open[1]) < 0.1 * ATR), a long lower wick (the distance from the lower of open or close to the low is greater than 0.5 times the ATR, i.e., MathMin(Open[1], Close[1]) - Low[1] > 0.5 * ATR), and little to no upper wick (the distance from the higher of open or close to the high is less than 0.1 times the ATR, i.e., High[1] - MathMax(Open[1], Close[1]) < 0.1 * ATR)// Check for Dragonfly Doji pattern if( MathAbs(Close[1] - Open[1]) < 0.1 * ATR[1] && // Small body (MathMin(Open[1], Close[1]) - Low[1]) > 0.5 * ATR[1] && // Long lower wick (High[1] - MathMax(Open[1], Close[1]) < 0.1 * ATR[1] ) // Little to no upper wick { Print("Dragonfly Doji pattern detected"); } | 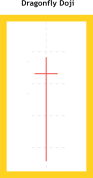 |
| Gravestone Doji | A gravestone doji pattern is identified when the candle at index 1 has a small body (the absolute difference between its close and open is less than 0.1 times the ATR, i.e., MathAbs(Close[1] - Open[1]) < 0.1 * ATR), a long upper wick (the distance from the higher of open or close to the high is greater than 0.5 times the ATR, i.e., High[1] - MathMax(Open[1], Close[1]) > 0.5 * ATR), and little to no lower wick (the distance from the lower of open or close to the low is less than 0.1 times the ATR, i.e., MathMin(Open[1], Close[1]) - Low[1] < 0.1 * ATR)// Check for Gravestone Doji pattern if( MathAbs(Close[1] - Open[1]) < 0.1 * ATR[1] && // Small body (High[1] - MathMax(Open[1], Close[1]) > 0.5 * ATR[1] && // Long upper wick (MathMin(Open[1], Close[1]) - Low[1]) < 0.1 * ATR[1] ) // Little to no lower wick { Print("Gravestone Doji pattern detected"); } |  |
| Bullish Marubozu | A bullish marubozu pattern is identified when the candle at index 1 is strongly bullish (its close is higher than its open, i.e., Close[1] > Open[1]) with almost no wicks, meaning the open is very close to the low (Open[1] - Low[1] < 0.1 * ATR) and the close is very close to the high (High[1] - Close[1] < 0.1 * ATR)// Check for Bullish Marubozu pattern if( Close[1] > Open[1] && // Bullish candle (High[1] - Close[1]) < 0.1 * ATR[1] && // Close is very close to high (Open[1] - Low[1]) < 0.1 * ATR[1] ) // Open is very close to low { Print("Bullish Marubozu pattern detected"); } |  |
| Bearish Marubozu | A bearish marubozu pattern is identified when the candle at index 1 is strongly bearish (its close is lower than its open, i.e., Close[1] < Open[1]) with almost no wicks, meaning the open is very close to the high (High[1] - Open[1] < 0.1 * ATR) and the close is very close to the low (Close[1] - Low[1] < 0.1 * ATR)// Check for Bearish Marubozu pattern if( Close[1] < Open[1] && // Bearish candle (High[1] - Open[1]) < 0.1 * ATR[1] && // Open is very close to high (Close[1] - Low[1]) < 0.1 * ATR[1] ) // Close is very close to low { Print("Bearish Marubozu pattern detected"); } |  |
| Spinning Top | A spinning top pattern is identified when the candle at index 1 has a small body (the absolute difference between its close and open is less than 0.3 times the ATR, i.e., MathAbs(Close[1] - Open[1]) < 0.3 * ATR) and long upper and lower wicks (the distance from the higher of open or close to the high is greater than 0.5 times the ATR, i.e., High[1] - MathMax(Open[1], Close[1]) > 0.5 * ATR, and the distance from the lower of open or close to the low is greater than 0.5 times the ATR, i.e., MathMin(Open[1], Close[1]) - Low[1] > 0.5 * ATR)// Check for Spinning Top pattern if( MathAbs(Close[1] - Open[1]) < 0.3 * ATR[1] && // Small body (High[1] - MathMax(Open[1], Close[1]) > 0.5 * ATR[1] && // Long upper wick (MathMin(Open[1], Close[1]) - Low[1]) > 0.5 * ATR[1] ) // Long lower wick { Print("Spinning Top pattern detected"); } |  |
Multi-Candlesticks Patterns Collection
| Candlestick Pattern | Logical Description | Reference image |
|---|---|---|
| Morning Star | A morning star pattern is identified when the candle at index 3 is bearish (its close is lower than its open, i.e., Close[3] < Open[3]), the candle at index 2 has a small body (the absolute difference between its close and open is less than 0.3 times the ATR, i.e., MathAbs(Close[2] - Open[2]) < 0.3 * ATR), and the candle at index 1 is bullish (its close is higher than its open, i.e., Close[1] > Open[1]). Additionally, the close of candle 1 must be above the midpoint of candle 3 (Close[1] > (Open[3] + Close[3]) / 2)// Check for Morning Star pattern if( Close[3] < Open[3] && // Candle at index 3 is bearish MathAbs(Close[2] - Open[2]) < 0.3 * ATR[1] && // Candle at index 2 has a small body Close[1] > Open[1] && // Candle at index 1 is bullish Close[1] > (Open[3] + Close[3]) / 2 ) // Candle at index 1 closes above midpoint of candle 3 { Print("Morning Star pattern detected"); } |  |
| Evening Star | An evening star pattern is identified when the candle at index 3 is bullish (its close is higher than its open, i.e., Close[3] > Open[3]), the candle at index 2 has a small body (the absolute difference between its close and open is less than 0.3 times the ATR, i.e., MathAbs(Close[2] - Open[2]) < 0.3 * ATR), and the candle at index 1 is bearish (its close is lower than its open, i.e., Close[1] < Open[1]). Additionally, the close of candle 1 must be below the midpoint of candle 3 (Close[1] < (Open[3] + Close[3]) / 2)// Check for Evening Star pattern if( Close[3] > Open[3] && // Candle at index 3 is bullish MathAbs(Close[2] - Open[2]) < 0.3 * ATR[1] && // Candle at index 2 has a small body Close[1] < Open[1] && // Candle at index 1 is bearish Close[1] < (Open[3] + Close[3]) / 2 ) // Candle at index 1 closes below midpoint of candle 3 { Print("Evening Star pattern detected"); } | 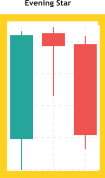 |
| Three White Soldiers | The three white soldiers pattern is identified when three consecutive bullish candles occur: candle at index 3 (Close[3] > Open[3]), candle at index 2 (Close[2] > Open[2]), and candle at index 1 (Close[1] > Open[1]). Each candle’s body must be larger than the ATR (e.g., Close[3] - Open[3] > ATR), have small upper wicks (e.g., High[3] - Close[3] < 0.3 * ATR), and each opens within the body of the previous candle (e.g., Open[2] > Open[3] && Open[2] < Close[3])// Check for Three White Soldiers pattern // Candle 3 is bullish with large body and small upper wick if( Close[3] > Open[3] && (Close[3] - Open[3]) > ATR[1] && (High[3] - Close[3]) < 0.3 * ATR[1] && // Candle 2 is bullish with large body and small upper wick Close[2] > Open[2] && (Close[2] - Open[2]) > ATR[1] && (High[2] - Close[2]) < 0.3 * ATR[1] && // Candle 1 is bullish with large body and small upper wick Close[1] > Open[1] && (Close[1] - Open[1]) > ATR[1] && (High[1] - Close[1]) < 0.3 * ATR[1] && // Candle 2 opens within candle 3's body and closes higher Open[2] > Open[3] && Open[2] < Close[3] && Close[2] > Close[3] && // Candle 1 opens within candle 2's body and closes higher Open[1] > Open[2] && Open[1] < Close[2] && Close[1] > Close[2] ) { Print("Three White Soldiers pattern detected"); } | 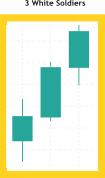 |
| Three Black Crows | The three black crows pattern is identified when three consecutive bearish candles occur: candle at index 3 (Close[3] < Open[3]), candle at index 2 (Close[2] < Open[2]), and candle at index 1 (Close[1] < Open[1]). Each candle’s body must be larger than the ATR (e.g., Open[3] - Close[3] > ATR), have small lower wicks (e.g., Open[3] - Low[3] < 0.3 * ATR), and each opens within the body of the previous candle (e.g., Open[2] < Open[3] && Open[2] > Close[3])// Check for Three Black Crows pattern // Candle 3 is bearish with large body and small lower wick if( Close[3] < Open[3] && (Open[3] - Close[3]) > ATR[1] && (Open[3] - Low[3]) < 0.3 * ATR[1] && // Candle 2 is bearish with large body and small lower wick Close[2] < Open[2] && (Open[2] - Close[2]) > ATR[1] && (Open[2] - Low[2]) < 0.3 * ATR[1] && // Candle 1 is bearish with large body and small lower wick Close[1] < Open[1] && (Open[1] - Close[1]) > ATR[1] && (Open[1] - Low[1]) < 0.3 * ATR[1] && // Candle 2 opens within candle 3's body and closes lower Open[2] < Open[3] && Open[2] > Close[3] && Close[2] < Close[3] && // Candle 1 opens within candle 2's body and closes lower Open[1] < Open[2] && Open[1] > Close[2] && Close[1] < Close[2] ) { Print("Three Black Crows pattern detected"); } | 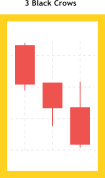 |
| Bullish Harami | A bullish harami pattern is identified when the candle at index 2 is bearish (its close is lower than its open, i.e., Close[2] < Open[2]) with a body larger than the ATR (Open[2] - Close[2] > ATR), and the candle at index 1 is bullish (its close is higher than its open, i.e., Close[1] > Open[1]) with its body entirely within the body of candle 2 (Open[1] > Close[2] && Close[1] < Open[2])// Check for Bullish Harami pattern // Candle 2 is bearish with large body if( Close[2] < Open[2] && (Open[2] - Close[2]) > ATR[1] && // Candle 1 is bullish and within candle 2's body Close[1] > Open[1] && Open[1] > Close[2] && Close[1] < Open[2] ) { Print("Bullish Harami pattern detected"); } | 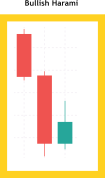 |
| Bearish Harami | A bearish harami pattern is identified when the candle at index 2 is bullish (its close is higher than its open, i.e., Close[2] > Open[2]) with a body larger than the ATR (Close[2] - Open[2] > ATR), and the candle at index 1 is bearish (its close is lower than its open, i.e., Close[1] < Open[1]) with its body entirely within the body of candle 2 (Open[1] < Close[2] && Close[1] > Open[2])// Check for Bearish Harami pattern // Candle 2 is bullish with large body if( Close[2] > Open[2] && (Close[2] - Open[2]) > ATR[1] && // Candle 1 is bearish and within candle 2's body Close[1] < Open[1] && Open[1] < Close[2] && Close[1] > Open[2] ) { Print("Bearish Harami pattern detected"); } | 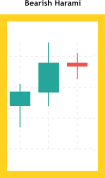 |
| Bullish Engulfing | A bullish engulfing pattern is identified when the candle at index 2 is bearish (its close is lower than its open, i.e., Close[2] < Open[2]), and the candle at index 1 is bullish (its close is higher than its open, i.e., Close[1] > Open[1]). In addition, the candle at index 1 must engulf the body of the candle at index 2 by opening below its close (Open[1] < Close[2]) and closing above its open (Close[1] > Open[2])// Check for Bullish Engulfing pattern if( Close[2] < Open[2] && // Candle at index 2 is bearish Close[1] > Open[1] && // Candle at index 1 is bullish Open[1] < Close[2] && // Candle at index 1 opens below candle at index 2's close Close[1] > Open[2] ) // Candle at index 1 closes above candle at index 2's open { Print("Bullish Engulfing pattern detected"); } | 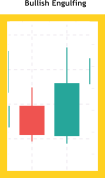 |
| Bearish Engulfing | A bearish engulfing pattern is identified when the candle at index 2 is bullish (its close is higher than its open, i.e., Close[2] > Open[2]), and the candle at index 1 is bearish (its close is lower than its open, i.e., Close[1] < Open[1]). In addition, the candle at index 1 must completely engulf the body of the candle at index 2 by opening above its close (Open[1] > Close[2]) and closing below its open (Close[1] < Open[2])// Check for Bearish Engulfing pattern if( Close[2] > Open[2] && // Candle at index 2 is bullish Close[1] < Open[1] && // Candle at index 1 is bearish Open[1] > Close[2] && // Candle at index 1 opens above candle at index 2's close Close[1] < Open[2] ) // Candle at index 1 closes below candle at index 2's open { Print("Bearish Engulfing pattern detected"); } | 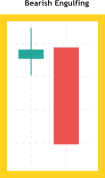 |
| Three Inside Up | The three inside up pattern is identified when the candle at index 3 is bearish (its close is lower than its open, i.e., Close[3] < Open[3]) with a large body (Open[3] - Close[3] > ATR), the candle at index 2 is bullish (Close[2] > Open[2]) and contained within candle 3 (Open[2] > Close[3] && Close[2] < Open[3]), and candle 1 is bullish (Close[1] > Open[1]) closing above the high of candle 2 (Close[1] > High[2])// Check for Three Inside Up pattern // Candle 3 is bearish with large body if( Close[3] < Open[3] && (Open[3] - Close[3]) > ATR[1] && // Candle 2 is bullish and within candle 3's body Close[2] > Open[2] && Open[2] > Close[3] && Close[2] < Open[3] && // Candle 1 is bullish and closes above candle 2's high Close[1] > Open[1] && Close[1] > High[2] ) { Print("Three Inside Up pattern detected"); } | 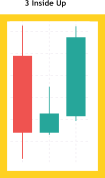 |
| Three Inside Down | The three inside down pattern is identified when the candle at index 3 is bullish (its close is higher than its open, i.e., Close[3] > Open[3]) with a large body (Close[3] - Open[3] > ATR), the candle at index 2 is bearish (Close[2] < Open[2]) and contained within candle 3 (Open[2] < Close[3] && Close[2] > Open[3]), and candle 1 is bearish (Close[1] < Open[1]) closing below the low of candle 2 (Close[1] < Low[2])// Check for Three Inside Down pattern // Candle 3 is bullish with large body if( Close[3] > Open[3] && (Close[3] - Open[3]) > ATR[1] && // Candle 2 is bearish and within candle 3's body Close[2] < Open[2] && Open[2] < Close[3] && Close[2] > Open[3] && // Candle 1 is bearish and closes below candle 2's low Close[1] < Open[1] && Close[1] < Low[2] ) { Print("Three Inside Down pattern detected"); } | 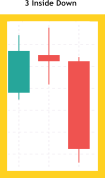 |
| Tweezer Bottom | A tweezer bottom pattern is identified when the candle at index 2 is bearish (its close is lower than its open, i.e., Close[2] < Open[2]), the candle at index 1 is bullish (its close is higher than its open, i.e., Close[1] > Open[1]), and the lows of both candles are nearly equal (the absolute difference between Low[2] and Low[1] is less than 0.1 times the ATR, i.e., MathAbs(Low[2] - Low[1]) < 0.1 * ATR)// Check for Tweezer Bottom pattern if( Close[2] < Open[2] && // Candle at index 2 is bearish Close[1] > Open[1] && // Candle at index 1 is bullish // Lows of both candles are nearly equal MathAbs(Low[2] - Low[1]) < 0.1 * ATR[1] ) { Print("Tweezer Bottom pattern detected"); } | 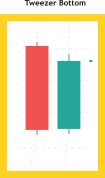 |
| Tweezer Top | A tweezer top pattern is identified when the candle at index 2 is bullish (its close is higher than its open, i.e., Close[2] > Open[2]), the candle at index 1 is bearish (its close is lower than its open, i.e., Close[1] < Open[1]), and the highs of both candles are nearly equal (the absolute difference between High[2] and High[1] is less than 0.1 times the ATR, i.e., MathAbs(High[2] - High[1]) < 0.1 * ATR)// Check for Tweezer Top pattern if( Close[2] > Open[2] && // Candle at index 2 is bullish Close[1] < Open[1] && // Candle at index 1 is bearish // Highs of both candles are nearly equal MathAbs(High[2] - High[1]) < 0.1 * ATR[1] ) { Print("Tweezer Top pattern detected"); } | 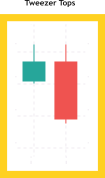 |
| Bullish Kicker | A bullish kicker pattern is identified when the candle at index 2 is bearish (its close is lower than its open, i.e., Close[2] < Open[2]), and the candle at index 1 is bullish (its close is higher than its open, i.e., Close[1] > Open[1]) with its open above the open of candle 2 (Open[1] > Open[2])// Check for Bullish Kicker pattern if( Close[2] < Open[2] && // Candle at index 2 is bearish // Candle at index 1 is bullish Close[1] > Open[1] && // Candle at index 1 opens above candle at index 2's open Open[1] > Open[2] ) { Print("Bullish Kicker pattern detected"); } | 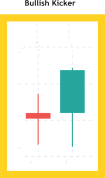 |
| Bearish Kicker | A bearish kicker pattern is identified when the candle at index 2 is bullish (its close is higher than its open, i.e., Close[2] > Open[2]), and the candle at index 1 is bearish (its close is lower than its open, i.e., Close[1] < Open[1]) with its open below the open of candle 2 (Open[1] < Open[2])// Check for Bearish Kicker pattern // Candle at index 2 is bullish if( Close[2] > Open[2] && // Candle at index 1 is bearish Close[1] < Open[1] && // Candle at index 1 opens below candle at index 2's open Open[1] < Open[2] { Print("Bearish Kicker pattern detected"); } | 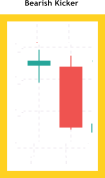 |
These tables could go on indefinitely, as there are many more patterns that I haven’t included. To keep the discussion concise, I will now shift focus to implementing these strategies within a single, meaningful program. The ultimate goal is to build a comprehensive candlestick pattern library.
I conducted research and found remarkable work in the MQL5 Codebase—developed by some of the pioneers of algorithmic trading more than a decade ago. You can explore their work for a more detailed approach. However, in this discussion, our goal is to keep things as simple as possible for beginners. With that in mind, we will now move forward with developing our own candlestick pattern library.
Building a reusable candlestick pattern header file
At this point, I will demonstrate how to create a function library that includes a collection of candlestick patterns. We refer to it as a library because it brings together multiple reusable pattern detection functions. Once developed, these patterns can be easily integrated into other projects simply by including the library and calling the functions as needed.
The proper term for this type of file is a header file, and I am excited to name it infinity_candlestick_pattern.mqh, reflecting its expandability, as more patterns can be added over time. I have structured it as a template, which I will later demonstrate in an indicator to show its practical usage.
In the attachments, I will share a more comprehensive version of the header file, containing functions for the patterns we listed earlier in the reference table. You can further expand this library by following the commented guidelines within the code snippet
The file includes two primary functions, IsHammer and IsShootingStar, which analyze arrays of price data along with an accompanying Average True Range (ATR) to determine whether a particular candlestick meets the conditions for these patterns. Each function verifies that the provided index is valid, calculates the candlestick's body size, and then evaluates the lengths of the wicks relative to both the body size and the ATR values. This careful approach quantifies visual trading patterns using precise mathematical criteria, enabling robust pattern recognition that adjusts to market volatility. Additionally, the use of the patternATR parameter (passed by reference) helps to prevent potential conflicts and warnings when the ATR value is used later in the example indicator, ensuring consistency in the value passed.
To integrate these functions into other projects, you can simply include this header file into your source code using an #include directive. Once included, they can call IsHammer or IsShootingStar function by passing the appropriate arrays and the index of interest.
//+------------------------------------------------------------------+
//|                     infinity_candlestick_pattern.mqh (Template)  |
//|                                   Copyright 2025, Metaquotes Ltd |
//|                                            https://www.mql5.com/ |
//+------------------------------------------------------------------+
#property copyright "Copyright 2025, Metaquotes Ltd"
#property link      "https://www.mql5.com/"
#ifndef INFINITY_CANDLESTICK_PATTERNS_MQH
#define INFINITY_CANDLESTICK_PATTERNS_MQH

//+------------------------------------------------------------------+
//| Single-Candlestick Pattern Functions                             |
//+------------------------------------------------------------------+

// Hammer Pattern
bool IsHammer(double &open[], double &high[], double &low[], double &close[], double &patternATR[], int index)
{
   if (index < 0) return false; // Ensure the index is valid

   // Calculate the body size (absolute difference between close and open)
   double body = MathAbs(close[index] - open[index]);

   // Check if the body is small relative to ATR (less than 30% of ATR)
   if (body >= 0.3 * patternATR[index]) return false;

   // Calculate wick lengths
   double upperWick = high[index] - MathMax(open[index], close[index]);
   double lowerWick = MathMin(open[index], close[index]) - low[index];

   // Hammer conditions: long lower wick (2x body), small upper wick (≤0.5x body)
   if (lowerWick >= 2 * body && upperWick <= 0.5 * body)
      return true;

   return false;
}

// Shooting Star Pattern
bool IsShootingStar(double &open[], double &high[], double &low[], double &close[], double &patternATR[], int index)
{
   if (index < 0) return false; // Ensure the index is valid

   // Calculate the body size (absolute difference between close and open)
   double body = MathAbs(close[index] - open[index]);

   // Check if the body is small relative to ATR (less than 30% of ATR)
   if (body >= 0.3 * patternATR[index]) return false;

   // Calculate wick lengths
   double upperWick = high[index] - MathMax(open[index], close[index]);
   double lowerWick = MathMin(open[index], close[index]) - low[index];

   // Shooting Star conditions: long upper wick (2x body), small lower wick (≤0.5x body)
   if (upperWick >= 2 * body && lowerWick <= 0.5 * body)
      return true;

   return false;
}

//+------------------------------------------------------------------+
//| How to Expand the Library                                        |
//+------------------------------------------------------------------+
// To add more patterns:
// 1. Create a new function, e.g., IsDoji, IsEngulfing, etc.
// 2. Use the same inputs: open[], high[], low[], close[], patternATR[], index
// 3. Define the pattern’s conditions (e.g., for Doji, check if open ≈ close)
// 4. Return true if the pattern matches, false otherwise
// 5. For multi-candle patterns, adjust the index check (e.g., index < 1 for 2 candles)
// 6. Use patternATR to adapt to volatility (optional)
// 7. Add comments to explain your logic

#endif
//+------------------------------------------------------------------+
Now, let’s move on to developing an indicator that demonstrates how to apply the header file we just created. I’ve decided to name it the Hammer&ShootingStar Indicator, as it will utilize our library to detect and visualize these two candlestick patterns on the chart. This will provide a practical example of how our reusable functions can be implemented in real trading scenarios. By including the library at the start of the indicator, we gain immediate access to the candlestick pattern recognition functions, thus IsHammer and IsShootingStar in this context. This modular design allows the indicator to focus on gathering and processing market data while delegating the pattern evaluation logic to the library, ensuring consistency and simplifying maintenance.
In the initialization phase (OnInit), the indicator sets up its buffers and chart properties, including the definition of two arrow plots that visually represent the detected patterns. It also creates an ATR handle, which is used to obtain market volatility data that the library functions require. During the calculation phase (OnCalculate), the indicator retrieves price data and ATR values, then iterates through the price series. At each iteration, it calls the library functions to check whether a particular candlestick meets the criteria for a hammer (buy signal) or a shooting star (sell signal). Depending on the outcome, the corresponding buffer is populated with either the price level where an arrow should be drawn.
Furthermore, the design of this indicator supports future expansion. You can easily add more buffers if additional pattern recognition functions are incorporated into the library. This flexible approach encourages the extension of the pattern library while maintaining a clean separation between the core indicator logic and the pattern detection algorithms. If you desire to gain more coding experience, you can build up more buffers using functions in the attached library.
//+------------------------------------------------------------------+
//|                                          Hammer&ShootingStar.mq5 |
//|                                   Copyright 2025, Metaquotes Ltd |
//|                                            https://www.mql5.com/ |
//+------------------------------------------------------------------+
#property copyright "Copyright 2025, Metaquotes Ltd"
#property link      "https://www.mql5.com/"
#property version   "1.00"
#property indicator_chart_window

//--- Include the library
#include <infinity_candlestick pattern.mqh>

//--- Indicator settings
#property indicator_chart_window
#property indicator_buffers 2
#property indicator_plots 2

#property indicator_type1 DRAW_ARROW
#property indicator_color1 0x0000FF
#property indicator_label1 "Sell "

#property indicator_type2 DRAW_ARROW
#property indicator_color2 0xFF0000
#property indicator_label2 "Buy "

//--- Indicator buffers and variables
double Buffer1[];
double Buffer2[];
double Open[];
double High[];
double Low[];
double Close[];
double atr[];
int atrHandle;

//+------------------------------------------------------------------+
//| Custom indicator initialization function                         |
//+------------------------------------------------------------------+
int OnInit()
{
   SetIndexBuffer(0, Buffer1);
   PlotIndexSetDouble(0, PLOT_EMPTY_VALUE, EMPTY_VALUE);
   PlotIndexSetInteger(0, PLOT_ARROW, 242);
   SetIndexBuffer(1, Buffer2);
   PlotIndexSetDouble(1, PLOT_EMPTY_VALUE, EMPTY_VALUE);
   PlotIndexSetInteger(1, PLOT_ARROW, 241);

   // Create ATR handle
   atrHandle = iATR(_Symbol, _Period, 14);
   if (atrHandle == INVALID_HANDLE)
   {
      Print("Failed to create ATR handle");
      return(INIT_FAILED);
   }
   return(INIT_SUCCEEDED);
}

//+------------------------------------------------------------------+
//| Custom indicator iteration function                              |
//+------------------------------------------------------------------+
int OnCalculate(const int rates_total,
                const int prev_calculated,
                const datetime& time[],
                const double& open[],
                const double& high[],
                const double& low[],
                const double& close[],
                const long& tick_volume[],
                const long& volume[],
                const int& spread[])
{
   // Copy price data and ATR
   if (CopyOpen(Symbol(), PERIOD_CURRENT, 0, rates_total, Open) <= 0) return(rates_total);
   ArraySetAsSeries(Open, true);
   if (CopyHigh(Symbol(), PERIOD_CURRENT, 0, rates_total, High) <= 0) return(rates_total);
   ArraySetAsSeries(High, true);
   if (CopyLow(Symbol(), PERIOD_CURRENT, 0, rates_total, Low) <= 0) return(rates_total);
   ArraySetAsSeries(Low, true);
   if (CopyClose(Symbol(), PERIOD_CURRENT, 0, rates_total, Close) <= 0) return(rates_total);
   ArraySetAsSeries(Close, true);
   if (CopyBuffer(atrHandle, 0, 0, rates_total, atr) <= 0) return(rates_total);
   ArraySetAsSeries(atr, true);

   ArraySetAsSeries(Buffer1, true);
   ArraySetAsSeries(Buffer2, true);

   // Main loop
   for (int i = rates_total-2; i >= 0; i--)
   {
      // Sell Supply (Shooting Star)
      if (IsShootingStar(Open, High, Low, Close, atr, i))
         Buffer1[i] = High[i]; // Arrow at high
      else
         Buffer1[i] = EMPTY_VALUE;

      // Buy Supply (Hammer)
      if (IsHammer(Open, High, Low, Close, atr, i))
         Buffer2[i] = Low[i]; // Arrow at low
      else
         Buffer2[i] = EMPTY_VALUE;
   }
   return(rates_total);
}
Testing
With everything integrated successfully, I was able to run the Hammer&ShootingStar Indicator on the MetaTrader 5 chart and observed excellent results. The indicator effectively identified and highlighted the candlestick patterns, demonstrating the accuracy and practicality of our library in real market conditions.
 Index.0,5 : Hammer&ShootingStar testing.")
Volatility 75 (1s) Index.0,5 : Hammer&ShootingStar testing
Conclusion
This discussion has been extensive, but it will serve as one of the most valuable and frequently revisited topics for reference and learning. With the algorithm now in place, we solved the problem of manually scanning for patterns. The process can be fully automated now, and without visual indicators on the chart, managing your strategies has never been easier. The algorithm ensures accuracy by handling all calculations, including ATR values, making the process both efficient and precise.
We’ve covered a wide range of concepts and techniques that are useful for programming candlestick patterns and building multi-buffer indicators. While this discussion primarily focused on candlestick patterns, we introduced an algorithmic approach to analyzing and utilizing them, making it especially useful for beginners looking to automate their trading strategies. Keep in mind that the signals generated by candlestick patterns may require additional filters to become reliable trading signals. The Codebase documentation is an excellent resource if you're looking to enhance the signals generated by candlestick patterns or add more advanced features.
I would love to see you share your outcomes from the attached code in the comments section. If time permits, I will revisit this topic to build on what we've accomplished so far and explore further advancements.| File Name | Description |
|---|---|
| infinity_candlestick_pattern.mqh | A header file containing a collection of boolean functions for the most popular candlestick patterns, ready to be called in other projects. |
| Hammer&ShootingStar.mq5, | An example indicator that integrates the infinity_candlestick_pattern.mqh library. |
- Free trading apps
- Over 8,000 signals for copying
- Economic news for exploring financial markets
You agree to website policy and terms of use